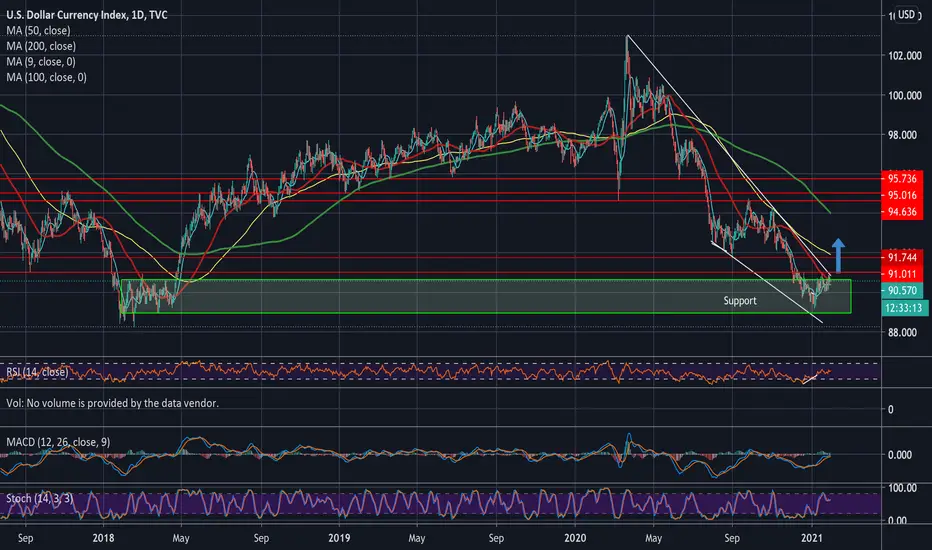
Here we can see that DXY has been moving nicely of support with a bullish divergence on the daily charts recently on the MACDH and RSI. My followers will know I shouted out that buy trade as soon as it happened (check prior post). Ever since Yellen said "we don't see a weaker dollar" last week equites have been in trouble and DXY has rallied. Price action the week before showed us what the big players were already thinking ie that DXY has short term bottomed.
So how do you trade from here?
Well we can see that we are right around the upside breakout point of the downward falling wedge just struggling a little at the first red historical resistance line. Downward falling wedges are reversal patterns as price gets squeezed moving lower showing bears are running out of steam and a nice reversal up is coming. This struggling at first resistance is actually great, as its causing prices to coil up, which should provide a nice springboard to the next resistance of around 91.7 -92 which is a dollar to a dollar and a half higher from here. Classic breakout reversal pattern.
Looking more closely at the 4hr and 1hr charts we can see both sets of moving averages are now very bullish.


So how to trade the breakout? We should always enter breakouts before not after as this maximises profit opportunity and guards against fake outs which happen the vast majority of the time. On the 1hr and 4hr charts we have two different golden pockets (between 50 and 200ma). We can use 5 min charts to see which golden pocket to place a buy in once they turn bullish in an oversold point on stochastic. We can then wait for the breakout above 91 to take profits. My expectation is that the first resistance red line on the major daily chart in my post (91) will become support though and this will springboard us higher to take profits at 91.6-92. I don't think there is much point holding for more after this stage we can wait for a pullback and re-enter if support at 91 holds.
So how do you trade from here?
Well we can see that we are right around the upside breakout point of the downward falling wedge just struggling a little at the first red historical resistance line. Downward falling wedges are reversal patterns as price gets squeezed moving lower showing bears are running out of steam and a nice reversal up is coming. This struggling at first resistance is actually great, as its causing prices to coil up, which should provide a nice springboard to the next resistance of around 91.7 -92 which is a dollar to a dollar and a half higher from here. Classic breakout reversal pattern.
Looking more closely at the 4hr and 1hr charts we can see both sets of moving averages are now very bullish.
So how to trade the breakout? We should always enter breakouts before not after as this maximises profit opportunity and guards against fake outs which happen the vast majority of the time. On the 1hr and 4hr charts we have two different golden pockets (between 50 and 200ma). We can use 5 min charts to see which golden pocket to place a buy in once they turn bullish in an oversold point on stochastic. We can then wait for the breakout above 91 to take profits. My expectation is that the first resistance red line on the major daily chart in my post (91) will become support though and this will springboard us higher to take profits at 91.6-92. I don't think there is much point holding for more after this stage we can wait for a pullback and re-enter if support at 91 holds.
Note
Trades for the short term are short equites on strength, buy DXY in golden pocket and swing trade Gold.Trade active
Here we can see things worked out perfectly on Friday with a nice opportunity to add right in the golden pocket. We can now hold the expected breakout and take profits at first resistance. Some may think this is too conservative but thats because the vast majority of amateurs get over exited with breakouts, whereas pro's recognise the vast majority of breakouts fail and so pro's, especially those on margin accs bank profits regularly and just look for new entries again if a breakout is too continue.
Trade active
Fib zones here, first fib retracement is around 92.5 so lets see how prices react at 91.6 whether we can squeeze a little more profit out. Euro looks awful at the moment with terrible GDP for the eurozone. Trade closed: target reached
Another textbook trade hope you followed and enjoyed some profits. I'm out here with the extreme bearish divergence on the hourly and taken a temporary short position now that I've banked great long profits from this dxy moveDisclaimer
The information and publications are not meant to be, and do not constitute, financial, investment, trading, or other types of advice or recommendations supplied or endorsed by TradingView. Read more in the Terms of Use.
Disclaimer
The information and publications are not meant to be, and do not constitute, financial, investment, trading, or other types of advice or recommendations supplied or endorsed by TradingView. Read more in the Terms of Use.