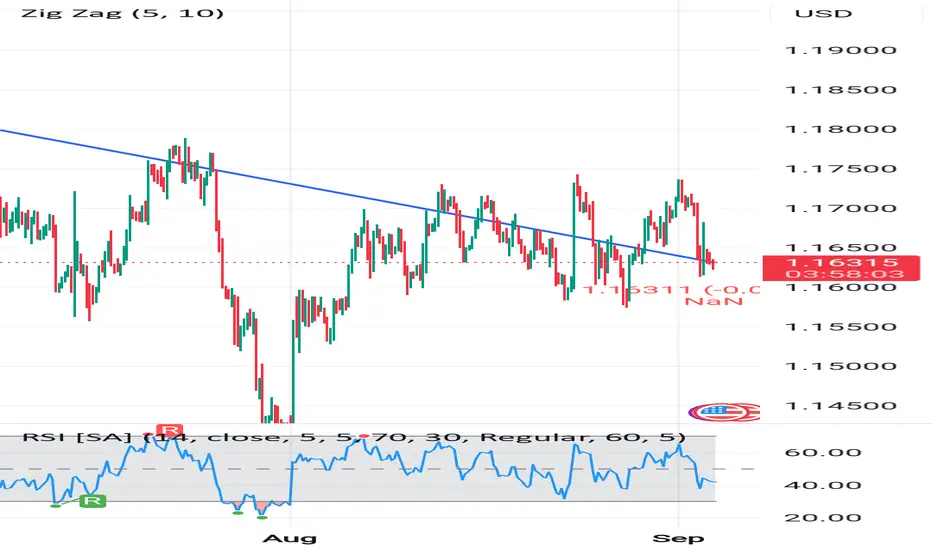
📉 Pair: EUR/USD
⏱ Timeframe: 4 Hours
💹 Current Price: 1.16312
Technical Overview
The EUR/USD pair is currently trading near 1.16312, showing bearish pressure after failing to hold above the 1.1650 zone. The price has been respecting a downward trendline, which has acted as dynamic resistance on multiple occasions.
A recent Zig Zag indicator setup highlights the swing highs and lows, confirming the presence of a descending pattern. Until the price breaks and sustains above this trendline, the bearish outlook remains intact.
Key Levels
Resistance: 1.1700 – 1.1750
Support: 1.1600 – 1.1520
RSI Indicator (14)
The RSI is currently hovering around the 40–45 range, suggesting mild bearish momentum but not yet oversold. A dip below 30 could indicate an oversold condition and potential for reversal.
Price Action Insights
A break below 1.1600 could open doors for further downside toward 1.1520.
On the upside, a clean break and retest above 1.1700 would invalidate the bearish structure and favor bulls.
Trading Plan
Bearish Scenario: Look for sell opportunities below 1.1650 with targets near 1.1600 and 1.1520.
Bullish Scenario: A breakout above 1.1700 may offer buy setups toward 1.1750 and 1.1800.
📊 Risk Management: Always use proper stop-loss and position sizing to manage risk effectively.
💬 What’s your bias on EUR/USD? Are you expecting a breakdown or reversal from here? Drop your analysis in the comments!
Disclaimer
The information and publications are not meant to be, and do not constitute, financial, investment, trading, or other types of advice or recommendations supplied or endorsed by TradingView. Read more in the Terms of Use.
Disclaimer
The information and publications are not meant to be, and do not constitute, financial, investment, trading, or other types of advice or recommendations supplied or endorsed by TradingView. Read more in the Terms of Use.