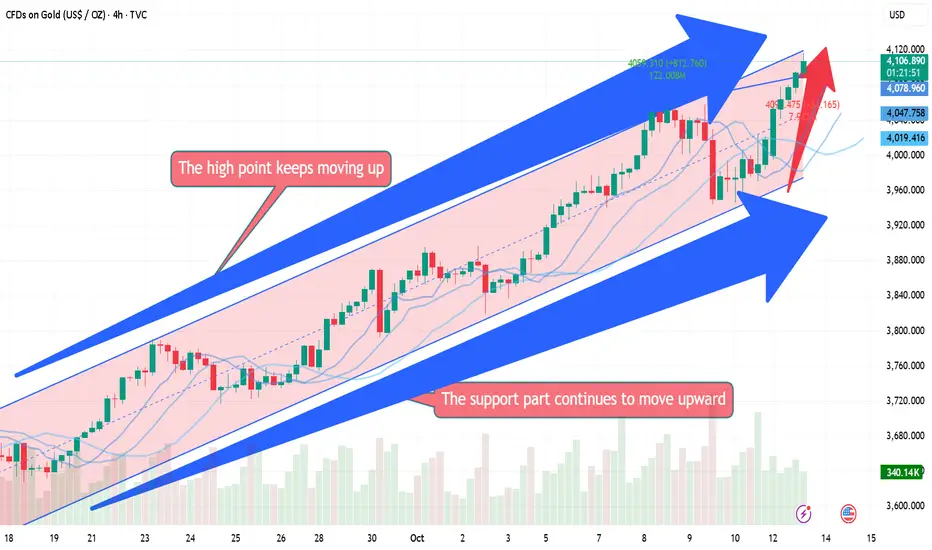
After breaking through the previous resistance band on the 4-hour chart, gold's candlestick chart continues to maintain a strong upward trend along the short-term moving average. There are still no signs of a peak in the short term, so focus on the support band around 4080. Currently, a purely technical correction in gold is unlikely to lead to a significant decline. The most likely scenario is a sudden sell-off or a rapid surge and then a decline to release bullish pressure, which may lead to some decent short-selling opportunities. On the hourly chart, the candlestick chart maintains a slight upward trend along the short-term moving average. Intraday pullbacks do not provide much room for improvement. Watch for short-term corrections in the closing market. Consider long positions around 3080-1.
Trade active
The market has no absolutes, nor fixed trends of ups and downs. Therefore, a balanced assessment of market fluctuations is your key to success. Let money be our loyal servant; otherwise, it will become a tyrannical master. If you have any questions about the market, please leave a message for David.Related publications
Disclaimer
The information and publications are not meant to be, and do not constitute, financial, investment, trading, or other types of advice or recommendations supplied or endorsed by TradingView. Read more in the Terms of Use.
Related publications
Disclaimer
The information and publications are not meant to be, and do not constitute, financial, investment, trading, or other types of advice or recommendations supplied or endorsed by TradingView. Read more in the Terms of Use.