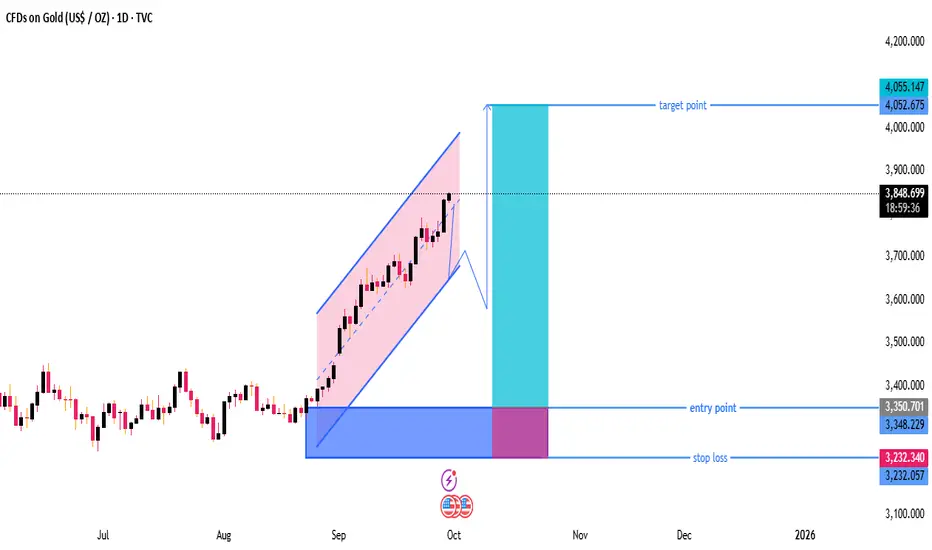
he chart shows XAU/USD (Gold) on a daily timeframe.
Price is currently trading around 3,848, within a rising parallel channel.
A possible pullback from the channel top is indicated before a move higher toward the target.
---
Key Levels & Zones
Entry Point:
Around 3,350 zone marked as the ideal buy area.
This is near the lower support region of previous consolidation.
Stop Loss:
Placed around 3,232, which is below key support.
Good for risk management — avoids staying in trade if price breaks structure.
Target Point:
Around 4,052 – 4,055, aligning with the measured move from the breakout of the channel.
This gives a strong risk-to-reward ratio (roughly 2.5:1).
---
Technical Structure
Trend: Strong uptrend – price respecting ascending channel.
Momentum: Higher highs and higher lows confirm bullish market structure.
Possible Scenario:
1. Short-term pullback expected to lower boundary or breakout retest zone.
2. Continuation move upward toward target (around 4,050).
---
Trading Plan Based on Chart
Wait for Pullback: Don’t buy at current level; price might retrace before next leg.
Enter near 3,350: Ideal long position entry point.
Stop Loss: 3,232 (safe under last swing low).
Target: 4,052–4,055 (previous high / projected channel top).
---
Summary
✅ Bias: Bullish (Buy-the-dip strategy)
📈 Entry: ~3,350
⛔ Stop Loss: ~3,232
🎯 Target: ~4,050
📊 Risk/Reward: Favorable — approx. 1:3
This setup is swing-trade friendly and follows trend continuation logic.
join my telegram channel t.me/goldmitalteamhttps://t.me/goldmitalteam
Disclaimer
The information and publications are not meant to be, and do not constitute, financial, investment, trading, or other types of advice or recommendations supplied or endorsed by TradingView. Read more in the Terms of Use.