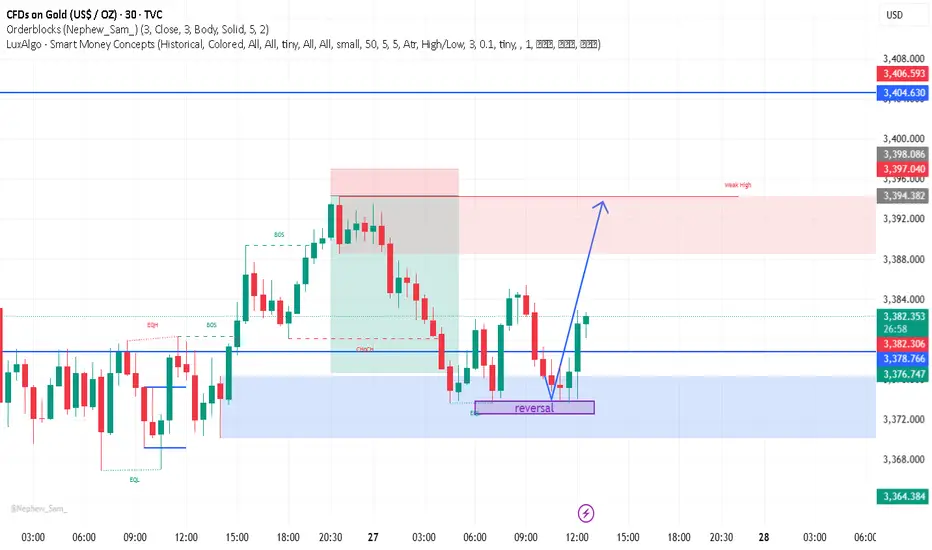
This gold (XAU/USD) 30-minute chart shows a recent **bullish reversal** after price reached a demand zone near 3,376–3,372. The chart highlights a “reversal” point within the blue demand area, where buyers stepped in to push price upward. A clear **change of character (ChoCH)** was noted earlier, and the price is now attempting to move higher. The projection (blue arrow) suggests a potential bullish continuation targeting the supply zone near 3,394–3,398, with resistance around 3,397 (weak high) and 3,404. Overall, the chart signals a possible short-term upside move if support at the demand zone holds.
Disclaimer
The information and publications are not meant to be, and do not constitute, financial, investment, trading, or other types of advice or recommendations supplied or endorsed by TradingView. Read more in the Terms of Use.
Disclaimer
The information and publications are not meant to be, and do not constitute, financial, investment, trading, or other types of advice or recommendations supplied or endorsed by TradingView. Read more in the Terms of Use.