🔑 Key Highlights
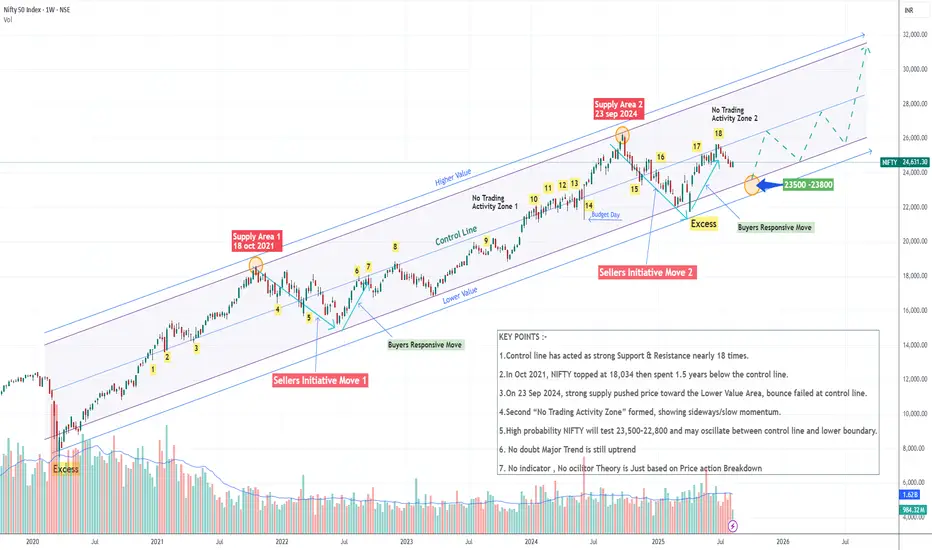
(1) Control Line as Key Zone
➡️The control line has acted as strong support and resistance multiple times (around 18 confirmations).
(2) Historical Example (Oct 2021)
➡️On 18 Oct 2021, NIFTY made a new high at 18,034.
➡️ The selling pressure was so intense that the index spent nearly 1.5 years trading below the control line.
(3) Recent Supply Zone (Sep 2024)
➡️On 23 Sep 2024, heavy selling activity pushed the market down toward the lower value area.
➡️Even after rebounding, the index once again faced resistance at the control line.
(4) No Trading Activity Zones
➡️The market has already formed one such zone in the past.
➡️Now a second “no trading activity zone” has been confirmed, showing reduced momentum and sideways behavior.
(5) Next Possible Move
➡️There is a high probability that NIFTY will attempt to test the Lower Value Area (23,500–22,800).
➡️After that, the market may oscillate between the control line and the lower boundary before deciding its next major direction.
👉 This entire analysis is based purely on DAMIR’s Price Action Breakdown theory, no indictor, no oscillator had been used.
Disclaimer
The information and publications are not meant to be, and do not constitute, financial, investment, trading, or other types of advice or recommendations supplied or endorsed by TradingView. Read more in the Terms of Use.
Disclaimer
The information and publications are not meant to be, and do not constitute, financial, investment, trading, or other types of advice or recommendations supplied or endorsed by TradingView. Read more in the Terms of Use.