Indian equity markets were the investors favorite for many years, and it did perform very well for the last 10 years. At its peak the index has generated 150% return for its investors in the last 5 years beating the S&P500 and even the tech heavy NASDAQ100. But since peaking in Sept 2024 the index has been lower to sideways for almost 12 months.
The recent poor price action in NIFTY has resulted in the index down more than 10% from its highs. With
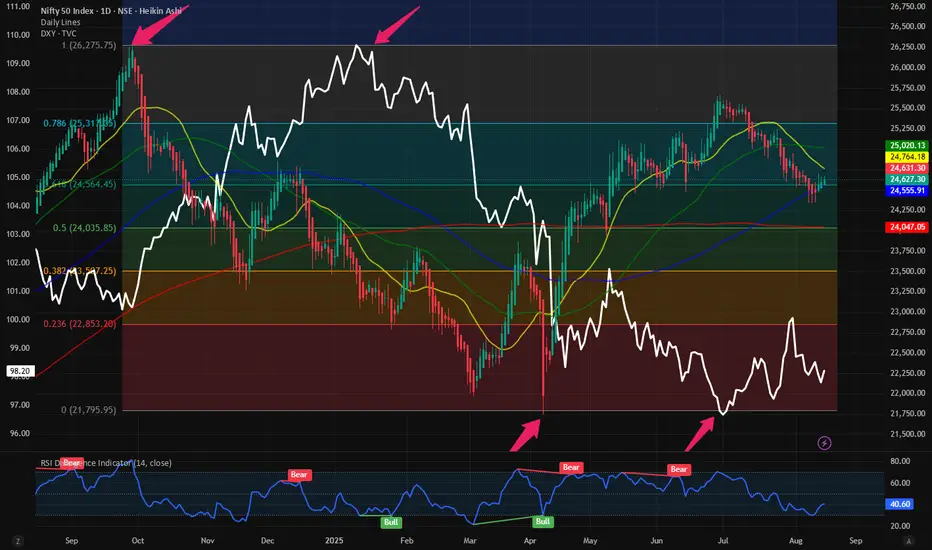
  SPX and
  NAS100 at or new their ATH and
  DXY below 100 the index is unable to break out of this poor price action. On July 27 we discussed this and concluded that the medium-term target of 2600 on NIFTY and 96 on DXY remains intact. Since then, we are more of less unchanged on both the indices. Now let’s look into the Fib retracement levels on the Daily chart of $NIFTY. The Tops and the bottom on the NIFTY correspond perfectly with that of $DXY.
We need a revision in our short to medium term expectation in bot the indices. Now I expect much poor price action withinNIFTY as it has very little momentum left to show for. We should be happy if we can touch the 0.786 Fib levels which is @ 25300 which indicates a meagre 3% upside from here.
Verdict: Underperform.NIFTY minimum upside potential in the index. Rather go long other risky assets to outperform the markets.
The recent poor price action in
We need a revision in our short to medium term expectation in bot the indices. Now I expect much poor price action within
Verdict: Underperform.
Related publications
Disclaimer
The information and publications are not meant to be, and do not constitute, financial, investment, trading, or other types of advice or recommendations supplied or endorsed by TradingView. Read more in the Terms of Use.
Related publications
Disclaimer
The information and publications are not meant to be, and do not constitute, financial, investment, trading, or other types of advice or recommendations supplied or endorsed by TradingView. Read more in the Terms of Use.