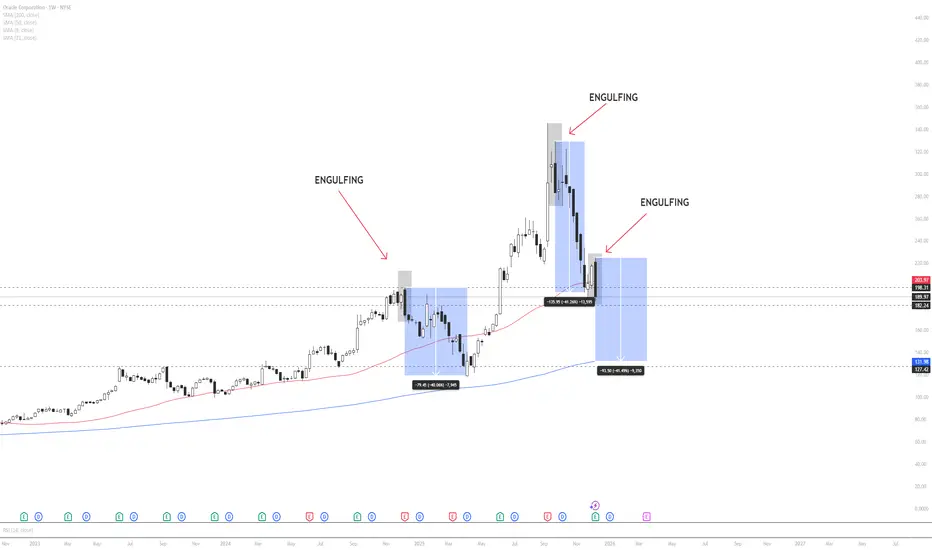
Oracle is currently trading in a weekly consolidation (flat) zone, indicating a neutral market structure. However, price has closed below the 50-period moving average, which often signals a shift in medium-term momentum.
A key technical development is the appearance of a weekly bearish engulfing candle, a pattern that historically precedes sharp downside moves in ORCL.
When analyzing previous occurrences of similar engulfing patterns, price declined by approximately 40% in the first instance and showed a nearly identical drawdown in the second instance. If historical behavior repeats, price may continue lower toward the 200-period moving average and the major support zone marked on the chart, which aligns closely with a projected ~40% correction.
Markets often exhibit recurring behavioral patterns, especially in higher timeframes. For this reason, downside risk remains elevated unless price reclaims the 50 MA and invalidates the engulfing structure.
This analysis is based on historical probability and technical structure and is not financial advice. Traders should manage risk accordingly.
Disclaimer
The information and publications are not meant to be, and do not constitute, financial, investment, trading, or other types of advice or recommendations supplied or endorsed by TradingView. Read more in the Terms of Use.
Disclaimer
The information and publications are not meant to be, and do not constitute, financial, investment, trading, or other types of advice or recommendations supplied or endorsed by TradingView. Read more in the Terms of Use.