🔍 Bearish Disruption Perspective
1. Supply Zone Rejection
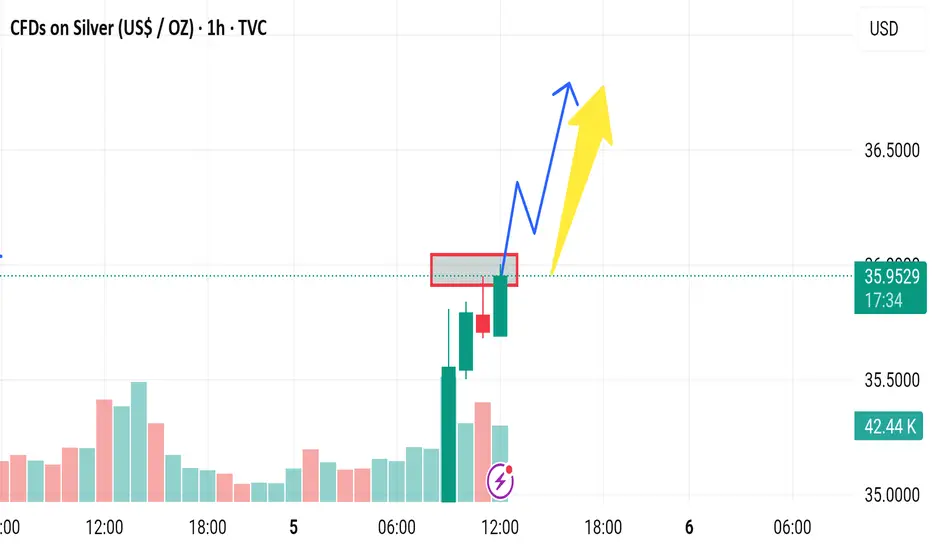
The red box marks a strong resistance zone. Current price action shows rejection at that level (long upper wicks).
This signals that sellers are defending this zone, increasing the likelihood of a false breakout.
2. Exhaustion After Strong Rally
The massive green candle just before the resistance may have exhausted short-term buying power.
Without a clear consolidation or volume surge, the price could reverse or retrace to gather strength.
3. Volume Discrepancy
Volume spikes with price often suggest conviction. However, this chart shows moderate volume on the test of resistance—not enough to confirm breakout strength.
4. Bearish Candlestick Pattern
The small red candle following the green surge could be forming a bearish engulfing or rejection candle, depending on the close.
1. Supply Zone Rejection
The red box marks a strong resistance zone. Current price action shows rejection at that level (long upper wicks).
This signals that sellers are defending this zone, increasing the likelihood of a false breakout.
2. Exhaustion After Strong Rally
The massive green candle just before the resistance may have exhausted short-term buying power.
Without a clear consolidation or volume surge, the price could reverse or retrace to gather strength.
3. Volume Discrepancy
Volume spikes with price often suggest conviction. However, this chart shows moderate volume on the test of resistance—not enough to confirm breakout strength.
4. Bearish Candlestick Pattern
The small red candle following the green surge could be forming a bearish engulfing or rejection candle, depending on the close.
Disclaimer
The information and publications are not meant to be, and do not constitute, financial, investment, trading, or other types of advice or recommendations supplied or endorsed by TradingView. Read more in the Terms of Use.
Disclaimer
The information and publications are not meant to be, and do not constitute, financial, investment, trading, or other types of advice or recommendations supplied or endorsed by TradingView. Read more in the Terms of Use.