⚠️ Disruption of the Bullish Analysis:
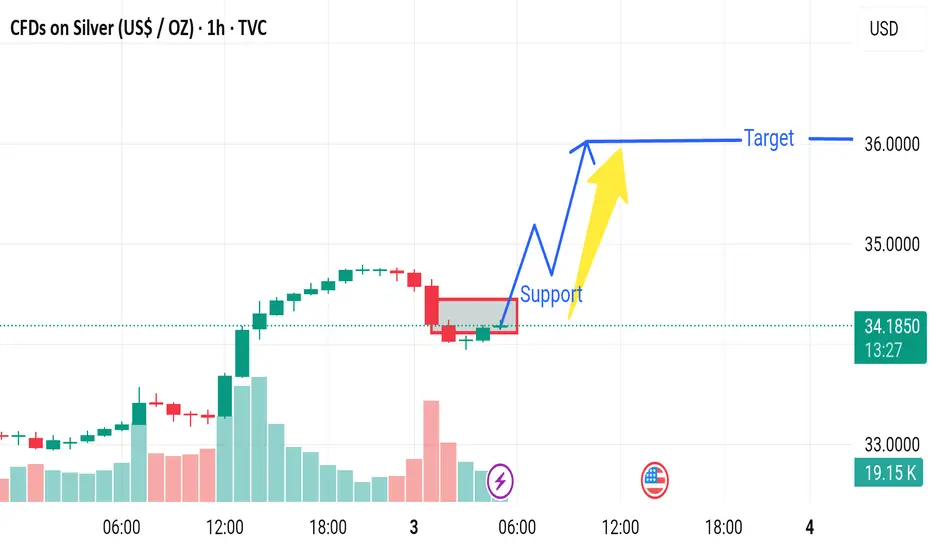
1. Weak Support Zone
The highlighted support area is not strongly tested (only a couple of candles touch it).
Low volume around support may indicate lack of buying interest at that level.
If price breaks below this support, the bullish setup becomes invalid.
2. Bearish Volume Spike
There's a noticeable high volume red candle during the recent drop.
This could imply strong selling pressure, not just profit-taking.
Rising volume on red candles often precedes further downside.
3. Lower High Formation
The price may create a lower high near the projected bounce zone.
If that happens, the market structure would shift to bearish.
A lower high and a break below support confirms a downtrend.
Disclaimer
The information and publications are not meant to be, and do not constitute, financial, investment, trading, or other types of advice or recommendations supplied or endorsed by TradingView. Read more in the Terms of Use.
Disclaimer
The information and publications are not meant to be, and do not constitute, financial, investment, trading, or other types of advice or recommendations supplied or endorsed by TradingView. Read more in the Terms of Use.