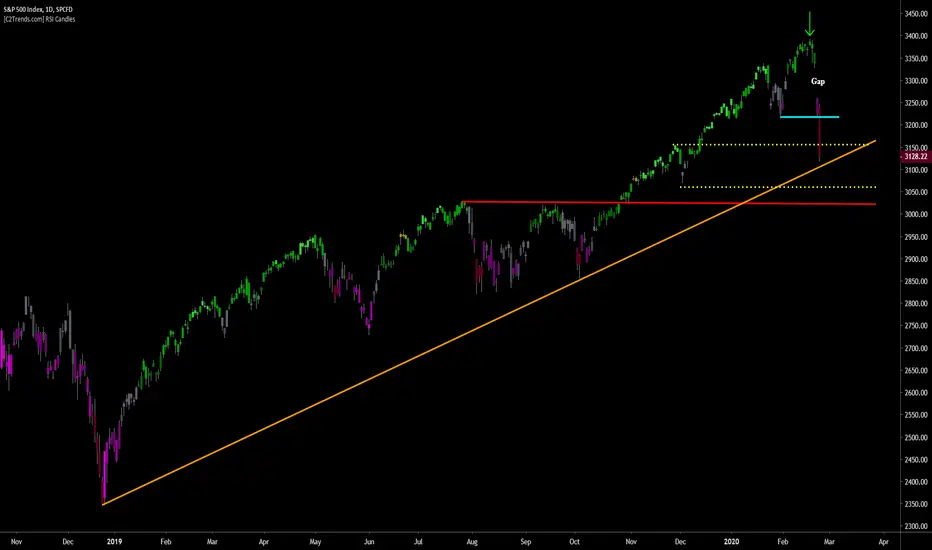
The S&P 500, along with all other equity indices, saw another significant move down today with price opening at $3,238 and closing at $3,128 for a -3% loss, and a two-day decline of -6% to start off the week. With this two-day decline traders have now wiped out all of 2020’s gains and have taken stocks back to December 2019 levels.
With today’s decline price also fell and closed below the blue line which represented the last base in price just prior to new all-time highs being made(green arrow); the blue line stems from the local low made on January 31st and is the level that price fell to yesterday and held at as other technical traders/algorithms were likely set to do some dip-buying at that level. Price falling below that blue line support level today indicates that traders who were previously bullish and buying at that level no longer see value there now.
In last nights chart I drew two dashed yellow lines representing potential areas of price support should price fall lower today, with the upper yellow line stemming from a previous peak in price, or area of price resistance, and the lower yellow line stemming from a previous base, or area of price support. Price was unable to hold at the upper yellow line today and should the lower yellow line fail to act as support as well tomorrow the last bullish level that I’m watching for potential support to keep the longer-term uptrend in play is the red line. The red line stems from two previous peaks in price, or levels of resistance where traders were reluctant to push prices higher. In technical analysis, previous areas of resistance tend to become levels of price support once price is above them. The more times price touches a line the stronger the level becomes, meaning that the red line near $3,030 is the most probable area of support should price continue lower for a third day tomorrow.
Worth noting is that price ended today just above the orange diagonal line. This line is drawn from the low made on December 24th 2018 to the low made on October 3rd 2019, and then extended into the future and can be viewed as a potential level where will price could find support, or hold and bounce back up from. Trend lines such as this require three price touches to be validated though, so viewing it as a strong level of support now would be premature.
For now the most important level that needs to hold as support is the red line as a violation of that price level would begin to do some damage to the chart from a technical perspective. It is yet to be seen if the pullback this week is a bull market pullback, which the market has been overdue for some time now, or if this is the beginning of something more bearish.
For now if in a long trade, the move is to continue holding as long as price remains above the red line. There is still a large gap in price from last weeks close to yesterdays open and I'm still expecting either Jerome Powell or one of the other members of the Federal Reserve to being talking about money printing and/or lowering interest rates to combat Covid19 which is the cause of this weeks decline. Some bullish Fed Speak could cause a quick rally back up to fill the gap, and for now a -6% decline isn't reason enough to turn bearish on markets.
Disclaimer
The information and publications are not meant to be, and do not constitute, financial, investment, trading, or other types of advice or recommendations supplied or endorsed by TradingView. Read more in the Terms of Use.
Disclaimer
The information and publications are not meant to be, and do not constitute, financial, investment, trading, or other types of advice or recommendations supplied or endorsed by TradingView. Read more in the Terms of Use.