Volatile market conditions tend to be quiet and fairly still for long periods of time and then over short periods of time tremendous moves happen.
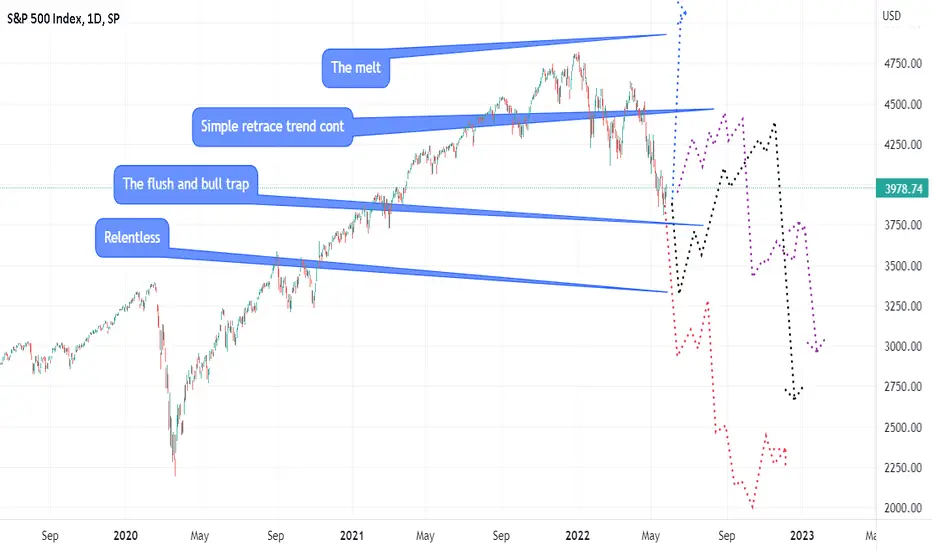
Big moves often happen after fake-out moves in the other direction. The market swinging rapidly to both sides and then settling into a strong move in one direction. These are all very hard things to deal with on the fly and it's always beneficial to decide what areas you need to make big decisions and which types of decisions you're making. Here are four possible ways a bear may form based on common crash norms/trend models.
1 - The melt. Rapid move to 161 extension of this current drop. I think this move is under threat of failing to hold the required levels for it (Although it hasn't actually broken out yet and it'd not be the first time I'd be tricked into flip-flopping on a false breakout, so we'll see what happens).
The melt move where we retrace 38.2 and boom to 161 in classic Elliot wave 5 style is the trader's dream. I think perhaps that move is behind us and the 2021 rally with no big pullbacks was wave 5.
2 - Classic trend cont
Probably my preferred of the possible patterns where the high is already in. This move would make a low around where we are and start to enter into a higher lows rally persistently pushing up to the 76 retracement fib. In this move I'd get nailed my current positions but more than be able to make up for it long the rally to 76 fib. We also then usually form a high in a fairly predictable range around the 76 fib for a huge bear trade.
3 - The flush. What I am currently positioned for and think looks most likely. The market has grinded on down for a while. There's a lot of rallies but they've tended to push back to lows. A long period of consolidation on a level flagging up different types of bull signals. Despite these things we've clearly not broken the downtrend yet and our current action feels like a bigger version of the chop before the drop to 3820.
The flush is the best opportunity. Once the low is broken (And sometimes after a sharp rally from that) there are usually 3 - 4 big bear candles. We usually trade outside the previous ATR and beat the IV of short-term options, making it an interesting time to speculate on these types of low win rate/high pay-off strategies. A flush move usually fully recovers. Sells off again later, but anyone short from the high of the leg who does not take profit can see trades go red.
4 - Relentless selling. Seems improbable. Most indices crashes have a big complex multi month bull trap. We have a couple bull trap moves in place but they are single leg ones. Usually we see something more like (Or exactly) a harmonic pattern. Taking a long time to carve out the shape of a big W on large charts, then go parabolic into a spike-out before entering into the relentless selling part. I'd be surprised to see total bull failure on all levels, but if that did happen it'd likely be first stop -50%. Some sort of bull trap setting up from the breaking of the March 2020 low.
While we're below 4125 I'll follow trade plans suited to benefit from the flush. If we break there I'll probably switch the plans that would benefit from the melt/retrace trade. If we break through 3300 in relentless selling I'll take it in the teeth for a little while and once my levels have clearly broken look to reverse and trade the bear breaks.
I think the major decision zone for the next big swing is 3800 - 4100. The market will come big and strong out of one of these zones when it's broken. Up or down.
We may be inside of a crash event to 3000 in SPX.
Read the full case with backlog of historic analysis/forecasts here: holeyprofitnewsletter.substack.com/p/the-case-for-3000-in-spx
Read the full case with backlog of historic analysis/forecasts here: holeyprofitnewsletter.substack.com/p/the-case-for-3000-in-spx
Disclaimer
The information and publications are not meant to be, and do not constitute, financial, investment, trading, or other types of advice or recommendations supplied or endorsed by TradingView. Read more in the Terms of Use.