Overview
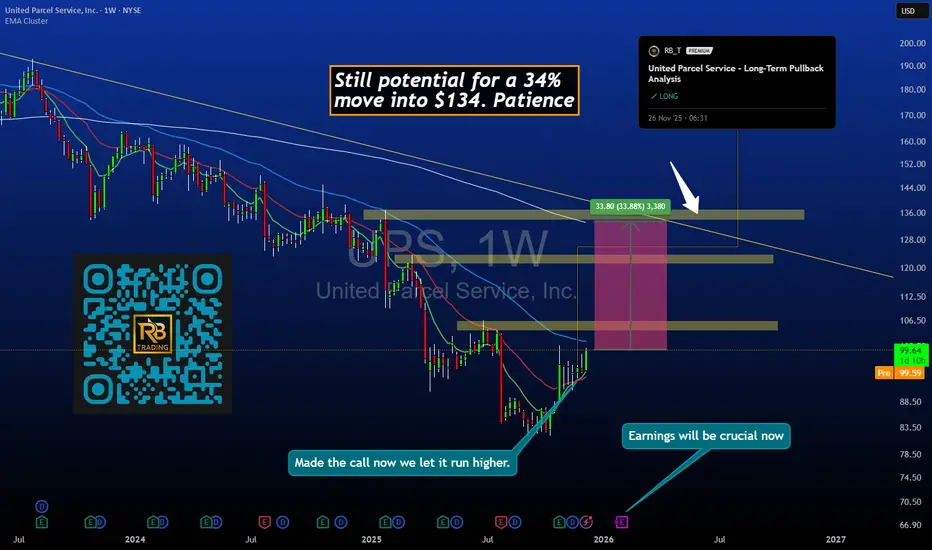
Our November 26 entry on UPS at $95 is performing as expected. Price is now trading near $99 for a gain of +4.2%. More importantly, the structural road map targeting $134 remains fully valid. The move so far represents the early phase of a multi-month recovery, not the completion of the idea.
Original Setup
• Entry: $95
• Stop: $88
• Target: $134
• Time-frame: 3 to 6 months
• Structure: Deep pullback into major demand with multiple confluences including Fibonacci support, high-volume accumulation, and technical exhaustion
• Thesis: Sentiment-driven decline into value created an asymmetric long opportunity
Current Price Action
Since entry, UPS has:
• Respected the $95 demand zone
• Formed higher lows on the daily chart
• Shown early accumulation
• Transitioned momentum from oversold to neutral and improving
The bounce into $99 confirms early strength and aligns with the expected path toward the $110-115 intermediate region.
Why $134 Still Stands
The $134 objective is anchored by:
• Prior structural resistance
• Fibonacci extension alignment
• A clean volume gap between $105 and $134
• Historical acceptance at higher prices
From current levels, the remaining upside is still substantial. This is where the bulk of the idea plays out.
Technical Structure
Daily:
• Higher lows forming
• Price reclaimed 20-day moving average
• Increasing volume on advances
• Momentum indicators recovering
Weekly:
• Major support at $95 held cleanly
• Downtrend break developing
• Structure suggests the corrective phase is ending
Key zones:
• Support: $95-97
• First resistance: $103-105
• Mid-target: $115-118
• Final target: $134
Position Management
For entries at $95:
• Hold the core position as the structure remains fully intact
• Consider scaling at $115-118, then $125-128, then final exits near $134
• Keep the stop at $88 until price clears $105, then break-even becomes optional
• Use weekly swing lows to guide any trailing approach
The goal is to let the multi-month structure play out rather than taking quick profits early.
Psychology Note
Many traders exit too soon because small gains feel rewarding. The entry at $95 required conviction. The hold toward $134 requires patience. Small early moves are confirmation, not completion.
Timeline Outlook
• Weeks 1-2: Early bounce (completed)
• Months 1-2: Move toward 110-115 zone
• Months 3-4: Consolidation and mid-target testing
• Months 4-6: Attempt toward $134
The current action fits this road-map perfectly.
Risk Factors
• A weekly close below $88 invalidates the long thesis
• Broad market weakness could slow progress
• Company-specific events or earnings surprises may affect trajectory
Key Takeaway
UPS is behaving exactly as the original thesis anticipated. +4.2% is early confirmation with far more potential remaining. As long as structure remains intact, the $134 target continues to be the primary objective.
Script Access: DM me on TradingView to request access.
Learn more: rbtrading.substack.com/p/premium-tradingview-indicators-hub
Learn more: rbtrading.substack.com/p/premium-tradingview-indicators-hub
Related publications
Disclaimer
The information and publications are not meant to be, and do not constitute, financial, investment, trading, or other types of advice or recommendations supplied or endorsed by TradingView. Read more in the Terms of Use.