📊  US100 Analysis: Detailed trading scenario at key price level 24,443.6 🚀
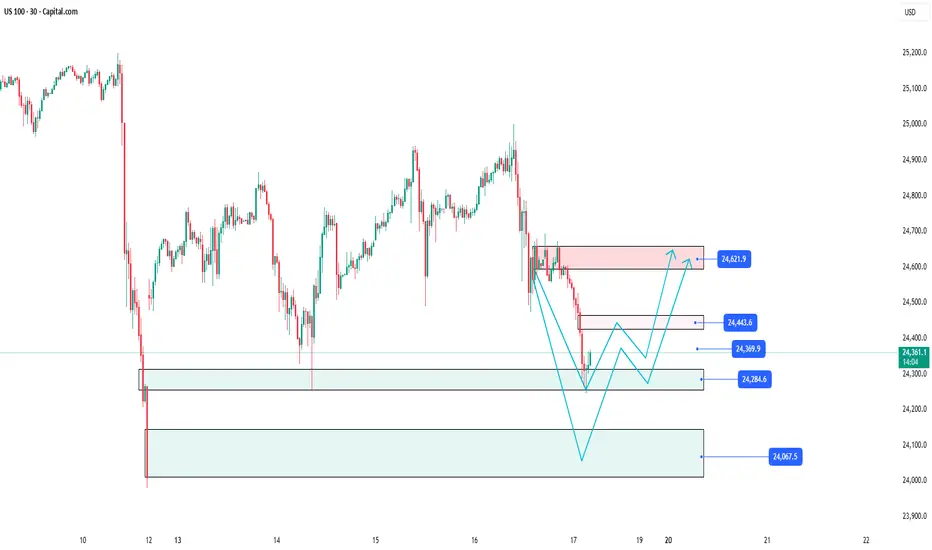
The US 100 30-minute chart is currently illustrating a clear picture of price movements with significant support and resistance zones. At the moment, the price is undergoing a strong correction after a deep decline and is approaching crucial price areas, creating multiple potential trading opportunities for investors.
________________________________________
Support Zone 24,284.6 – The starting point for a potential bounce 💥
Currently, the price is nearing the technical support level around 24,284.6 – a key support area that is expected to hold considerable buying interest, potentially triggering a short-term bounce. Buyers may step in here to prevent further declines and initiate a recovery trend.
Careful observation of price action around this zone is essential as it will determine the market’s next momentum: whether the price will rebound or break lower.
________________________________________
Immediate Resistance Levels and the Imbalance Zone at 24,443.6 🔍
Following a bounce from the 24,284.6 support, the expected scenario is a gradual move upwards to test important resistance levels:
• First at 24,369.9, where initial selling pressure may emerge, challenging the upward momentum.
• Next at 24,443.6, identified as a significant imbalance zone on the chart — a price level where price previously moved rapidly, creating a notable supply-demand gap.
• This zone acts as a technical “wall,” a crucial checkpoint before the price can continue its upward trend or get pushed back down.
________________________________________
Detailed Price Movement Scenario 🔄
1. Price bounces from the support at 24,284.6, setting the stage for a recovery leg.
2. Price moves up to test the first resistance at 24,369.9; the reaction here indicates the buyers’ strength.
3. Price then challenges the imbalance zone at 24,443.6 — where significant selling pressure may occur.
4. At this level, two scenarios may unfold:
• Price breaks above 24,443.6, confirming the uptrend and targeting the next resistance at 24,621.9.
• Price rejects this zone, leading to selling pressure that pushes price back to retest the 24,284.6 support or even lower.
________________________________________
Downside scenario if support at 24,284.6 fails 🛡️
In the worst case, if price breaks below the crucial support at 24,284.6, further declines toward a broader support zone at 24,067.5 are likely. This level may act as the next key area for price stabilization and buyer interest before any potential rebound.
Harry Andrew @ ZuperView
The US 100 30-minute chart is currently illustrating a clear picture of price movements with significant support and resistance zones. At the moment, the price is undergoing a strong correction after a deep decline and is approaching crucial price areas, creating multiple potential trading opportunities for investors.
________________________________________
Support Zone 24,284.6 – The starting point for a potential bounce 💥
Currently, the price is nearing the technical support level around 24,284.6 – a key support area that is expected to hold considerable buying interest, potentially triggering a short-term bounce. Buyers may step in here to prevent further declines and initiate a recovery trend.
Careful observation of price action around this zone is essential as it will determine the market’s next momentum: whether the price will rebound or break lower.
________________________________________
Immediate Resistance Levels and the Imbalance Zone at 24,443.6 🔍
Following a bounce from the 24,284.6 support, the expected scenario is a gradual move upwards to test important resistance levels:
• First at 24,369.9, where initial selling pressure may emerge, challenging the upward momentum.
• Next at 24,443.6, identified as a significant imbalance zone on the chart — a price level where price previously moved rapidly, creating a notable supply-demand gap.
• This zone acts as a technical “wall,” a crucial checkpoint before the price can continue its upward trend or get pushed back down.
________________________________________
Detailed Price Movement Scenario 🔄
1. Price bounces from the support at 24,284.6, setting the stage for a recovery leg.
2. Price moves up to test the first resistance at 24,369.9; the reaction here indicates the buyers’ strength.
3. Price then challenges the imbalance zone at 24,443.6 — where significant selling pressure may occur.
4. At this level, two scenarios may unfold:
• Price breaks above 24,443.6, confirming the uptrend and targeting the next resistance at 24,621.9.
• Price rejects this zone, leading to selling pressure that pushes price back to retest the 24,284.6 support or even lower.
________________________________________
Downside scenario if support at 24,284.6 fails 🛡️
In the worst case, if price breaks below the crucial support at 24,284.6, further declines toward a broader support zone at 24,067.5 are likely. This level may act as the next key area for price stabilization and buyer interest before any potential rebound.
Please like and comment below to support our traders. Your reactions will motivate us to do more analysis in the future 🙏✨
Harry Andrew @ ZuperView
Disclaimer
The information and publications are not meant to be, and do not constitute, financial, investment, trading, or other types of advice or recommendations supplied or endorsed by TradingView. Read more in the Terms of Use.
Disclaimer
The information and publications are not meant to be, and do not constitute, financial, investment, trading, or other types of advice or recommendations supplied or endorsed by TradingView. Read more in the Terms of Use.