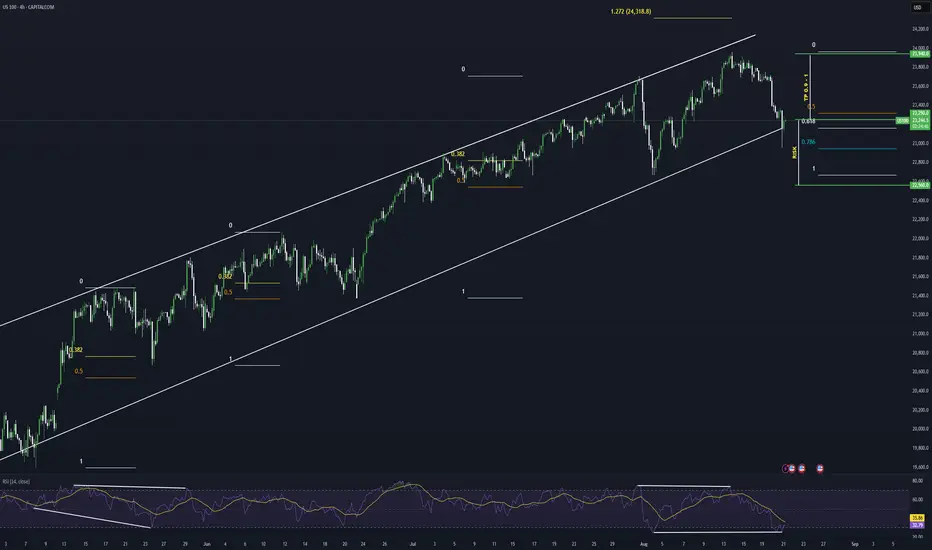
NASDAQ price action seems to exhibit signs of potential Bullish momentum as the price action may form a credible Higher Low with multiple confluences through key Fibonacci and Support levels which presents us with a potential long opportunity.
Trade Plan:
Entry : 23250
Stop Loss : 22560
TP 0.9 - 1: 23870 - 23940
Trade Plan:
Entry : 23250
Stop Loss : 22560
TP 0.9 - 1: 23870 - 23940
Trade closed: target reached
0.9 RR achieved close tradeDisclaimer
The information and publications are not meant to be, and do not constitute, financial, investment, trading, or other types of advice or recommendations supplied or endorsed by TradingView. Read more in the Terms of Use.
Disclaimer
The information and publications are not meant to be, and do not constitute, financial, investment, trading, or other types of advice or recommendations supplied or endorsed by TradingView. Read more in the Terms of Use.