NASDAQ going according to last week's plan. Eyes on 1D MA50/100.
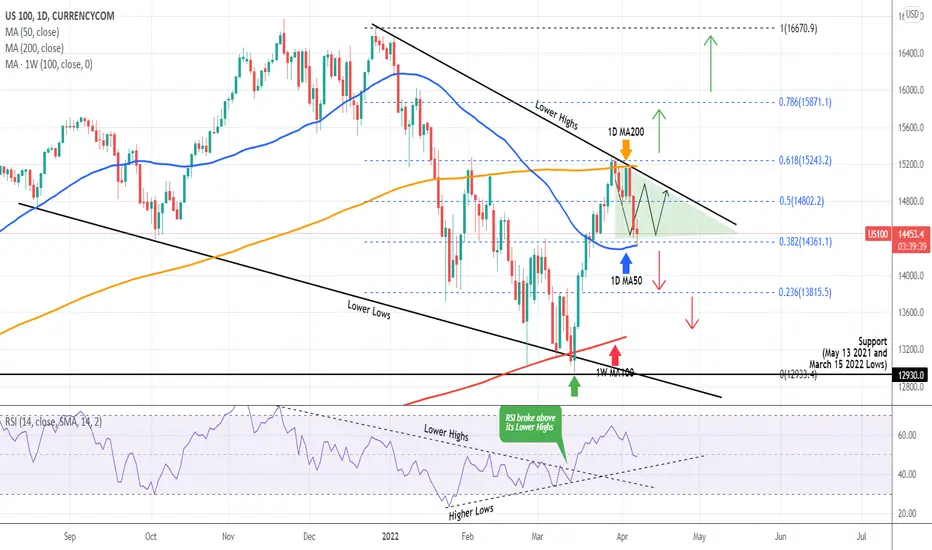
Nasdaq (NDX)has is following exactly last week's suggested trading plan so far, as it pulled-back from the 1D MA200 (orange trend-line) and today reached the 1D MA50 (blue trend-line):

This pull-back took place primarily because the index failed to break above the Lower Highs trend-line of the December 28 High and got rejected two times. So far, as I displayed with the green Triangle, this is a neutral zone. Some scalping value can be found within. However the medium-term trend is about to be revealed:
* A break below the 1D MA50 (needs a 1D candle closing below), which is also the 0.382 Fibonacci retracement level, opens the way for more selling towards Fib 0.236 (13815) and the 1W MA100 (red trend-line), which supported twice before on February 24 and March 15.
* A break above the Lower Highs or better yet the 1D MA200, which is also the 0.618 Fibonacci retracement level, restores the bullish trend aiming at Fib 0.786 (15870) and the 16670 High. The 1D RSI so far favors the bullish scenario.
--------------------------------------------------------------------------------------------------------
** Please support this idea with your likes and comments, it is the best way to keep it relevant and support me. **
--------------------------------------------------------------------------------------------------------
👑Best Signals (Forex/Crypto+70% accuracy) & Account Management (+20% profit/month on 10k accounts)
💰Free Channel t.me/tradingshotglobal
🤵Contact info@tradingshot.com t.me/tradingshot
🔥New service: next X100 crypto GEMS!
💰Free Channel t.me/tradingshotglobal
🤵Contact info@tradingshot.com t.me/tradingshot
🔥New service: next X100 crypto GEMS!
Disclaimer
The information and publications are not meant to be, and do not constitute, financial, investment, trading, or other types of advice or recommendations supplied or endorsed by TradingView. Read more in the Terms of Use.