🚀 US2000 Index – Thief Plan: LSMA Pullback + Layered Entries 📊
📌 Trading Plan (Swing / Day Trade)
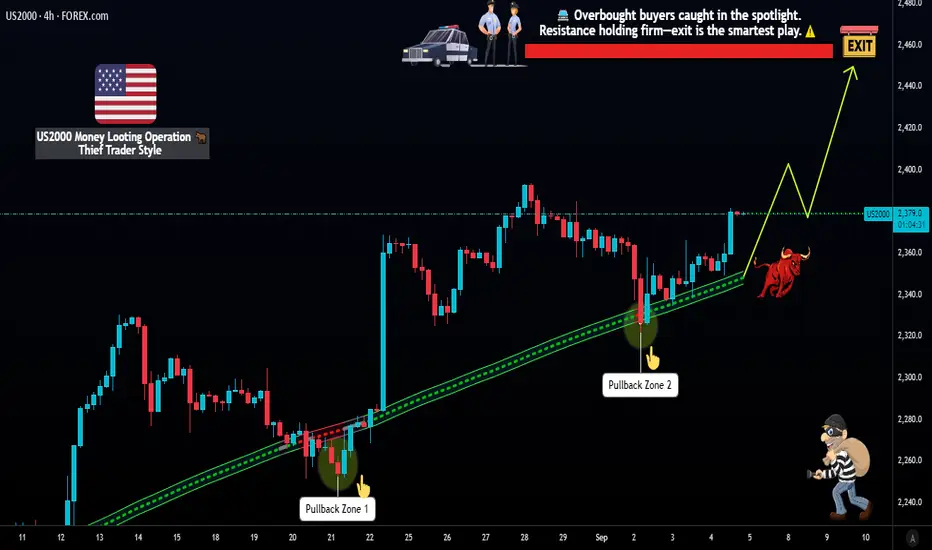
Strategy: Bullish LSMA moving average pullback plan 📈
Thief Style Entries (Layering Method):
Multiple buy-limit layers at 2340 / 2350 / 2360 / 2370
You can increase layers based on your own strategy & risk 🧩
Stop Loss (SL): Thief SL @ 2310 (adjust based on your own plan & risk) 🛡️
Target (TP): Strong resistance at 2450 ⚠️ – “Police barricade” 🚓
Note: This is not a fixed TP recommendation. Thief OG’s 🎭, take profits where it fits your risk and reward. 💰
❓ Why This Plan? (Thief Logic)
🔹 Technical (Thief Strategy)
Bulls loading pressure with LSMA pullback signals 🐂.
Layered entries reduce timing risk and allow multiple profit grabs.
Strong resistance ahead at 2450 = escape zone before “police barricade” 🚨.
🔹 Sentimental Reasoning
Retail sentiment 58% bullish 🟢 vs. 32% bearish 🔴 → optimism is leaning upward.
Institutions also show 52% bullish bias, confirming retail direction ⚖️.
Fear & Greed index at 52/100 = Neutral 😐 → balanced emotions, not overheated.
🔹 Fundamental Reasoning
Earnings growth ~12% expected in 2025 💼 supporting equity demand.
Consumer spending still rising (+0.5% in July) 🛍️ keeps the economy resilient.
Fed policy steady at 4.25%–4.50% 🏦 = stable environment for stocks.
🔹 Macro Reasoning
Inflation above Fed target (Core PCE 2.9% y/y) 📈 = caution flag.
Trade tariffs 🌐 add uncertainty, but no crash-level risk.
Fed rate cut expected in September 🔽 = bullish fuel if confirmed.
👉 Thief Conclusion: Fundamentals 💼 + Sentiment 🧠 + Macro 🌍 align with a slightly bullish thief setup. The layering style plan matches the market bias → stack the layers, steal the profits, and escape before 2450 barricade hits 🚀💰.
*********************************************************************************************************************
📊 US2000 Index CFD Data Report – September 5, 2025
🕒 Real-Time Snapshot
Daily Change: +0.89% (+19.12 pts) 🚀
Monthly Trend: +3.28% 📅
Yearly Trend: +18.21% 🌟
😊 Investor Sentiment Outlook
Retail Traders:
Bullish: 58% 🐂
Bearish: 32% 🐻
Neutral: 10% ⚖️
Institutional Traders:
Bullish: 52% 🐂
Bearish: 38% 🐻
Neutral: 10% ⚖️
🌡️ Fear & Greed Index
Current: 52/100 (Neutral) 😐
Fear: Below 45
Greed: Above 55
Market mood balanced ⚖️
📈 Fundamental Score: 72/100
Corporate earnings growth ~12% (2025 outlook) 💼
Consumer spending resilient (+0.5% in July) 🛍️
Fed funds steady at 4.25%–4.50% 🏦
🌍 Macro Score: 65/100
Inflation still above target (Core PCE 2.9% y/y) 📈
Tariff policies = trade uncertainty 🌐
Fed rate cut expected September 🔽
🐂🐻 Overall Market Outlook: Slightly Bullish
Score: 68/100 🐂
Reason: Strong earnings + consumer demand support upside, but tariffs + inflation cap growth. Expect consolidation with bullish tilt 🚀
🔑 Key Takeaways
Neutral → bullish tilt 😐➡️🐂
Retail + institutional both lean optimistic ⚖️
Fundamentals strong 💼, macro mixed 🌍
Payroll data = key Fed signal today 📊
Thief Plan aligns with market bias & LSMA pullback 📈
👀 Related Pairs to Watch
 US30
US30
 SPX500
 NAS100
 DXY
DXY
 VIX
VIX
✨ “If you find value in my analysis, a 👍 and 🚀 boost is much appreciated — it helps me share more setups with the community!”
#US2000 #Russell2000 #IndexTrading #ThiefPlan #SwingTrade #DayTrading #StockIndices #MarketOutlook #FearAndGreed #TradingStrategy
📌 Trading Plan (Swing / Day Trade)
Strategy: Bullish LSMA moving average pullback plan 📈
Thief Style Entries (Layering Method):
Multiple buy-limit layers at 2340 / 2350 / 2360 / 2370
You can increase layers based on your own strategy & risk 🧩
Stop Loss (SL): Thief SL @ 2310 (adjust based on your own plan & risk) 🛡️
Target (TP): Strong resistance at 2450 ⚠️ – “Police barricade” 🚓
Note: This is not a fixed TP recommendation. Thief OG’s 🎭, take profits where it fits your risk and reward. 💰
❓ Why This Plan? (Thief Logic)
🔹 Technical (Thief Strategy)
Bulls loading pressure with LSMA pullback signals 🐂.
Layered entries reduce timing risk and allow multiple profit grabs.
Strong resistance ahead at 2450 = escape zone before “police barricade” 🚨.
🔹 Sentimental Reasoning
Retail sentiment 58% bullish 🟢 vs. 32% bearish 🔴 → optimism is leaning upward.
Institutions also show 52% bullish bias, confirming retail direction ⚖️.
Fear & Greed index at 52/100 = Neutral 😐 → balanced emotions, not overheated.
🔹 Fundamental Reasoning
Earnings growth ~12% expected in 2025 💼 supporting equity demand.
Consumer spending still rising (+0.5% in July) 🛍️ keeps the economy resilient.
Fed policy steady at 4.25%–4.50% 🏦 = stable environment for stocks.
🔹 Macro Reasoning
Inflation above Fed target (Core PCE 2.9% y/y) 📈 = caution flag.
Trade tariffs 🌐 add uncertainty, but no crash-level risk.
Fed rate cut expected in September 🔽 = bullish fuel if confirmed.
👉 Thief Conclusion: Fundamentals 💼 + Sentiment 🧠 + Macro 🌍 align with a slightly bullish thief setup. The layering style plan matches the market bias → stack the layers, steal the profits, and escape before 2450 barricade hits 🚀💰.
*********************************************************************************************************************
📊 US2000 Index CFD Data Report – September 5, 2025
🕒 Real-Time Snapshot
Daily Change: +0.89% (+19.12 pts) 🚀
Monthly Trend: +3.28% 📅
Yearly Trend: +18.21% 🌟
😊 Investor Sentiment Outlook
Retail Traders:
Bullish: 58% 🐂
Bearish: 32% 🐻
Neutral: 10% ⚖️
Institutional Traders:
Bullish: 52% 🐂
Bearish: 38% 🐻
Neutral: 10% ⚖️
🌡️ Fear & Greed Index
Current: 52/100 (Neutral) 😐
Fear: Below 45
Greed: Above 55
Market mood balanced ⚖️
📈 Fundamental Score: 72/100
Corporate earnings growth ~12% (2025 outlook) 💼
Consumer spending resilient (+0.5% in July) 🛍️
Fed funds steady at 4.25%–4.50% 🏦
🌍 Macro Score: 65/100
Inflation still above target (Core PCE 2.9% y/y) 📈
Tariff policies = trade uncertainty 🌐
Fed rate cut expected September 🔽
🐂🐻 Overall Market Outlook: Slightly Bullish
Score: 68/100 🐂
Reason: Strong earnings + consumer demand support upside, but tariffs + inflation cap growth. Expect consolidation with bullish tilt 🚀
🔑 Key Takeaways
Neutral → bullish tilt 😐➡️🐂
Retail + institutional both lean optimistic ⚖️
Fundamentals strong 💼, macro mixed 🌍
Payroll data = key Fed signal today 📊
Thief Plan aligns with market bias & LSMA pullback 📈
👀 Related Pairs to Watch
✨ “If you find value in my analysis, a 👍 and 🚀 boost is much appreciated — it helps me share more setups with the community!”
#US2000 #Russell2000 #IndexTrading #ThiefPlan #SwingTrade #DayTrading #StockIndices #MarketOutlook #FearAndGreed #TradingStrategy
Trade active
Trade closed: target reached
📈 US2000 INDEX CFD Live Feed ReportAs of October 6, 2025 (Markets closed; latest close October 3, 2025. US markets halted due to government shutdown – data reflects pre-shutdown feed. As a trader note: CFDs mirror the spot Russell 2000 index (^RUT),
🔍 Step 1: Current Price Snapshot
Live Price: 2,476.18 USD
Explanation: This is the closing value of the Russell 2000 index, tracking ~2,000 small-cap US stocks. Up 17.69 points (+0.72%) from prior session – shows mild daily gain amid broader equity recovery, but shutdown delays real-time updates. For CFD trading, this sets your entry baseline; volatility may spike on reopen.
📊 Step 2: Fundamental Score
Score: 7/10 (Strong Earnings Momentum)
Explanation: Based on Q3 2025 blended earnings growth estimate of 43.4% year-over-year (ex-energy: 42.4%). Of early reporters, 76.9% beat expectations. Small-caps like US2000 benefit from domestic focus, with Q3/Q4 growth projected at 43% and 73.8% – indicates healthy corporate profits driving upside potential, though sensitive to rate changes.
🌍 Step 3: Macro Score Points
Score: 6/10 (Stable but Shutdown-Impacted)
Explanation: Combines key US economic feeds. GDP Q3 estimate at 3.8% annualized growth supports small-cap expansion, but government shutdown risks data delays and fiscal uncertainty. Inflation at 2.9% (August CPI) is cooling toward Fed's 2% target, easing pressure on small firms with high debt. Overall, macro favors resilience if shutdown resolves quickly.
🗓️ Step 4: Seasonal Tendencies
October Historical Performance: Average -0.5% monthly return (1989-2025 data)
Explanation: September-October window often sees volatility from historical events (e.g., portfolio rebalancing, fiscal year-end). Russell 2000 averages slight downside in October, but Q4 rebounds 74% of time with +2.8% gains – watch for "Santa rally" buildup if earnings hold strong. Simple takeaway: Enter cautiously early-month, scale in on dips.
💰 Step 5: Key Macro Rates
Interest Rates: Fed Funds at 4.25% (post-September cut)
Explanation: Recent 0.25% cut boosts small-caps (40% more floating-rate debt than large-caps), freeing ~$15B in cash flow. Markets price 100% chance of October cut, 88% for December – lowers borrowing costs, aiding US2000 growth stocks.
Inflation Rates: 2.9% YoY (August CPI; September data due October 15)
Explanation: Up from 2.7%, but food-at-home CPI +2.7% shows moderation. Cooling trend reduces Fed hike risks, benefiting rate-sensitive small-caps without overheating economy.
GDP Rates: 3.8% annualized (Q3 nowcast; Q2 actual +3.8%)
Explanation: Steady expansion from consumer spending and AI investments. Small-caps thrive in domestic GDP upticks, but Q1 contraction (-0.6%) highlights cycle risks – current feed signals soft landing.
🏦 Step 6: Bank Orders Flow
Latest Flow: Neutral to Bullish (Institutional accumulation in weakness)
Explanation: H.8 Fed report (October 3) shows stable commercial bank assets/liabilities; no major small-cap drawdown. Footprint delta shows positive buying (more ask-traded volume) despite price dips – banks positioning for rate cuts, with hedge funds shorting less aggressively. Simple view: Flows support longs if volatility eases.
😊 Step 7: Trader Sentiment Outlook
Retail Traders: 55% Bullish (Net long bias)
Explanation: Retail leans optimistic on small-cap rotation post-rate cuts; AAII surveys show rising bulls amid earnings beats. Measures mood via options volume – put/call ratio below 1 signals confidence, but high leverage risks quick shifts.
Institutional Traders: 60% Bullish (Accumulating on dips)
Explanation: Big players (hedge funds, pensions) show positive delta divergence – buying weakness while hedging volatility. CFTC data implies reduced shorts; 69% of retail CFD accounts lose on leverage, so institutions dominate flow for sustained moves.
📈 Step 8: Overall Investor Mood Measures
Fear & Greed Index: 54 (Neutral)
Explanation: CNN gauge blends volatility (VIX low), momentum (above 125-day average), and breadth (more highs than lows). Neutral means balanced risk – not extreme fear (buy signal) or greed (sell warning). Ties to US2000: Steady mood supports small-cap parity with large-caps in Q3.
🐂 Step 9: Overall Market Outlook Score
Score: Bull (Long) – 65/100
Explanation: Earnings surge + rate cuts outweigh seasonal dips and shutdown noise. Small-caps like US2000 lead rotation (Q3 parity with S&P 500); mood neutral but flows bullish. As trader correction: Focus on reopen volatility – long CFDs on pullbacks, but hedge with stops given 69% retail loss rate on these instruments.
💰 Money-Making Analysis
• Forex💹
• Indices📈
• Crypto ₿
• Commodities⚡
• Stocks🏦
• Fundamental + Macro📊
• Sentiment🔎
👉 Ask what analysis you need & get it FREE!
Join Discord for signals + data & grab the Master Plan: discord.gg/ZQS3y7FhVr
• Forex💹
• Indices📈
• Crypto ₿
• Commodities⚡
• Stocks🏦
• Fundamental + Macro📊
• Sentiment🔎
👉 Ask what analysis you need & get it FREE!
Join Discord for signals + data & grab the Master Plan: discord.gg/ZQS3y7FhVr
Related publications
Disclaimer
The information and publications are not meant to be, and do not constitute, financial, investment, trading, or other types of advice or recommendations supplied or endorsed by TradingView. Read more in the Terms of Use.