DOW JONES Top of the Channel Up. Pull-back possible.
It's been a while since I updated my Dow Jones thesis. The most recent one (Oct 13) was on the short-term 4H time-frame, where I identified a buy signal on this Inverse Head and Shoulders pattern:

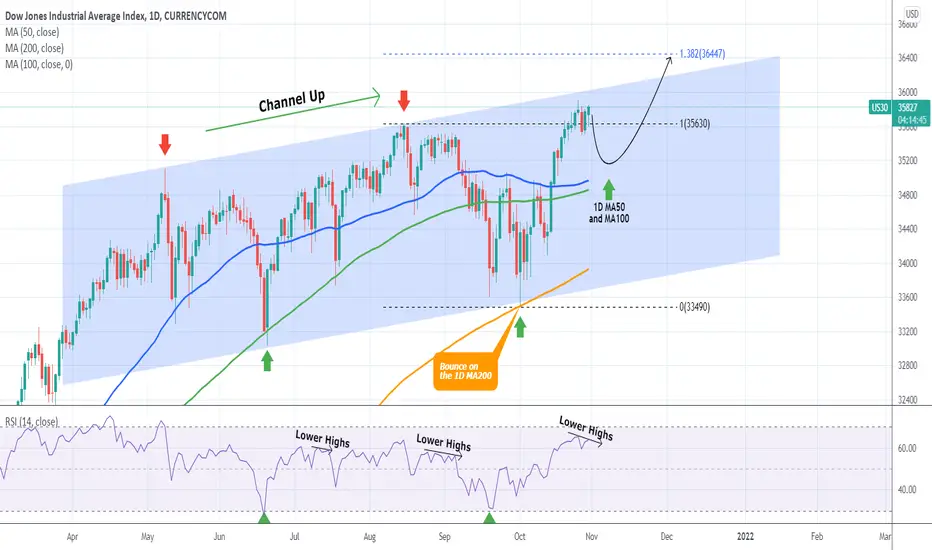
The longer-term one though was last updated on October 1 and this is where I come back to today as well:

As you see, the bounce on the 1D MA200 gave a perfect bottom buy signal and the 35900 target has been achieved. Even though the long-term target is the 1.382 Fibonacci extension (36,450), the price is trading very close to the Channel Up with the 1D RSI on Lower Highs. This RSI formation has been recently seen on tops with the price correcting afterwards to the 1D MA50 (blue trend-line) and the 1D MA100 (green trend-line). On this index, it is best to wait for such contact before targeting the eventual 1.382 Fib extension.
--------------------------------------------------------------------------------------------------------
Please like, subscribe and share your ideas and charts with the community!
--------------------------------------------------------------------------------------------------------
The longer-term one though was last updated on October 1 and this is where I come back to today as well:
As you see, the bounce on the 1D MA200 gave a perfect bottom buy signal and the 35900 target has been achieved. Even though the long-term target is the 1.382 Fibonacci extension (36,450), the price is trading very close to the Channel Up with the 1D RSI on Lower Highs. This RSI formation has been recently seen on tops with the price correcting afterwards to the 1D MA50 (blue trend-line) and the 1D MA100 (green trend-line). On this index, it is best to wait for such contact before targeting the eventual 1.382 Fib extension.
--------------------------------------------------------------------------------------------------------
Please like, subscribe and share your ideas and charts with the community!
--------------------------------------------------------------------------------------------------------
👑Best Signals (Forex/Crypto+70% accuracy) & Account Management (+20% profit/month on 10k accounts)
💰Free Channel t.me/tradingshotglobal
🤵Contact info@tradingshot.com t.me/tradingshot
🔥New service: next X100 crypto GEMS!
💰Free Channel t.me/tradingshotglobal
🤵Contact info@tradingshot.com t.me/tradingshot
🔥New service: next X100 crypto GEMS!
Disclaimer
The information and publications are not meant to be, and do not constitute, financial, investment, trading, or other types of advice or recommendations supplied or endorsed by TradingView. Read more in the Terms of Use.