Long
DOW JONES near the 1D MA200/ first time since October 2020!
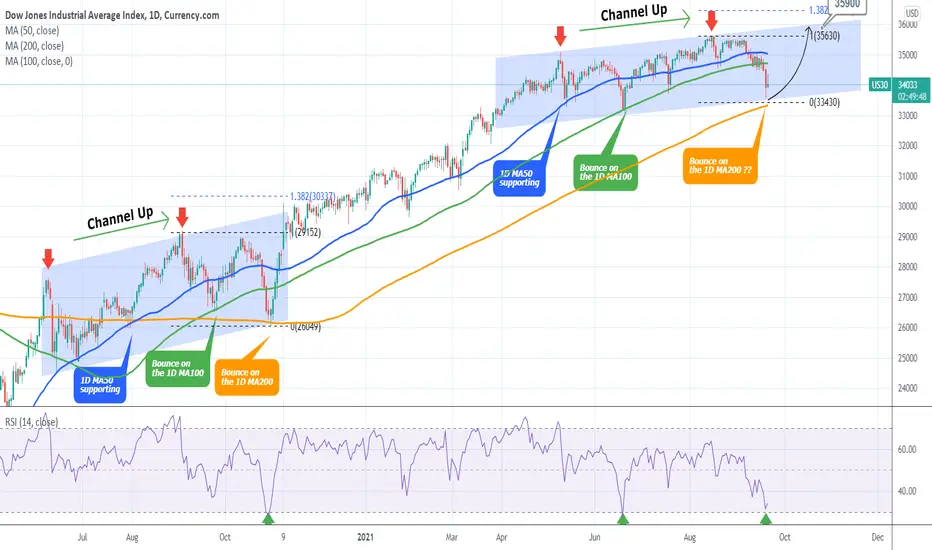
Dow Jones is trading within a Channel Up that has recently broken below the 1D MA100 (green trend-line). This is the first time in two months that is giving the first strong buy signals:
* The RSI is near the 30.000 level which has marked price bottoms on June 18 2021, October 29 2020 (in the post COVID crash era).
* The price is approaching the 1D MA200 (orange trend-line), with the last contact dating back to October 30 2020 (the line held and issued an aggressive rally post US-elections).
* The pattern resembles the June - October 2020 Channel Up. The price hit the 1D MA50 (blue trend-line), 1D MA100 and 1D MA200 in the same order and manner.
Naturally the market is waiting for Fed's confirmation tomorrow before it engages aggressively on high volume but this is the time technically to start considering a buy entry again. Based on the Fibonacci extension model, a target of 35900 seems very plausible.
** Please support this idea with your likes and comments, it is the best way to keep it relevant and support me. **
--------------------------------------------------------------------------------------------------------
!! Donations via TradingView coins also help me a great deal at posting more free trading content and signals here !!
🎉 👍 Shout-out to TradingShot's 💰 top TradingView Coin donor 💰 this week ==> Vergnes
--------------------------------------------------------------------------------------------------------
👑Best Signals (Forex/Crypto+70% accuracy) & Account Management (+20% profit/month on 10k accounts)
💰Free Channel t.me/tradingshotglobal
🤵Contact info@tradingshot.com t.me/tradingshot
🔥New service: next X100 crypto GEMS!
💰Free Channel t.me/tradingshotglobal
🤵Contact info@tradingshot.com t.me/tradingshot
🔥New service: next X100 crypto GEMS!
Disclaimer
The information and publications are not meant to be, and do not constitute, financial, investment, trading, or other types of advice or recommendations supplied or endorsed by TradingView. Read more in the Terms of Use.