Long
DOW JONES Aggressive bullish reversal expected
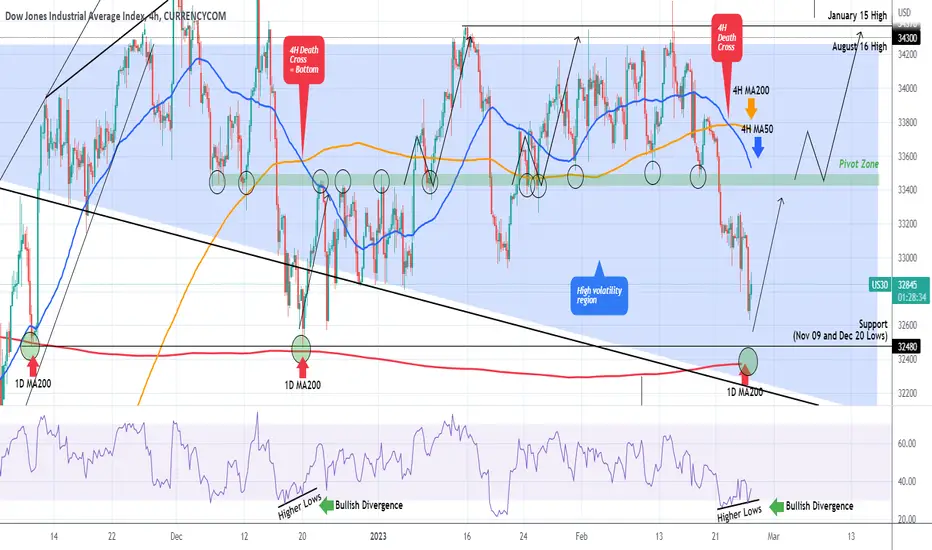
Dow Jones (DJI) broke below its Pivot Zone and Higher Lows trend-line and as per our strategy published 2 weeks ago, we took that break-out sell opportunity:

With the 4H RSI though printing Higher Lows against the price's Lower Lows (i.e. a Bullish Divergence) and the price approaching the 32480 Support level and the 1D MA200 (red trend-line), which both provided Support and started aggressive rebounds on November 09 2022 and December 20 2022, Dow is turning into a medium-term (at least) buy opportunity again.
In fact the very same RSI Bullish Divergence formed the December 20 Low. It is important to add that this Low was formed after a 4H Death Cross, a pattern that we already formed again 2 days ago.
We are buyers again on Dow, targeting the 4H MA50 (blue trend-line). Then we will either wait for a pull-back or buy when the price breaks above the Pivot Zone and re-tests it as Support, in similar fashion as on January 06 2023 and January 23 2023. Long-term target 34300.
-------------------------------------------------------------------------------
** Please LIKE 👍, FOLLOW ✅, SHARE 🙌 and COMMENT ✍ if you enjoy this idea! Also share your ideas and charts in the comments section below! **
-------------------------------------------------------------------------------
💸💸💸💸💸💸
👇 👇 👇 👇 👇 👇
👑Best Signals (Forex/Crypto+70% accuracy) & Account Management (+20% profit/month on 10k accounts)
💰Free Channel t.me/tradingshotglobal
🤵Contact info@tradingshot.com t.me/tradingshot
🔥New service: next X100 crypto GEMS!
💰Free Channel t.me/tradingshotglobal
🤵Contact info@tradingshot.com t.me/tradingshot
🔥New service: next X100 crypto GEMS!
Disclaimer
The information and publications are not meant to be, and do not constitute, financial, investment, trading, or other types of advice or recommendations supplied or endorsed by TradingView. Read more in the Terms of Use.