LiamTrading – GOLD: Risk of ABC Correction Wave, Short-term Sell at 4028
Hello traders,
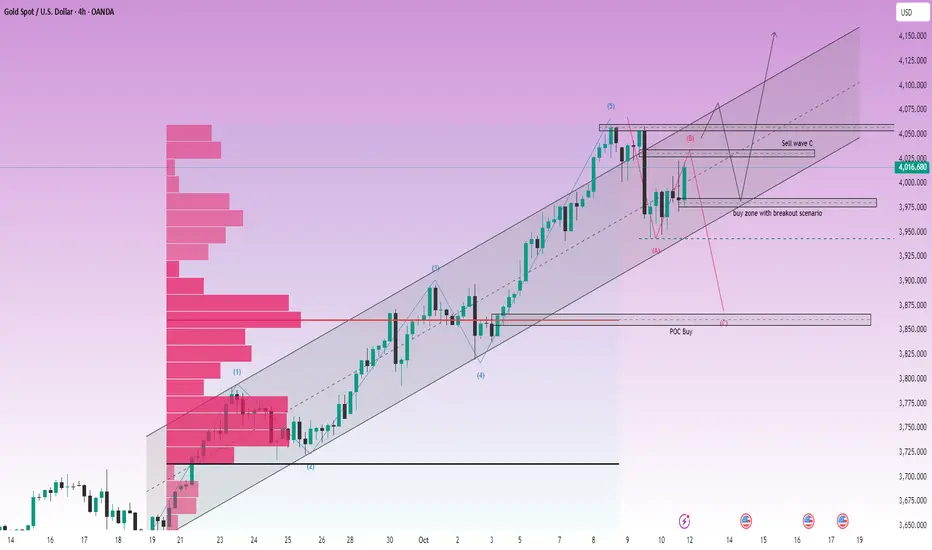
Gold has had an impressive growth week, but as prices hit new highs, the risk of correction always increases. Let's examine this week's Gold scenario based on wave analysis and market liquidity.
📊 Technical Analysis (Chart H4 – XAUUSD)
Based on the H4 chart, Gold (GOLD) seems to have completed the Push Wave 5 (Elliott Wave 5) in the current uptrend cycle, reaching strong resistance around 4050–4060.
Current Structure:
The price is within a sustainable Uptrend Channel.
The 4050–4060 range is a significant resistance where selling pressure may emerge.
An ABC correction wave scenario appears after completing Wave 5.
Key Liquidity Zones:
Potential Resistance Zone (Sell Wave C): Around 4028–4033 (Price area to watch for the reaction of the final Wave C).
Confirmed Drop Support Zone: 3972 (Critical price area confirming if selling pressure is strong enough).
Attractive Buy Zone: 3976 (Temporary liquidity if price corrects, waiting for Breakout confirmation).
Long-term Buy Zone (POC Buy): ~3850 (Price area with a huge Volume Profile, ideal for long-term buy orders).
🎯 New Week Trading Scenario
📉 Short-term Sell
This scenario is based on the expectation of an ABC correction wave starting from the resistance zone.
📍 Entry: 4033
🛑 SL: 4040 (Very tight SL, suitable for short-term Sell strategy at the wave peak)
🎯 TP: 3976 → 3943 → POC (~3850)
📈 Long-term Buy
This setup waits for a correction to lower liquidity zones to enter Buy orders with optimal R:R ratio.
📍 Entry: 3976 (Temporary liquidity buy zone)
🛑 SL: 3970
🎯 TP: 4040 → 4090 → 4150
🛑 Failure Scenario (Wait for Breakout Confirmation)
If the price breaks the 4060 peak and creates a new ATH (All-Time High), the ABC wave scenario will fail.
Action: Continue to prioritize Buying. The best entry is to wait for the price to retest the broken liquidity zone (Breakout Retest) around 3976.
🧭 Fundamental & Long-term Analysis
Macroeconomic Sentiment: The Royal Bank of Canada (RBC) forecasts Gold to rise to $4,500 in the next two years, bolstered by long-term inflation concerns. This confirms the long-term uptrend of Gold remains intact.
US Dollar Impact (USD): The traditional view is that USD rises as investors seek liquidity during market stress. However, Gold's rise alongside USD shows the market prioritizes gold as an inflation hedge rather than just a safe haven.
Long-term Strategy: The buy zone at POC (~3850) according to Volume Profile is extremely suitable. Large liquidity here will help traders enter optimal orders and hold long-term, leveraging the pressure from the Seller's Liquidity to push prices up.
📌 Conclusion
Gold is at a critical crossroads. Although the long-term trend is up, the short-term correction risk (ABC Wave) at the 4028–4033 zone is very high.
Priority: Watch for short-term sells at the resistance zone with a tight SL.
Safe strategy: Wait to Buy at liquidity support zones like 3976 or POC (~3850) to optimize risk/reward (R:R).
I will continue to update Gold scenarios daily with insights from 8 years of trading experience.
👉 Follow me to not miss important updates!
Hello traders,
Gold has had an impressive growth week, but as prices hit new highs, the risk of correction always increases. Let's examine this week's Gold scenario based on wave analysis and market liquidity.
📊 Technical Analysis (Chart H4 – XAUUSD)
Based on the H4 chart, Gold (GOLD) seems to have completed the Push Wave 5 (Elliott Wave 5) in the current uptrend cycle, reaching strong resistance around 4050–4060.
Current Structure:
The price is within a sustainable Uptrend Channel.
The 4050–4060 range is a significant resistance where selling pressure may emerge.
An ABC correction wave scenario appears after completing Wave 5.
Key Liquidity Zones:
Potential Resistance Zone (Sell Wave C): Around 4028–4033 (Price area to watch for the reaction of the final Wave C).
Confirmed Drop Support Zone: 3972 (Critical price area confirming if selling pressure is strong enough).
Attractive Buy Zone: 3976 (Temporary liquidity if price corrects, waiting for Breakout confirmation).
Long-term Buy Zone (POC Buy): ~3850 (Price area with a huge Volume Profile, ideal for long-term buy orders).
🎯 New Week Trading Scenario
📉 Short-term Sell
This scenario is based on the expectation of an ABC correction wave starting from the resistance zone.
📍 Entry: 4033
🛑 SL: 4040 (Very tight SL, suitable for short-term Sell strategy at the wave peak)
🎯 TP: 3976 → 3943 → POC (~3850)
📈 Long-term Buy
This setup waits for a correction to lower liquidity zones to enter Buy orders with optimal R:R ratio.
📍 Entry: 3976 (Temporary liquidity buy zone)
🛑 SL: 3970
🎯 TP: 4040 → 4090 → 4150
🛑 Failure Scenario (Wait for Breakout Confirmation)
If the price breaks the 4060 peak and creates a new ATH (All-Time High), the ABC wave scenario will fail.
Action: Continue to prioritize Buying. The best entry is to wait for the price to retest the broken liquidity zone (Breakout Retest) around 3976.
🧭 Fundamental & Long-term Analysis
Macroeconomic Sentiment: The Royal Bank of Canada (RBC) forecasts Gold to rise to $4,500 in the next two years, bolstered by long-term inflation concerns. This confirms the long-term uptrend of Gold remains intact.
US Dollar Impact (USD): The traditional view is that USD rises as investors seek liquidity during market stress. However, Gold's rise alongside USD shows the market prioritizes gold as an inflation hedge rather than just a safe haven.
Long-term Strategy: The buy zone at POC (~3850) according to Volume Profile is extremely suitable. Large liquidity here will help traders enter optimal orders and hold long-term, leveraging the pressure from the Seller's Liquidity to push prices up.
📌 Conclusion
Gold is at a critical crossroads. Although the long-term trend is up, the short-term correction risk (ABC Wave) at the 4028–4033 zone is very high.
Priority: Watch for short-term sells at the resistance zone with a tight SL.
Safe strategy: Wait to Buy at liquidity support zones like 3976 or POC (~3850) to optimize risk/reward (R:R).
I will continue to update Gold scenarios daily with insights from 8 years of trading experience.
👉 Follow me to not miss important updates!
🔥10–15 daily XAUUSD & Forex signals
📈86% win rate per session
⏱️Real-time alerts with solid technical analysis
💡Consistency comes from the right trading plan
👉 Join my group for full signals & insights in real time t.me/+tU_Yj46vy9QwYzU1
📈86% win rate per session
⏱️Real-time alerts with solid technical analysis
💡Consistency comes from the right trading plan
👉 Join my group for full signals & insights in real time t.me/+tU_Yj46vy9QwYzU1
Related publications
Disclaimer
The information and publications are not meant to be, and do not constitute, financial, investment, trading, or other types of advice or recommendations supplied or endorsed by TradingView. Read more in the Terms of Use.