1️⃣ Trend Line
Descent trend line (above – dashed line)
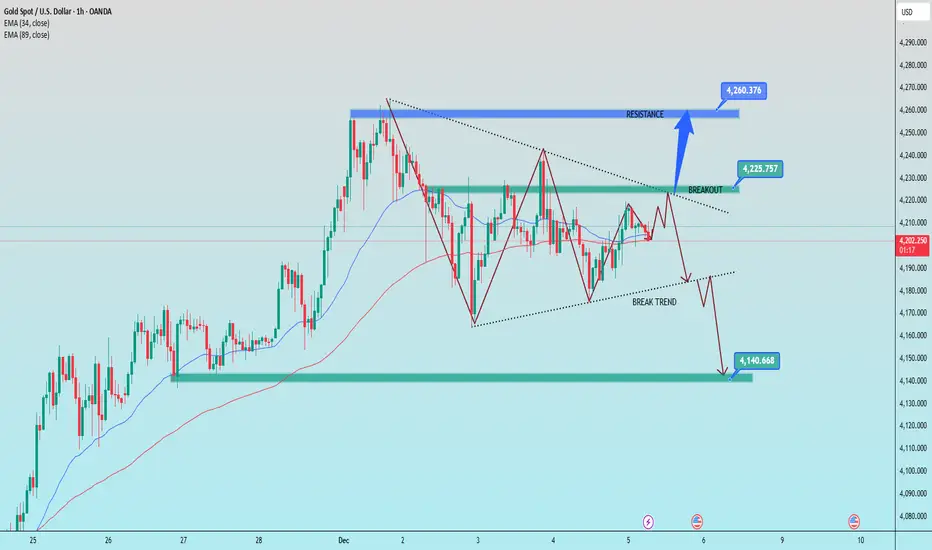
Price has been touched and rejected several times → becomes strong dynamic resistance.
The 4,225–4,230 price zone is a key area:
→ Valid breakout = opens upward momentum towards 4,260.
→ Failed breakout = price returns down following the previous trend.
Ascending trend line (below – dashed line)
This is dynamic support that maintains the short-term upward structure.
If price breaks through this trend line, a downtrend will activate.
2️⃣ Support Area – Key Resistance
4,225 – 4,230:
Confluence of the descending trend line + the previous supply zone → a designated area for buyers.
4,260 – 4,265:
Strongest resistance. When price touches this area, a downward reaction is likely.
Support
4,190 – 4,195:
The first area to be tested if the trend line is broken.
4,140 – 4,135 (lower green zone):
Very strong support – the main target if the downtrend is confirmed.
📌 Trading Signals
BUY GOLD: 4,140 – 4,138
Stop Loss: 4,130
Take Profit: 100 – 300 – 500 pips
SELL GOLD: 4,260 – 4,262
Stop Loss: 4,270
Take Profit: 100 – 300 – 500 pips
Descent trend line (above – dashed line)
Price has been touched and rejected several times → becomes strong dynamic resistance.
The 4,225–4,230 price zone is a key area:
→ Valid breakout = opens upward momentum towards 4,260.
→ Failed breakout = price returns down following the previous trend.
Ascending trend line (below – dashed line)
This is dynamic support that maintains the short-term upward structure.
If price breaks through this trend line, a downtrend will activate.
2️⃣ Support Area – Key Resistance
4,225 – 4,230:
Confluence of the descending trend line + the previous supply zone → a designated area for buyers.
4,260 – 4,265:
Strongest resistance. When price touches this area, a downward reaction is likely.
Support
4,190 – 4,195:
The first area to be tested if the trend line is broken.
4,140 – 4,135 (lower green zone):
Very strong support – the main target if the downtrend is confirmed.
📌 Trading Signals
BUY GOLD: 4,140 – 4,138
Stop Loss: 4,130
Take Profit: 100 – 300 – 500 pips
SELL GOLD: 4,260 – 4,262
Stop Loss: 4,270
Take Profit: 100 – 300 – 500 pips
✅MY FREE FOREX & XAUUSD SIGNALS TELEGRAM CHANNEL:
t.me/+xkPoUfOB8BsyMzRl
🔴9-12 signals per day
🔴Free knowledge support
🔴24/7 support for newbies.
🔴You always have priority.
FXWARRIOR 😘
t.me/+xkPoUfOB8BsyMzRl
🔴9-12 signals per day
🔴Free knowledge support
🔴24/7 support for newbies.
🔴You always have priority.
FXWARRIOR 😘
Related publications
Disclaimer
The information and publications are not meant to be, and do not constitute, financial, investment, trading, or other types of advice or recommendations supplied or endorsed by TradingView. Read more in the Terms of Use.