1. Year-End Liquidity Profile
As we head into the pre-Christmas week, market liquidity will thin: fewer participants will amplify short-term volatility, though long-term allocating capital (central banks/ETFs) will limit deep pullbacks.
2. Key Weekly Chart Levels (Aligned with the Chart)
1. Support Zones:
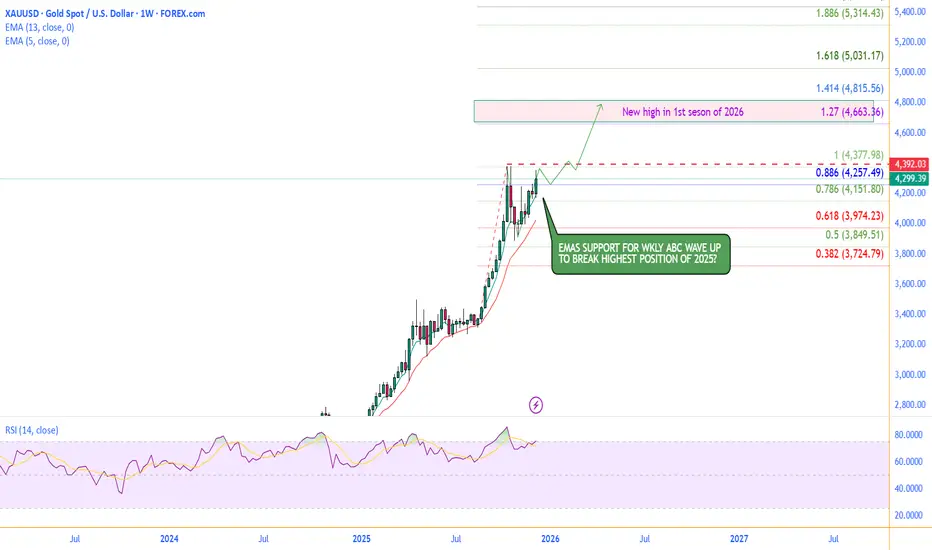
- Near-term support: 4257.49 (0.886 Fib retracement level on the chart);
- Core support: 5-week EMA (4188.80), the anchor for the weekly uptrend.
2. Resistance:
- Next week’s key resistance: 4353.59 (current weekly high).
3. Trading Strategy
1. Bias: The weekly uptrend remains intact (noted as "EMAs support for weekly ABC wave up" on the chart);
2. Execution:
- Go long on dips: Enter lightly during pullbacks to 4257–4299 (0.886 support → current close), leveraging year-end liquidity-driven swings;
- Risk Management: Stop-loss should be adjusted dynamically based on intraday/4-hour price action (core rule: avoid breaking the 0.886 support zone). Reduce position size to 70% of your usual allocation (to mitigate volatility risks from thin liquidity);
- Target: Focus on breaking 4353 (current weekly high) next week; hold for further upside if this level is firmly breached.
4. Conclusion
Next week will see amplified volatility due to year-end liquidity, but the weekly bullish structure holds. Dips to support are buying opportunities, with the core goal of breaking the current weekly high at 4353.
As we head into the pre-Christmas week, market liquidity will thin: fewer participants will amplify short-term volatility, though long-term allocating capital (central banks/ETFs) will limit deep pullbacks.
2. Key Weekly Chart Levels (Aligned with the Chart)
1. Support Zones:
- Near-term support: 4257.49 (0.886 Fib retracement level on the chart);
- Core support: 5-week EMA (4188.80), the anchor for the weekly uptrend.
2. Resistance:
- Next week’s key resistance: 4353.59 (current weekly high).
3. Trading Strategy
1. Bias: The weekly uptrend remains intact (noted as "EMAs support for weekly ABC wave up" on the chart);
2. Execution:
- Go long on dips: Enter lightly during pullbacks to 4257–4299 (0.886 support → current close), leveraging year-end liquidity-driven swings;
- Risk Management: Stop-loss should be adjusted dynamically based on intraday/4-hour price action (core rule: avoid breaking the 0.886 support zone). Reduce position size to 70% of your usual allocation (to mitigate volatility risks from thin liquidity);
- Target: Focus on breaking 4353 (current weekly high) next week; hold for further upside if this level is firmly breached.
4. Conclusion
Next week will see amplified volatility due to year-end liquidity, but the weekly bullish structure holds. Dips to support are buying opportunities, with the core goal of breaking the current weekly high at 4353.
Join Free Telegram Group to get MORE trading skills: t.me/FuntraderVera
Contact:
Tele: @VeraFuntrader
Wechat: ZIYUVERA
Contact:
Tele: @VeraFuntrader
Wechat: ZIYUVERA
Related publications
Disclaimer
The information and publications are not meant to be, and do not constitute, financial, investment, trading, or other types of advice or recommendations supplied or endorsed by TradingView. Read more in the Terms of Use.