Novo Nordisk (Revised) | NVO | Long at $47.78**This is a revised analysis from February 5, 2025: I am still in that position, but added significantly more below $50**
Novo Nordisk NYSE:NVO is now trading at valuations before its release of Wegovy and Ozempic... From a technical analysis perspective, it's within my "major crash" simple moving average zone (gray lines). When a company's stock price enters this region (especially large and healthy companies) I always grab shares - either for a temporary future bounce or a long-term hold. While currently trading near $47 a share, I think worst case scenario here in 2025 is near $38-$39. Tariffs may cause a recession in the second half of 2025, so no company would be immune.
As mentioned above, I am still a holder at $86.74. However, I went in much heavier within my "major crash" simple moving average band and have a final entry planned near $38-$38 (if it drops there). My current cost average is near $55.00.
Why do I still have faith in NYSE:NVO ? Because no one else does right now, yet it generated $42 billion in revenue, $14 billion in profits, and has significant cash flow YoY. The company has a massive pipeline, despite Wegovy and Ozempic competition, and I think the market is undervaluing its position in the pharmaceutical industry.
Revised Targets in 2028:
$60.00 (+25.6%)
$70.00 (+46.5%)
$80.00 (+67.4%)
Moving Averages

Showing You The Final Step Of The 3-Step Rocket Booster StrategyLet me tell you a story first..
i noticed one day that a girl
i really love
had hidden the fact that
she had a son,
before i knew she had a
son i fell in love with her
Later i found out she had a son
then i immediately lost interest.
And then 5 months down the line
she got married to her baby
daddy and now
has 2 more children with him
Now to be fair i dated her
former classmate.
I dont know how she feels about the
relationship i had with her former
classmate.
THis is the relationship that ended
and encouraged me
to study the
3 Step rocket booster strategy
Which is as follows:
#1-The price should be above the 50 ema and the 200 ema
#2-The price should be within the camarilla range of 4H and 4L
#3-The price should gap up or have a stochastic crossover
Now on this chart you are not
able to see the EMA's
because am using the free version of
trading view..
If you would like me to show you
this strategy with the
EMA's,
Camarailla,
and the Stochastic +RSI
all 3 showing you on the screen
feel free to support
me and gift me a monthly subscription
This is the final step that
i have shown you.
Rocket boost this content to learn more.
Disclaimer: Trading is risky please learn
risk managment and profit taking strategies,
Also feel free to use a simulation trading account before you trade with real money.

Agilon Health (Revised) | AGL | Long at $0.76This is a revised analysis of Agilon Health NYSE:AGL as seen here:
-------
Full disclosure: I am a holder of shares at $2.36, $0.76, and $0.79. Last entry planned near $0.50 if it reaches that level. Current cost average is near $1.11.
Let me be clear: This is a ***highly risky*** trade given the recent news regarding the CEO, securities fraud investigation, suspension of FY guidance. Do your own due diligence.
-------
The link above/previous writeup details some of the basic fundamentals of Agilon Health NYSE:AGL . As predicted, the price fell below $1 after the most recent earnings call. This was due to:
Revenue down 6% to $1.4B, Medicare Advantage membership at 498,000.
CEO Steve Sell resigning, Ron Williams appointed Executive Chairman.
2025 guidance suspended due to market challenges.
New securities fraud investigations.
I think the challenges NYSE:AGL is going through will extend through 2025 in into early 2026. If you look at the healthcare sector, it has taken a beating mostly due to Medicare and Medicaid cuts / rising healthcare costs. NYSE:AGL is not profitable and wasn't expected to become profitable until 2028 - but that may get revised....
However, the company focuses on senior patients, primarily through Medicare Advantage and ACO REACH programs, targeting value-based care for older adults across 31+ communities in 12 states. The need for services targeting the Baby Boom population is going to rapidly increase in the next few years. NYSE:AGL may become a leader in this area, but the company needs to regroup and focus on a model that returns money to investors - a dirty game. So, while the near-term is doom and gloom, the future could be very, very bright with NYSE:AGL if they are able to turn things around with this new leadership shakeup. Time will tell. It's a gamble. One I am, personally, willing to take.
Revised Targets into 2028:
$1.60 (+110.5%)
$3.00 (+294.7%)

SHREECEM - Swing Trading Setup (4H)PRICE ACTION ANALYSIS FOR SHREECEM
=> Perfect Lower High and Lower Low formed
=> Price mitigated (Re-tested) in weekly time frame support zone
=> After mitigation, observed that the trend reversal is confirmed by breaking
the previous resistance (LHs)
=> After breakout, retest also happened and the resistance is now become support
=> New Higher high and Higher low formed after breakout
=> Additionally, the price is bouncing between 20EMA and 50EMA
=> Based on the above key factors, I expect that the price is try to reach the
target of 29100 / 29150 (next resistance)
=> Stop loss will be the below support level on closing basis
== EDUCATIONAL PURPOSE ONLY ==

Potential Scenario for DOWWe have been in uptrend, the market needs a more solid formation, in my opinion, it can go down to mark a solid structure and go up again.
I also see a M pattern, it needs to break the neck, potential 100-150 points, if it keeps going with volumen and solid lower candles we may see more profits.
Waiting on the 1HR candle to close with solid volume and structure to have better confirmation.
✅ 1H confirmation
A strong bearish close below your entry line
Preferably below EMA 20 / 50
✅ Structure shift
Break of the last 1H Higher Low
This confirms trend weakening
✅ Momentum alignment
RSI loses 50 and stays below
MACD expands bearish (not flat)
If this does not happen → NO TRADE
Do not risk more than 1% of your account.
Happy Friday Yall!
Comment your thoughts!

SPY (SP500) - ES1! Bullish, holding support line, above SMA 150SPY - (ES Futures) is holding a the support line still, and its above the moving averages, on this chart its the SMA 150.
Bullish outlook for now.

Gold-to-Silver Ratio at 15-Year LowsGold-to-Silver Ratio pulled back sharply after President Trump paused new tariffs on critical minerals. The announcement eased near-term trade risks, leading to profit-taking after record highs above $93/oz. Despite the correction, silver remains up over 25% YTD, supported by robust industrial demand and tight supply.
Policy Context
The U.S. administration’s decision to delay tariffs on critical minerals (including silver, lithium, cobalt, and rare earths) temporarily removes a key policy risk.
Officials are expected to revisit trade agreements within 180 days, potentially introducing price floors instead of blanket tariffs.
This shift reduced short-term volatility — but structural drivers for silver remain unchanged.
Market Fundamentals
Industrial demand remains strong — especially from solar, EV, and electronics sectors.
Mine supply is constrained since silver is mostly a by-product of other metals.
Physical tightness persists after significant stock draws earlier in the year.
The gold/silver ratio near 50 marks the lowest level since 2011, signaling ongoing relative strength.
Overall, the fundamental setup continues to favor long-term accumulation on dips.
Technical Picture
Gold-to-Silver Ratio recently fell below its 200-day moving average, indicating near-term weakness.
Price structure remains bullish above $48–50 — a critical zone of prior support.
The ratio is trending within a descending channel, suggesting silver continues to outperform gold on a relative basis.
Short-term view: Expect range-bound trade between $50–60 as the market stabilizes.
Medium-term view: A sustained breakout above $65 could reopen the path toward previous highs.
Outlook
Volatility will remain elevated as markets digest U.S. trade policy and macro shifts.
However, tight supply, structural deficits, and ongoing industrial demand should cushion downside moves.
The metal’s dual role — part safe haven, part industrial — keeps it sensitive to both policy and growth signals, but the bias remains upward over the longer term.

SMC MA Structure Meets Volume: Timed Pullbacks & MitigationThis is a follow-up to my previous idea
“Samurai Vector Trading: AI-Powered Bias Mitigation System” .
This idea presents a two-layer market structure framework ,
combining moving-average-based structure with volume-based reaction zones .
Rather than producing entry signals, the goal is to
reduce directional bias and clarify where meaningful price interaction is likely to occur .
Layer 1: MA-Based Structure (Timed Pullback & Double Touch)
The first layer focuses on
market structure expressed through moving averages .
20 SMA and 75 SMA define the higher-timeframe directional bias
After their crossover, attention is placed on timed pullbacks
A key condition is a
simultaneous touch of 5 SMA and 20 SMA by the candle (including wicks)
When this condition is met, the candle body is highlighted in white.
These white candles tend to appear:
Not consecutively, but
Clustered horizontally around similar price levels
Over periods of consolidation lasting days rather than minutes
This behavior often reflects structural compression ,
where price repeatedly tests the same mean area while volume accumulates.
Layer 2: Volume-Based Reaction Zones (Conceptual)
The second layer introduces a volume-driven perspective.
Significant volume spikes are observed
From these events, horizontal reaction zones can be inferred
using volatility (ATR) as a reference
These zones are not intended to predict direction .
Instead, they help visualize where the market has shown commitment
and may respond again in the future.
Validation with Public Tools
To keep this framework transparent and reproducible,
it is intentionally aligned with widely available tools:
TradingView’s built-in Volume Profile
Standard Volume indicator
Public scripts such as:
Samurai Volume Spike Detector
Small Body + High Volume candle labeling
Notably, white candle clusters often align with:
Volume Profile POC levels
Prominent “icicle-shaped” volume protrusions
This correspondence frequently reveals a
two-legged mitigation structure ,
where price resolves accumulation in stages rather than a single directional move.
How This Is Intended to Be Used
This is not a trading system .
There are:
No entry rules
No exit rules
No performance claims
Instead, this framework helps answer three structural questions:
Where is price structurally pausing?
Where has volume shown intent?
Are these two perspectives aligned?
Execution can then be handled separately,
using the trader’s own trigger logic and risk management.
Note:
A 200 SMA is shown on the chart as a higher-level structural reference.
It is not part of the current indicator logic and is included for contextual reading only.
Closing Thoughts
Market structure is often discussed abstractly in SMC concepts.
This idea attempts to ground those concepts
using familiar tools: moving averages, volume, and volatility .
By separating structure from execution ,
the chart becomes quieter —
and the decision-making process clearer.
This idea is for educational and analytical purposes only.
It does not provide trading signals or investment advice.

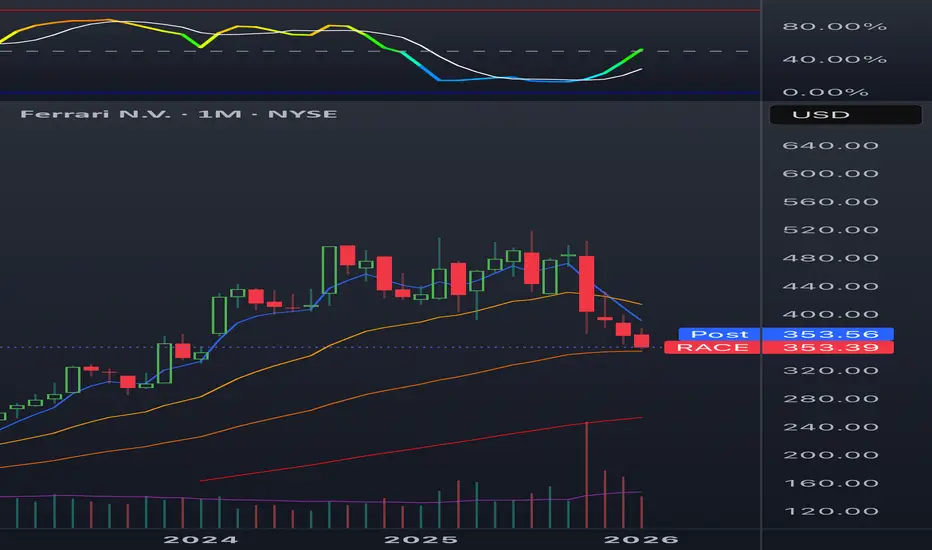
RACE pivot longRace is an amazing market fear and recession stock testing the 55 month ema. We note a macro monthly demand zone in the same region. A 40% upside is apparent. I am net long here
MRNA Swing- bearish to bullish + above SMA 150 + cup and handleMRNA looks like its doing a bearish to bullish setup, it formed a cup and handle and broke a major resistance area, and went above SMA 150 again.
Disclaimer: not a financial advice trade at your own risk

BTCUSDT // The chart shows an inverse head and shoulders pattern, but as long as we stay above the yellow line, the direction is upward. The first target of the formation is the 98,108 level, which corresponds to the 1.414 Fibonacci retracement of the breakout, with the main target being around 103,000. Pay attention to the Kaufman indicator on the weekly timeframe as an intermediate resistance level.

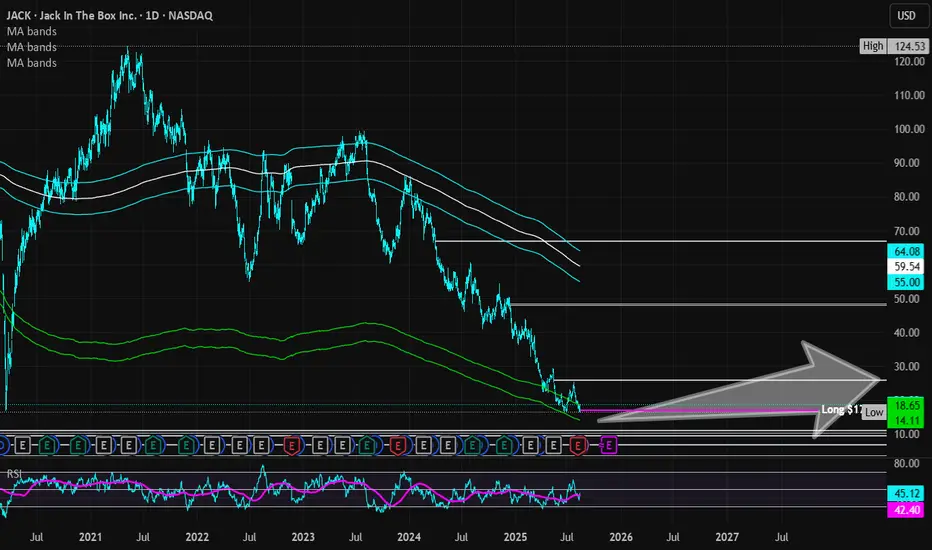
Jack in the Box | JACK | Long at $17.00**This is a reentry after cashing out of the original trade with gains. Basic writeup and technical analysis still apply which was originally written here:
Jack in the Box NASDAQ:JACK reentered my "crash" simple moving average zone. While there is a high chance the price may ride the lines down even further, there is currently a double bottom. A company like NASDAQ:JACK will benefit from interest rate cuts due to its significant debt, but it is a very risky trade. There are better companies out there.
However, with an 18 million float and 27% short interest, this could get very interesting as rates are cut. It's a gamble that hinges highly on company turnaround ("Jack on Track" plan) and the possible sale of Del Taco. Thus, at $17.00, NASDAQ:JACK is in a personal buy zone.
Targets into 2028:
$22.00 (+29.4%)
$26.00 (+53.0%)
#BTCUSDT #12h (Bitget) Descending trendline breakout [LONG]Bitcoin looks ready for short-term recovery after regaining 100EMA support and pulling back to it.
⚡️⚡️ #BTC/USDT ⚡️⚡️
Exchanges: Bitget Futures
Signal Type: Regular (Long)
Leverage: Isolated (8.0X)
Amount: 4.7%
Current Price:
92299.9
Entry Zone:
92024.8 - 90186.8
Take-Profit Targets:
1) 96927.7
2) 101312.3
3) 105696.9
Stop Targets:
1) 86234.0
Published By: @Zblaba
CRYPTOCAP:BTC BITGET:BTCUSDT.P #12h #Bitcoin #PoW bitcoin.org
Risk/Reward= 1:1.2 | 1:2.1 | 1:3.0
Expected Profit= +51.1% | +89.6% | +128.1%
Possible Loss= -42.8%
Estimated Duration= 3-4 weeks

HMY — Gap-Up Swing Trade💰 HMY — Gap-Up Swing Trade
🏢 Company Snapshot
Harmony Gold Mining is a mid-cap gold producer with high leverage to gold price moves.
In play due to gap-up continuation strength within a confirmed multi-month uptrend and sector tailwinds from gold.
📊 Fundamental Context (Trade-Relevant Only)
Valuation: Fair-to-cheap vs senior gold peers; leverage favors momentum extensions.
Balance Sheet: Stable; no immediate balance sheet risk limiting upside.
Cash Flow: Improving alongside higher gold prices.
Dividend: Not trade-relevant.
Fundamental Read: Fundamentals do not cap upside—they support momentum follow-through after gap days.
🪙 Industry & Sector Backdrop
Short-Term (1–4 weeks): Gold miners showing strong relative strength vs SPX.
Medium-Term (1–6 months): Sector outperforming during risk-off rotations.
Macro Influence: Gold bid remains supportive.
Sector Bias: Bullish
📐 Technical Structure (Gap-Up Context)
Trend: Strong uptrend; price well above rising 50-SMA and 200-SMA.
Gap Context: Recent gap-up into prior resistance with no immediate fade, indicating institutional demand.
Momentum: RSI(2) extended — acceptable for gap continuation setups, not mean reversion.
Structure: Post-gap consolidation above prior resistance (gap-and-go potential).
Volume: Elevated on gap day; confirms participation.
Key Levels
Gap Support: 22.00 – 22.40 (gap fill threshold / VWAP area)
Resistance: 25.00 – 26.00 (measured move + round number)
🎯 Trade Plan
Primary Entry:
Buy gap hold above VWAP after first pullback (5–15 min)
OR buy consolidation high break if price holds above opening range
Stop:
Below VWAP or below gap support at 21.90 (clean invalidation)
Target:
First scale: 24.80
Final target: 25.80 – 26.00
Risk-to-Reward: 2.0–2.8R depending on entry execution
Failure Scenario
Loss of VWAP + heavy selling volume = no trade / early exit
Full gap fill invalidates continuation thesis
🧠 Swing Trader’s Bias
Bias is continuation only. I want to see the gap defended above VWAP with tight consolidation before entry. No support hold or aggressive VWAP loss invalidates the setup immediately.

Some rally is expected but…⚠️ Not a financial advice
🔍 Bitcoin Analysis Using the Super Guppy Indicator – Weekly Timeframe
This chart is based on the Super Guppy indicator, which has shown a recurring behavioral pattern across previous Bitcoin market cycles.
In the prior cycle, whenever the Super Guppy shifted from green (bullish) to grey (neutral), Bitcoin typically entered a final bullish rally. This move averaged around 36% upside, followed by the beginning of a bearish market phase.
Structurally and contextually, the market is currently positioned at a very similar zone.
📌 Based on this scenario:
• A potential 2–3 week bullish continuation is possible
• A projected upside target lies in the $110,000 – $114,000 range
• After this rally, the probability of a mid- to long-term bearish phase increases
⚠️ This analysis represents a technical scenario based on historical behavior, not financial advice. Risk management remains essential.

Bark | BARK | Long at $0.84BARK, Inc. NYSE:BARK is a dog-focused company offering subscription-based products like BarkBox and Super Chewer, delivering monthly toys, treats, and pet supplies. It operates in Direct-to-Consumer and Commerce segments, selling through its website, retail partners, and e-commerce platforms. While not overly bullish here, especially given the economic / recession-fear headwinds, I think this is one of those stocks that may have a future "pop" as interest rates are lowered, or news emerges of the company expanding to new retail partners. A few insiders have recently purchased shares (~$75k under $1.00) and others have been awarded options. The book value currently rests near $0.64. It may dip between that price at $0.50 in the near-term. However, that's just been the trajectory of SO many of these SPAC stocks... dip then pop or bust.
Fundamentally, nothing to uproar over and this is a risky investment (Nasdaq delisting may occur). The positive is the debt-to-equity in 0.9x, which is pretty good for a small company. But 2026 is expected to be its worst earnings year. The future may look bright in 2027 and beyond, but can the company last? Time will tell.
Thus, for a swing trade, NYSE:BARK is in a personal buy zone at $0.84 with a risk of further near-term decline between $0.50 and $0.64.
Targets into 2027
$0.95 (+13.1%)
$1.25 (+48.8%)

Is Exxon Going Mobil?Exxon Mobil has been grinding higher since the summer, and now some traders may expect the move to accelerate.
The first pattern on today’s chart is the 2024 high of $126.34. The energy giant crossed that level yesterday and closed slightly above it, which could suggest a breakout is taking place.
Second, the 50-day simple moving average (SMA) had a “golden cross” above the 200-day SMA in August. The 100-day SMA crossed above the 200-day SMA the following month. That alignment, with faster SMAs above slower ones, may suggest that the long-term trend has grown more bullish.
Third, the 8-day exponential moving average (EMA) is above the 21-day EMA. MACD is also rising. Both conditions may signal short-term bullishness.
Fourth, the November 14 weekly close of $119.29 presented resistance in mid-December. But this month the stock pulled back and bounced at the same level. Has old resistance become new support?
Finally, XOM is an active underlier in the options market. (Its average daily volume of 89,000 contracts ranks first among energy stocks in the S&P 500, according to TradeStation data.) That could help traders take positions with calls and puts.
TradeStation has, for decades, advanced the trading industry, providing access to stocks, options and futures. If you're born to trade, we could be for you. See our Overview for more.
Past performance, whether actual or indicated by historical tests of strategies, is no guarantee of future performance or success. There is a possibility that you may sustain a loss equal to or greater than your entire investment regardless of which asset class you trade (equities, options or futures); therefore, you should not invest or risk money that you cannot afford to lose. Online trading is not suitable for all investors. View the document titled Characteristics and Risks of Standardized Options at www.TradeStation.com . Before trading any asset class, customers must read the relevant risk disclosure statements on www.TradeStation.com . System access and trade placement and execution may be delayed or fail due to market volatility and volume, quote delays, system and software errors, Internet traffic, outages and other factors.
Securities and futures trading is offered to self-directed customers by TradeStation Securities, Inc., a broker-dealer registered with the Securities and Exchange Commission and a futures commission merchant licensed with the Commodity Futures Trading Commission). TradeStation Securities is a member of the Financial Industry Regulatory Authority, the National Futures Association, and a number of exchanges.
Options trading is not suitable for all investors. Your TradeStation Securities’ account application to trade options will be considered and approved or disapproved based on all relevant factors, including your trading experience. See www.TradeStation.com . Visit www.TradeStation.com for full details on the costs and fees associated with options.
Margin trading involves risks, and it is important that you fully understand those risks before trading on margin. The Margin Disclosure Statement outlines many of those risks, including that you can lose more funds than you deposit in your margin account; your brokerage firm can force the sale of securities in your account; your brokerage firm can sell your securities without contacting you; and you are not entitled to an extension of time on a margin call. Review the Margin Disclosure Statement at www.TradeStation.com .
TradeStation Securities, Inc. and TradeStation Technologies, Inc. are each wholly owned subsidiaries of TradeStation Group, Inc., both operating, and providing products and services, under the TradeStation brand and trademark. When applying for, or purchasing, accounts, subscriptions, products and services, it is important that you know which company you will be dealing with. Visit www.TradeStation.com for further important information explaining what this means.

S&P 500 | SPX | When should fear really exist for the investor?In recognition of surpassing 500 followers, I thought I would take a moment to write about when I plan to fully exit equities, stockpile cash, and continue to acquire into 20-year treasury bonds (which I have started with TLT ). This post is not encouraging others to do as I do. Instead, it's an attempt to answer a common question I am asked: "When do you think this rally will be over?"
The answer is: "I do not know. But, using technical analysis, I can estimate a personal 'fear' indicator."
My 'Fear' Indicator
I use technical analysis to make informed decisions about entries and exits. It reduces emotional trading, chasing, and FOMO. My technical analysis does not conform to the "standard" 50-, 100-, 200-simple moving averages (SMA). In fact, back testing these standard SMAs show they are (arguably) traps for retail traders. The system wants your money, so why on earth would they share their secrets with such basic numbers as 50, 100, etc.?
Instead, the "devil" is in the details. What I will call my "historical SMA". That's as much as I will share because... well... I want your money too ;)
I view my historical SMA as primary support. It's the white line on the chart. Around that area is a range of values that the price can bounce around in (or slightly out) without causing panic or fear that support has been lost. From the historical SMA, other bands can be extended out to estimate additional support or resistance. If you follow me, you've seen I often trade using a "crash" and "major crash" SMA. These zones often indicate bottom areas for price reversal (i.e. algorithmic trading kicks in and pre-programmed computers quickly accumulate shares). Personally, it's a great indicator by taking out guesswork and letting time work for you instead of against you. It's not perfect, but the odds of success have been extremely high.
So, what's the opposite of my crash or major crash SMA? The "fear" SMA. I call it that because it's when people should ***really*** be fearful of their market exposure (unlike the crash and major crash SMAs which are opportunities). It's currently on the chart as purple lines near 7,600 and 7,800 (and rising). This band is where I am moving out of equities completely and going cash and NASDAQ:TLT . The throttle is maxed and headed for a wall, as they say. Does that mean once price hits that zone the market has topped and it's only down from there? Absolutely not. It may ride that level or jump higher for a few months, year, etc. But it's a fool's game at that point. Time will not be on investor's side. FOMO will be real for those who exit, but this is why technical analysis is important. It uses data for informed decision-making. Not emotions. Profits made from reaching the purple bar will be great. More is just glutinous.
Important Note
Obviously, the conditions above are predicated on no major wars, pandemics, global catastrophes, etc. I view any further dips in the market, not due to said conditions, as opportunities. But, as always, stay cautious, trade using your own strategies, and protect yourself and your money at all times.

TSLA (swingtrading)this is a topic where we can talking about TSLA's next move.
-Looks like TSLA is still respecting its trendline support.
-Should we enter now, or wait for a correction?

SOLANA ANALYSISSOL has successfully breached a critical trendline and reclaimed the 50-day Simple Moving Average (SMA), validating a structural shift in momentum. This confluence of technical breakouts suggests a probability continuation toward the $183 supply zone, provided support levels hold firm.
Disclaimer: This analysis is for educational purposes only and does not constitute financial advice. Trading cryptocurrency involves significant risk; please conduct your own due diligence before making investment decisions.

Organto Foods Inc — Swing Trade Idea (TSXV: OGO)💰 OGO — Swing Trade Idea (TSXV: OGO)
🏢 Organto Foods Inc. operates in organic fruit & vegetable sourcing, processing, packaging and distribution — a consumer staples play with renewed trading liquidity and growth narrative after restructuring. Price is compressing near multi-week demand after a strong cyclical run.
📊 Fundamental Context (Trade-Relevant Only)
• Valuation: No P/E (unprofitable); elevated PS/PB vs peers — suggesting expensive relative to industry sales multiples.
• Balance Sheet: Better liquidity with healthy current/quick ratios; solvency metrics strong, though past debt issues and capital raises remain relocation risk.
• Cash Flow: Historically negative operating cash flow; revenue growth strong but profitability lagging.
• Dividend: None — neutral to trade thesis.
Fundamental Read: Growth narrative and reinstated TSXV listing reduce structural risk but don’t drive near-term catalyst; price action and technical structure must lead.
🪙 Industry & Sector Backdrop
• Short-Term: Consumer staples/food distribution with tight ranges suggests rotation into defensive/mobile stocks; not a strong sector outperformer.
• Medium-Term: TSXV momentum remains elevated, aiding higher-beta names.
• Macro Influence: Stable consumer demand supports staples; no commodity-linked drivers.
Sector Bias: Neutral.
📐 Technical Structure (Primary Driver)
Trend:
• Price trading above long-term support and near upper 52-week compression, but may be below short-term SMAs — trend nuance suggests range bias with bullish structural elements.
Momentum:
• Mixed momentum; varying indicators reflect neutral to reset conditions — compression environment.
Pattern:
• Bull flag / consolidation after strong advance; descending volume into support suggests potential bull continuation if structure holds.
Volume:
• Volume dried into pullbacks — supports accumulation rather than distribution.
Key Levels
• Support: ~0.70–0.72 (structural pivot)
• Resistance: ~0.88–0.95 (recent highs / supply zone)
🎯 Trade Plan (Execution-Focused)
• Entry: 0.72–0.75 — alignment with structural support, prior breakout retest, higher probability pivot zone.
• Stop: 0.66 — below structural demand and flag lower boundary (invalidates pivot).
• Target: 0.88 (near-term) → 0.95 (extended) — measured from base range and prior high supply.
• Risk-to-Reward: ~2.4R – 3.1R (to primary target).
Alternate Scenario:
If price rejects this support and breaks sub-0.70 on heavy volume, treat that as invalidation — avoid scaling until retest of structural low.
🧠 Swing Trader’s Bias
Price remains in a compression above defined support with a flag consolidation that favors continuation higher into recorded highs. Looking for a clean reaction off the entry zone for a controlled swing targeting resistance, with invalidation below key support. Failure below 0.66 quickly invalidates the setup and tightens risk.

USDCAD short term sell USDCAD broke and now is retesting a good S/R zone in which price bounced like 7+ times in the past 6-7 months.
Im selling here from 4H EMA and from this tight little zone formed from previous 4 touches. TP is the bottom of the leg, which gives plenty of room for the price to move

Alight | ALIT | Long at $1.68Alight NYSE:ALIT is a cloud-based human capital technology provider that specializes in helping large organizations manage employee benefits, health, wealth, wellbeing, and related HR functions. It uses AI, data analytics, and personalized insights to improve employee experiences, boost engagement, and drive better outcomes for both employers and workers.
Technical Analysis:
The stock price entered, for the second time, my historical "crash" simple moving average zone. This area (green lines) is often a key location for share accumulation during algorithmic trading. While the lowest band is currently near $1.30 and trending lower (i.e. this is likely not officially bottom), it's a key zone for traders to consider entry for a potential bounce while leaving the emotions and guesswork at the door. But nothing is for certain in the stock market.
Insiders:
Significant buying and no selling through 2025: openinsider.com
Growth:
Modest rise in earnings per share and revenue expected between 2026 and 2028: tradingview.com
Health:
Debt-to-equity: 1x (just okay)
Quick ratio / ability to pay today's bills: 1.2 (just okay)
Altman's Z score / bankruptcy risk: 0.1 (high...)
Fair value: $8.00
Action:
While the price is at risk for heading into the low $1 range, I believe it is currently oversold based on the estimated fair value ($8), insider buying, and technical analysis. It's a risky play based on the financials and changing workforce, but it's a gamble that caught my attention. Thus, at $1.68, NYSE:ALIT is in a personal buy zone /starter position with potential for further declines near $1 - $1.30 in the near-term. Time will tell.
Targets into 2029
$2.00 (+19.0%)
$3.00 (+78.6%)
