AI Stocks Weakness Could Spoil this Year’s Santa RallyAs December begins, traders worldwide are dusting off the same old question: Will we get a Santa Claus rally this year?
But 2025’s setup looks a little different. The market’s cheer seems to depend heavily on whether AI-related stocks can keep delivering miracles—and lately, the charts are suggesting they may be running out of steam.
When Tech Sneezes, the Market Catches a Cold
A quick look across U.S. equity futures shows a revealing pattern.
The E-mini NASDAQ 100 Futures (NQ), home to most AI and semiconductor giants, has posted a significantly lower monthly low compared to the prior month.
Meanwhile, the E-mini S&P 500 Futures (ES) declined much less, hinting at relative resilience, but also possible lagging weakness.
This divergence—NQ leading down while ES holds up—is a subtle warning. When the market’s growth engine (tech) loses traction, broader indices often follow with a delay. That’s the tension December traders are staring at: are we seeing the early signs of exhaustion before the holidays, or just a healthy pause?
Bearish Divergences Whisper “Caution”
The technicals are backing that cautious tone.
On the ES chart, the Commodity Channel Index (CCI) has been carving lower highs even as prices printed higher highs. This is a textbook bearish divergence, often an early sign that bullish momentum is fading.
The MACD histogram echoes the same message: momentum has been contracting through November despite new price highs, suggesting that underlying strength is eroding. Such divergences don’t predict direction on their own, but they do raise the probability of a short-term correction—or at least a choppy path into year-end.
The Price Map: Three Levels that Could Define December
Let’s outline the key technical zones traders are watching:
6,525.00: the prior monthly low—this is the first line of defense for the Santa Rally narrative. A break below this level would likely shift sentiment fast, especially if NQ continues under pressure.
6,239.50: the floor of a relevant UFO (UnFilled Orders) support zone. If ES dips below the prior low, this zone may become a “bear trap.” Many traders might short aggressively once 6,525.00 gives way, but those unfilled buy orders could absorb supply and trigger a sharp bounce. If the rally emerges from here, Santa might still make his visit.
4,430.50: a deeper UFO support cluster roughly 35% below current prices. If price were to cut through 6,239.50 and stay below it, the market would be entering a different regime altogether—likely accompanied by broken trendlines, volatility spikes, and a more defensive tone.
Reading Between the Lines: What the Divergence Means
Historically, the Santa Rally is powered by optimism, lighter volumes, and portfolio rebalancing. But this time, AI and semiconductor names—the champions of the current bull leg—are leading weakness.
That doesn’t mean doom; it means fragility.
The ES market may still rebound, but it’s doing so under reduced participation from the very sectors that drove prior gains.
Sizing the Trade Without Crossing the Line
For traders eyeing this setup through ES (E-mini S&P 500 futures) or MES (Micro E-mini S&P 500) futures, here’s a compliant, educational way to think about risk and position sizing:
Identify the Setup Zone: e.g., around 6,525.00 as potential demand, or below 6,239.50 as short-term breakdown.
Define Your Stop: the level where the technical picture is invalidated.
Set a Dollar Risk Limit: for instance, risking 1% of total account equity.
Derive Position Size: Divide your dollar risk by the price distance between entry and stop (converted into points). Then choose between the standard E-mini (ES) or Micro E-mini (MES) to match your risk tolerance and account size.
This framework lets traders adapt leverage responsibly—without needing the specific contract specs or margin figures, which vary by broker and time.
Risk Management: December Can Be a Trap
December is famous for emotional trading. The combination of holiday expectations, thinner liquidity, and year-end positioning can turn routine pullbacks into exaggerated moves.
That’s why focusing on risk before reward is critical.
The UFO support levels serve as reference zones where institutional activity might reappear, but they’re not guarantees. Managing stops, scaling out partial profits, and staying flexible matters more than trying to guess the market’s next headline.
ES and MES: Same Story, Different Scale
The Micro E-mini (MES) contract is a smaller version of the E-mini (ES), designed for traders who want the same price exposure but with lower notional size.
Both track the same index, tick for tick.
For traders exploring this December setup, the MES allows participation while controlling exposure more granularly—especially useful if volatility picks up and margin requirements shift.
Key Contracts Specs and Margins:
E-mini S&P 500 Futures (ES) with a point value = $50 per point.
Micro E-mini S&P 500 Futures (MES) with a point value = $5 per point.
As of the current date, the margin requirements for E-mini S&P 500 Futures and for the Micro E-mini S&P 500 Futures are approximately $22,400 and $2,240 per contract respectively.
Always verify the latest margin schedules and specifications directly with your broker or the exchange before entering trades, as those details update regularly and depend on market conditions.
Santa’s Setup: Scenarios to Watch
Scenario A — Santa Delivers: Price tests or slightly breaks the 6,525.00 low, finds support near 6,239.5, and rebounds into late December. Bearish divergences resolve sideways, and risk assets stabilize.
Scenario B — The Grinch Arrives: The 6,239.50 zone fails to hold, breaking trendline supports. The market slides toward 4,430.50, shaking off complacent longs and erasing part of the 2024-5 rally.
Both paths are technically valid. The difference will come from whether AI-heavy sectors regain strength—or confirm that this bull leg has indeed lost its engine.
Educational Takeaway
Divergences (CCI and MACD) highlight when momentum and price disagree—a sign of fatigue.
Intermarket analysis (ES vs. NQ) reveals where weakness may originate.
UFO levels identify potential institutional footprints—where traps or reversals often occur.
Discipline and risk control matter more than predicting whether Santa shows up.
Final Thought
Whether December brings gifts or grief may depend less on seasonal hope and more on how traders interpret these divergences.
If AI stocks can find footing again, the rally could revive. But if they keep sliding, this might be the year Santa takes a break.
When charting futures, the data provided could be delayed. Traders working with the ticker symbols discussed in this idea may prefer to use CME Group real-time data plan on TradingView: www.tradingview.com - This consideration is particularly important for shorter-term traders, whereas it may be less critical for those focused on longer-term trading strategies.
General Disclaimer:
The trade ideas presented herein are solely for illustrative purposes forming a part of a case study intended to demonstrate key principles in risk management within the context of the specific market scenarios discussed. These ideas are not to be interpreted as investment recommendations or financial advice. They do not endorse or promote any specific trading strategies, financial products, or services. The information provided is based on data believed to be reliable; however, its accuracy or completeness cannot be guaranteed. Trading in financial markets involves risks, including the potential loss of principal. Each individual should conduct their own research and consult with professional financial advisors before making any investment decisions. The author or publisher of this content bears no responsibility for any actions taken based on the information provided or for any resultant financial or other losses.
Bearish Patterns

RSI Bearish DivergenceAs we can see, there is a hidden RSI Divergence.
A HIDDEN RSI Divergence occur when we see lower highs for the price, and higher highs for the RSI.
The reason it is considered hidden is because the indicator refers to a momentum continuation, while the price is actually achieving lower highs.
This is confirmed by the last bearish candle we see.
...Please note, this is a 2 Hours Chart...
If the price breaks above and RSI continued to make higher higher along with the price, it might not divert.
On another note:
-We can notice a STRONG RSI Divergence, starting from the last candle in 30 October.
The reason it is strong is because the we see a strong price hike, and the momentum is decreased.

The Double Bottom Trap That Traders Might Miss1. The Comfort Zone of Classic Patterns
Few formations attract traders’ attention like a double bottom. It’s one of those timeless chart patterns that promise hope after a long decline—a visual story of selling exhaustion followed by a bullish reversal.
But markets rarely reward what’s obvious. In futures trading, especially when examining instruments like Bitcoin Futures (BTC) and Micro Bitcoin Futures (MBT), patterns are only half the story. What truly moves price isn’t just the shape on the chart—it’s the order flow behind it.
That’s where understanding FO (Filled Orders) and UFO (UnFilled Orders) becomes essential. Both represent past and potential liquidity imbalances, and reading their relationship can transform how traders interpret “classic” setups.
2. The Bitcoin Setup: A Tale of Two Bottoms
The current BTC daily chart paints what seems like a textbook double bottom. Two price troughs form near the same horizontal area around $104,000, setting up the typical “W” shape many traders see as a bullish reversal pattern.
However, when we dig deeper into the order flow structure, the illusion begins to fade.
A FO Support level exists near $103,860, meaning that this area previously attracted enough buyers to halt a decline—but those orders have already been filled and we know this given the fact that price turned at that price level before.
The next UFO Support zone sits much lower, around $95,640. That’s where unfilled buy orders are expected to remain waiting, untouched.
This distinction matters. While FO zones mark previous turning points, UFO zones highlight potential turning points that still contain resting liquidity. In simple terms, FO areas represent “used energy,” while UFO areas represent “stored energy.”
3. FO vs. UFO – The Order Flow Reality Check
Let’s define these two concepts with precision:
FO (Filled Orders): Price zones where significant buying or selling already occurred. These levels once reversed price, but because those orders were executed, fewer remain to defend the level again.
UFO (UnFilled Orders): Price zones containing pending buy or sell orders not yet triggered. They represent areas of fresh imbalance and therefore carry a higher probability of influencing future price moves.
In our Bitcoin case, the FO Support around $103,860 has done its job already—it stopped price before. But now, the unfilled buying interest lies lower, implying that the market may need to travel down to reach fresh demand at $95,640.
On the other side, UFO Resistance hovers near $112,410, enveloping the top of the double bottom structure. Should the price rebound toward that level, sellers waiting there could re-enter the scene, potentially capping any bullish recovery.
The conclusion? This pattern isn’t as bullish as it looks.
4. When Bullish Shapes Hide Bearish Probabilities
Most traders spot the double bottom and immediately think “trend reversal.” Yet, the distance between FO and UFO levels tells a more subtle story.
Since FO Support levels carry reduced strength after being tested, they’re more likely to break than hold. In this context, the probability favors a downside continuation rather than an immediate bounce.
If price breaches $103,860, the next probable destination becomes the UFO Support at $95,640. Only then, after reaching that pocket of unfilled demand, might a significant rebound have higher odds.
It’s a reminder that technical patterns, while valuable, must always be filtered through liquidity context. A pattern without order flow validation is like reading the market’s outline without its story.
5. Quantitative Insight: A Probabilistic Lens
Think of this in probabilistic terms:
When FO zones sit above UFO zones, the market often continues toward the unfilled liquidity.
When UFO zones lie closer to current price, reversals occur faster because demand (or supply) is still waiting to be executed.
In our example, BTC shows a larger gap between FO and UFO support levels, signaling lower immediate reversal odds. The chart may appear bullish, but the underlying order flow distribution points to weakness first, strength later.
This is not a prediction—it’s an observation of potential. It allows traders to structure their expectations based on where fresh participation is more likely to emerge.
6. Risk Management: Navigating the Trap
For traders considering setups around this structure, risk management is crucial.
Entry awareness: Avoid entering long positions purely because a double bottom “looks bullish.” Consider waiting for evidence of unfilled demand being triggered (confirmation at or near UFO Support).
Stop-loss placement: Stops below FO Support can easily be hunted in liquidity sweeps; better to align risk control with genuine unfilled demand areas.
Reward-to-risk thinking: A test of the UFO Support near $95,640 could later offer a more favorable upside-to-downside ratio than buying prematurely at $104,000.
Remember, pattern-based entries without liquidity confirmation often carry poor asymmetry—small upside with large downside risk.
7. Futures Structure and Margin Awareness
Both BTC and MBT represent Bitcoin exposure via futures contracts, but their sizing differs dramatically.
BTC equals 5 Bitcoin per contract, making it suitable for larger, institutional players. (1 Tick = 5 = $25. Required Margin = $132,500)
MBT, the Micro Bitcoin Futures, equals 0.1 Bitcoin per contract, offering flexibility for smaller accounts and finer position scaling. (1 Tick = 5 = $0.50. Required Margin = $2,600)
Understanding margin requirements is essential—these products are leveraged instruments, and small price changes can result in large percentage gains or losses.
8. Key Takeaway: The Hidden Lesson
This entire setup illustrates a powerful educational point:
Chart patterns may draw the eye, but order flow tells the truth.
The double bottom may invite buyers, but the imbalance between FO and UFO zones exposes an underlying weakness. Traders who rely solely on visual patterns may walk straight into a trap. Those who align patterns with liquidity insights, however, read the market at a deeper level.
In the current context, BTC and MBT might need to visit lower support levels before finding true stability. Watching how price behaves around these unfilled order zones will reveal whether this double bottom turns into a lasting floor—or just another false start.
When charting futures, the data provided could be delayed. Traders working with the ticker symbols discussed in this idea may prefer to use CME Group real-time data plan on TradingView: www.tradingview.com - This consideration is particularly important for shorter-term traders, whereas it may be less critical for those focused on longer-term trading strategies.
General Disclaimer:
The trade ideas presented herein are solely for illustrative purposes forming a part of a case study intended to demonstrate key principles in risk management within the context of the specific market scenarios discussed. These ideas are not to be interpreted as investment recommendations or financial advice. They do not endorse or promote any specific trading strategies, financial products, or services. The information provided is based on data believed to be reliable; however, its accuracy or completeness cannot be guaranteed. Trading in financial markets involves risks, including the potential loss of principal. Each individual should conduct their own research and consult with professional financial advisors before making any investment decisions. The author or publisher of this content bears no responsibility for any actions taken based on the information provided or for any resultant financial or other losses.

When Generals Run and Soldiers Nap — The Market’s Odd ParadeEver seen an army march where the generals sprint ahead, but the soldiers just yawn and stay behind?
That’s exactly what’s happening in the U.S. futures battlefield right now.
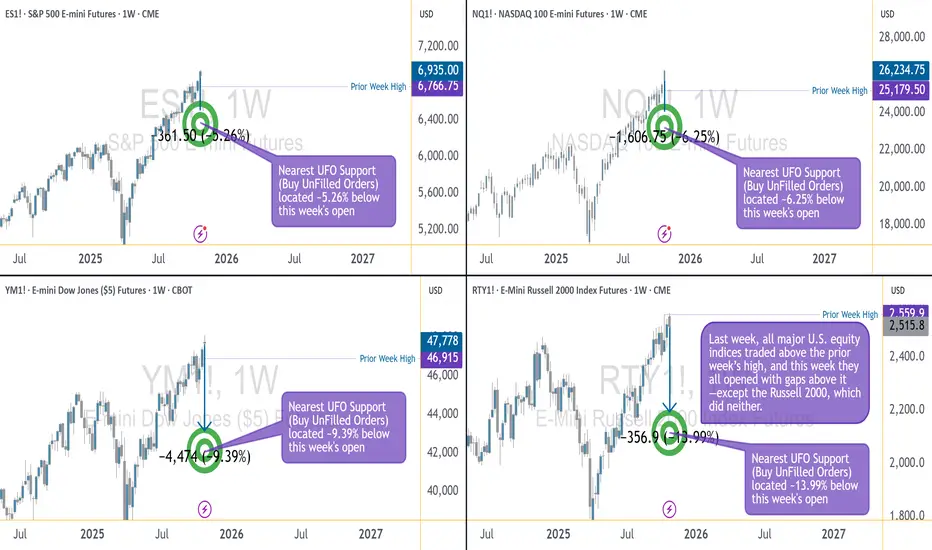
The ES, NQ, and YM — our large-cap “generals” — opened the week above their prior highs, looking ready for victory speeches. But the RTY, representing small caps, is still lagging like it hit the snooze button.
The Breadth Problem
Healthy rallies need everyone on board. When small caps don’t join the charge, it’s like running a marathon with only one leg — you might move forward, but not for long.
That’s why this gap between the big guys and the small ones is called bearish divergence — momentum without muscle.
How Deep Could It Go?
Under the surface, liquidity pockets (UFO supports) show the “landing zones” below price:
ES: ~5% lower
NQ: ~6% lower
YM: ~9% lower
RTY: ~14% lower (!)
Translation: if the market trips, the generals may bruise a knee — but the soldiers could roll down the hill.
Tick, Margin, and Scale
CME index futures come in two flavors — E-minis for the pros, Micro E-minis for precision control:
S&P 500 (ES/MES): tick 0.25 → $12.50 / $1.25; margin ≈ $21K / $2.1K
Nasdaq 100 (NQ/MNQ): tick 0.25 → $5 / $0.50; margin ≈ $30K / $3K
Dow Jones (YM/MYM): tick 1 → $5 / $0.50; margin ≈ $13K / $1.3K
Russell 2000 (RTY/M2K): tick 0.10 → $5 / $0.50; margin ≈ $9K / $0.9K
(Approximate numbers, educational only.)
The Lesson
Breadth divergences don’t “predict” the end of the rally — they just whisper: “Careful, this parade’s out of sync.”
So before chasing the next breakout, remember:
even the best generals can’t win a war if their soldiers stay in camp.
Want More Depth?
If you’d like to go deeper into the building blocks of trading, check out our From Mystery to Mastery trilogy, three cornerstone articles that complement this one:
🔗 From Mystery to Mastery: Trading Essentials
🔗 From Mystery to Mastery: Futures Explained
🔗 From Mystery to Mastery: Options Explained
When charting futures, the data provided could be delayed. Traders working with the ticker symbols discussed in this idea may prefer to use CME Group real-time data plan on TradingView: www.tradingview.com - This consideration is particularly important for shorter-term traders, whereas it may be less critical for those focused on longer-term trading strategies.
General Disclaimer:
The trade ideas presented herein are solely for illustrative purposes forming a part of a case study intended to demonstrate key principles in risk management within the context of the specific market scenarios discussed. These ideas are not to be interpreted as investment recommendations or financial advice. They do not endorse or promote any specific trading strategies, financial products, or services. The information provided is based on data believed to be reliable; however, its accuracy or completeness cannot be guaranteed. Trading in financial markets involves risks, including the potential loss of principal. Each individual should conduct their own research and consult with professional financial advisors before making any investment decisions. The author or publisher of this content bears no responsibility for any actions taken based on the information provided or for any resultant financial or other losses.
Generals Charge, Soldiers Stall: Reading Bearish Divergence1. Context: The Battle Line Between Large and Small Caps
This week’s futures landscape paints a striking contrast between leadership and hesitation. In the CME equity index universe, the large caps — ES (E-mini S&P 500), NQ (E-mini NASDAQ 100), and YM (E-mini Dow Jones) — advanced as a united front, all opening above their prior week’s highs. The market generals were charging confidently uphill.
Yet, on the same battlefield, the RTY (E-mini Russell 2000) lagged behind. The small caps failed to take out the prior week’s high and opened below the aggressive gaps that marked their larger counterparts. In trader terms, breadth was narrowing. In storyteller terms, the generals were calling “forward!” — but the soldiers weren’t following.
Such divergences in participation often mark transition zones in market psychology. When large caps push while small caps stall, it doesn’t necessarily mean the campaign is lost — but it does mean confidence among the broader troops is weakening.
2. Reading the Divergence: When Breadth Narrows
The relationship between large-cap and small-cap indices often reveals more than just price action — it exposes the structure of conviction. In sustained bullish environments, small caps tend to lead or at least confirm the move. Their participation signals that risk appetite is healthy across the field, not confined to the biggest names.
When that breadth fades, the advance becomes fragile. A rally driven only by mega-cap components (the generals) can stretch further, but with decreasing participation, it becomes increasingly vulnerable to shocks. Traders who watch intermarket behavior know this phenomenon as bearish divergence — higher highs in the generals, lower or flat highs in the soldiers.
From a practical standpoint, narrowing breadth implies that fewer sectors are carrying the index higher. In other words, the market’s engine is running on fewer cylinders. This is not a timing trigger on its own, but it is a powerful contextual clue suggesting that volatility could expand when the leadership stumbles.
3. Quantifying the Risk: Supports and Market Depth
Looking beneath price, Order Flow (UnFilled Orders) provides a sense of where liquidity may reside once the current rally pauses. Key UFO support zones, acting as potential demand clusters, reveal how far the market might travel before encountering fresh buy interest.
From this week’s open:
ES shows its next support roughly 5.26% below current levels.
NQ sits around 6.25% below.
YM’s cushion lies approximately 9.39% beneath.
RTY, however, faces a much deeper air pocket — the next notable UFO support sits nearly 13.99% lower.
This asymmetry is critical. If markets retreat, small caps have the most unprotected downside terrain before reaching meaningful support. In other words, the generals may fall back a few miles, but the soldiers could tumble down the hill.
These percentages don’t guarantee a move — they outline the potential amplitude of correction if risk-off flows accelerate. The deeper the distance to support, the larger the volatility zone beneath.
4. Strategic View: Large Caps Lead, but Are They Overextended?
The current setup puts traders in a classic tactical dilemma:
Are the generals inspiring a new advance, or are they overextended and exposed?
Two plausible scenarios emerge:
Continuation scenario: If the small caps (RTY) regain strength and take out their prior week’s high, the breadth gap could close. This would validate the generals’ move and reestablish a broad-based advance.
Correction scenario: If RTY continues to stall while ES, NQ, and YM fail to sustain their gaps, it would confirm a divergence-led weakening. A close back below prior week’s highs could trigger a retreat toward the support zones identified earlier.
The idea is not to predict a reversal, but to prepare a framework in case weakness unfolds.
5. Contract Overview: E-mini and Micro Versions
To analyze or engage these markets, traders can study both E-mini and Micro E-mini contracts listed on the CME. These contracts represent standardized ways to participate in U.S. equity index movements, but at different notional sizes.
E-mini contracts (ES, NQ, YM, RTY) are the long-standing institutional benchmark instruments that track major U.S. equity indices with efficient liquidity and tight spreads.
Micro E-mini contracts (MES, MNQ, MYM, M2K) provide the same exposure pattern at one-tenth the size, offering more granularity in risk management and flexibility for smaller accounts or precise hedging.
It’s important to understand that these futures allow directional and hedging applications without requiring ownership of the underlying equities. However, as with any leveraged product, margin requirements can amplify both gains and losses. Traders should familiarize themselves with margin-to-equity ratios and maintenance requirements before participation.
S&P 500 – ES / MES
Minimum tick: 0.25 points
Tick value: $12.50 (E-mini) | $1.25 (Micro)
Typical margin: ≈ $21K (E-mini) | ≈ $2.1K (Micro)
NASDAQ 100 – NQ / MNQ
Minimum tick: 0.25 points
Tick value: $5.00 (E-mini) | $0.50 (Micro)
Typical margin: ≈ $30K (E-mini) | ≈ $3.0K (Micro)
Dow Jones – YM / MYM
Minimum tick: 1 point
Tick value: $5.00 (E-mini) | $0.50 (Micro)
Typical margin: ≈ $13K (E-mini) | ≈ $1.3K (Micro)
Russell 2000 – RTY / M2K
Minimum tick: 0.10 points
Tick value: $5.00 (E-mini) | $0.50 (Micro)
Typical margin: ≈ $9K (E-mini) | ≈ $0.9K (Micro)
Please note that all margin requirements are approximate and may be adjusted.
6. Risk Management Spotlight
Breadth divergences can test patience and positioning discipline. Managing exposure becomes as important as analyzing the signal itself.
Here are three core reminders:
Position Sizing: Adjust to volatility. If the distance to the nearest support is wide, scale down accordingly to maintain a consistent risk percentage per trade.
Stop-Loss Discipline: Predetermine exit points based on technical invalidation, not emotion.
Capital Preservation: Capital is ammunition; running out of it limits participation when true opportunity returns.
In the end, risk management isn’t about avoiding loss; it’s about surviving long enough to thrive when clarity returns. When markets are divided between generals and soldiers, maintaining balance becomes a trader’s greatest edge.
7. Educational Takeaway
The “generals vs. soldiers” analogy reminds us that market structure is not just about price—it’s about participation. When large caps surge but small caps lag, it signals a potential exhaustion point in the broader advance. The healthiest rallies are those in which all troops move in sync.
For traders and investors, breadth divergences serve as an early-warning system, not a countdown clock. They encourage a review of exposure, tighter stop placement, and a shift toward risk-awareness rather than return-chasing.
At this stage, the technical setup across U.S. index futures reads like a fragile truce: ES, NQ, and YM maintain their gains above prior-week highs, while RTY still lingers below. Should the soldiers eventually follow, confidence could rebuild. But if the generals start retreating first, the path toward their UFO supports could unfold quickly.
The core takeaway: breadth divergences don’t predict timing—they illuminate imbalance. Recognizing that imbalance early allows traders to respond intelligently instead of react emotionally when volatility expands.
When charting futures, the data provided could be delayed. Traders working with the ticker symbols discussed in this idea may prefer to use CME Group real-time data plan on TradingView: www.tradingview.com - This consideration is particularly important for shorter-term traders, whereas it may be less critical for those focused on longer-term trading strategies.
General Disclaimer:
The trade ideas presented herein are solely for illustrative purposes forming a part of a case study intended to demonstrate key principles in risk management within the context of the specific market scenarios discussed. These ideas are not to be interpreted as investment recommendations or financial advice. They do not endorse or promote any specific trading strategies, financial products, or services. The information provided is based on data believed to be reliable; however, its accuracy or completeness cannot be guaranteed. Trading in financial markets involves risks, including the potential loss of principal. Each individual should conduct their own research and consult with professional financial advisors before making any investment decisions. The author or publisher of this content bears no responsibility for any actions taken based on the information provided or for any resultant financial or other losses.

$CHILLGUY How to Spot Euphoria LessonHere's a good lesson on spotting EUPHORIA.
I was over a friend's house who is a retail crypto trader on Thanksgiving.
He was telling that I had to buy $CHILLGUY because its the biggest meme ever.
I didn't even bother looking at the chart because of my past experience knowing how to gauge market sentiment,
but I replied, "you telling me this should be an instant sell signal for you".
From that day on, it was DOWN-ONLY 80% for the next 1.5 months 🤓

Catch Big Reversals Like a Pro Using the GOLDEN RSIHow to Catch Market Tops and Bottoms Using the GOLDEN RSI Indicator
Trading market reversals can feel like a daunting task. But what if you had a secret weapon to help you identify tops, bottoms, and potential reversals with ease? Enter the GOLDEN RSI Indicator—a custom-built tool designed to revolutionize your trading strategy. In this tutorial, I’ll show you how to leverage this powerful indicator to spot reversal trades like a seasoned pro.
What is the GOLDEN RSI Indicator?
The GOLDEN RSI builds on the traditional RSI (Relative Strength Index) by adding optimized zones and visual signals that highlight potential bullish and bearish reversals. Unlike the standard RSI, which requires subjective interpretation, this indicator provides precise entry and exit signals by visually marking key market conditions.
How to Use the GOLDEN RSI to Catch Market Reversals?
Understand the Key Zones:
Overbought Zone (Above 80): Signals a potential market top or reversal from bullish to bearish.
Oversold Zone (Below 20): Indicates a potential market bottom or reversal from bearish to bullish.
Neutral Zone (60-40): Consolidation phase where trends are less decisive.
Spotting Bullish Reversals
When the RSI dips into the oversold zone (below 20) and begins to reverse upward, the GOLDEN RSI will highlight a Bull signal. This suggests a potential upward move, ideal for long trades.
Pro Tip: Look for confirmation with price action, such as a bullish candlestick pattern or a break of resistance.
Spotting Bearish Reversals
When the RSI climbs into the overbought zone (above 80) and starts to turn down, the GOLDEN RSI will mark a Bear signal. This indicates a potential downward move, perfect for short trades.
Pro Tip: Combine with chart patterns like double tops or bearish engulfing candles to strengthen your confidence in the trade.
The Hidden Power of Divergences
Bullish Divergence: Price makes lower lows while the RSI makes higher lows. This signals potential bullish momentum.
Bearish Divergence: Price makes higher highs while the RSI makes lower highs. This signals potential bearish momentum.
The GOLDEN RSI visualizes divergences clearly, so you can spot them effortlessly.
Use Risk Management Tools
Set stop-loss levels below recent swing lows (for bullish trades) or above recent swing highs (for bearish trades).
Use risk-reward ratios of at least 1:2 to maximize your profit potential.
Real Trade Example Using GOLDEN RSI
In the SPX 15-minute chart above, the GOLDEN RSI accurately identified:
A Bearish Reversal near the market top, as the RSI entered overbought territory and started to fall.
A Bullish Reversal as the RSI dipped into the oversold zone and recovered upward.
These signals allowed for precise entry points, minimizing risk and maximizing rewards.
Why the GOLDEN RSI is a Game-Changer
Unlike generic RSI tools, the GOLDEN RSI is designed with traders in mind. It eliminates the guesswork by providing visual cues for market reversals. Whether you’re trading stocks, indices, or crypto, this indicator is a must-have in your toolkit.
How to Get the GOLDEN RSI Indicator?
Want to try it for yourself? Head over to TradingView and add the GOLDEN RSI Indicator to your chart. Use it alongside your favorite price action strategies to take your trading to the next level.
Conclusion
Reversals can make or break a trader’s portfolio. By mastering the GOLDEN RSI, you can confidently spot market tops, bottoms, and reversals with precision. Start using this custom indicator today and watch your trading results improve dramatically!
Don’t forget to like, share, and follow me on TradingView for more tutorials like this one. Let’s catch those reversals together!

How I Nailed a Perfect Breakout Trade Using a Simple Strategy*The following Analysis is made by my Trading BOT*
Analysis of Your Trade:
Descending Channel:
Formation and Breakout: The descending channel is well-defined, indicating a corrective phase following an impulsive move. The breakout above the channel suggests a potential reversal or continuation of the prior trend, which appears bullish.
Entry Timing: You entered the trade after the breakout from the descending channel. This entry aligns with a strategy to buy at the break of a corrective pattern, capitalizing on the resumption of bullish momentum.
Resistance Zone (Blue Area):
Initial Resistance Encounter: The blue horizontal line represents a resistance zone where price consolidated and failed to break higher on the first attempt. This is a good spot to watch for confirmation of a breakout or reversal.
False Breakouts: There are some upper wicks visible in this resistance zone, indicating possible false breakouts or liquidity grabs. This suggests that many traders might have been stopped out before the true breakout occurred.
Price Action Post-Breakout:
Sharp Move Down: After the breakout, price made a sharp move down to retest the previous resistance (now turned support), which aligns with the principles of market structure where old resistance becomes new support.
Correction and Continuation: The downward move appears corrective in nature, forming a series of lower highs and lower lows within a descending channel, after which the price breaks out and moves upwards sharply.
Risk and Reward Considerations:
Stop Placement: If your stop loss was placed below the previous swing low or the bottom of the descending channel, this would be a strategic placement to avoid being stopped out by market noise.
Take Profit: Your target seems to be well-placed, considering the previous highs or a key Fibonacci level. The green area likely represents the take-profit zone.
Volume Analysis:
Confirmation with Volume: The volume spike during the breakout from the descending channel and the subsequent move up indicates strong buying interest, which is a good confirmation signal.
Key Takeaways for Future Trades:
Pattern Recognition: Identifying descending channels and their breakouts is a strong skill that can be leveraged in various time frames.
Risk Management: Your trade shows a good understanding of risk management, especially if stops were placed beyond significant levels to avoid market noise.
Confirmation Signals: Waiting for volume confirmation during breakouts is an excellent strategy to avoid false moves.
Suggestions:
Multiple Time Frame Analysis: Ensure that your lower-time-frame trades are aligned with the higher-time-frame trends or setups to increase the probability of success.
Post-Trade Analysis: Continue reviewing your trades like this to refine your entry and exit strategies, especially around key zones like support and resistance.

Exploring Bearish Plays w/ Futures, Micros & Options on FutureIntroduction
The WTI Crude Oil futures market provides various avenues for traders to profit from bullish and bearish market conditions. This article delves into several bearish strategies using standard WTI Crude Oil futures, Micro WTI Crude Oil futures contracts, and options on these futures. Whether you are looking to trade outright futures contracts, construct complex spreads, or utilize options strategies, this publication aims to assist you in formulating effective bearish plays while managing risk efficiently.
Choosing the Right Contract Size
When considering a bearish play on WTI Crude Oil futures, the first decision involves selecting the appropriate contract size. The standard WTI Crude Oil futures and Micro WTI Crude Oil futures contracts offer different levels of exposure and risk.
WTI Crude Oil Futures:
Standardized contracts linked to WTI Crude Oil with a point value = $1,000 per point.
Suitable for traders seeking significant exposure to market movements.
Greater potential for profits but also higher risk due to larger contract size.
TradingView ticker symbol is CL1!
Margin Requirements: As of the current date, the margin requirement for WTI Crude Oil futures is approximately $6,000 per contract. Margin requirements are subject to change and may vary based on the broker and market conditions.
Micro WTI Crude Oil Futures:
Contracts representing one-tenth the value of the standard WTI Crude Oil futures.
Each point move in the Micro WTI Crude Oil futures equals $100.
Ideal for traders who prefer lower exposure and risk.
Allows for more precise risk management and position sizing.
TradingView ticker symbol is MCL1!
Margin Requirements: As of the current date, the margin requirement for Micro WTI Crude Oil futures is approximately $600 per contract. Margin requirements are subject to change and may vary based on the broker and market conditions.
Choosing between standard WTI Crude Oil and Micro WTI Crude Oil futures depends on your risk tolerance, account size, and trading strategy. Smaller contracts like the Micro WTI Crude Oil futures offer flexibility, particularly for newer traders or those with smaller accounts.
Bearish Futures Strategies
Outright Futures Contracts:
Selling WTI Crude Oil futures outright is a straightforward way to express a bearish view on the market. This strategy involves selling a futures contract in anticipation of a decline in oil prices.
Benefits:
Direct exposure to market movements.
Simple execution and understanding.
Ability to leverage positions due to margin requirements.
Risks:
Potential for significant losses if the market moves against your position.
Mark-to-market losses can trigger margin calls.
Example Trade:
Sell one WTI Crude Oil futures contract at 81.00.
Target price: 76.00.
Stop-loss price: 82.50.
This trade aims to profit from a 5.00-point decline in oil prices, with a risk of a 1.50-point rise.
Futures Spreads:
1. Calendar Spreads: A calendar spread, also known as a time spread, involves selling (or buying) a longer-term futures contract and buying (or selling) a shorter-term futures contract with the same underlying asset. This strategy profits from the difference in price movements between the two contracts.
Benefits:
Reduced risk compared to outright futures positions.
Potential to profit from changes in the futures curve.
Risks:
Limited profit potential compared to outright positions.
Changes in contango or backwardation could hurt the position.
Example Trade:
Sell an October WTI Crude Oil futures contract.
Buy a September WTI Crude Oil futures contract.
Target spread: Decrease in the difference between the two contract prices.
In this example, the trader expects the October contract to lose more value relative to the September contract over time. The profit is made if the spread between the December and September contracts widens.
2. Butterfly Spreads: A butterfly spread involves a combination of long and short futures positions at different expiration dates. This strategy profits from minimal price movement around a central expiration date. It is constructed by selling (or buying) a futures contract, buying (or selling) two futures contracts at a nearer expiration date, and selling (or buying) another futures contract at an even nearer expiration date.
Benefits:
Reduced risk compared to outright futures positions.
Profits from stable prices around the middle expiration date.
Risks:
Limited profit potential compared to other spread strategies or outright positions.
Changes in contango or backwardation could hurt the position.
Example Trade:
Sell one November WTI Crude Oil futures contract.
Buy two October WTI Crude Oil futures contracts.
Sell one September WTI Crude Oil futures contract.
In this example, the trader expects WTI Crude Oil prices to remain relatively stable.
Bearish Options Strategies
1. Long Puts: Buying put options on WTI Crude Oil futures is a classic bearish strategy. It allows traders to benefit from downward price movements while limiting potential losses to the premium paid for the options.
Benefits:
Limited risk to the premium paid.
Potential for significant profit if the underlying futures contract price falls.
Leverage, allowing control of a large position with a relatively small investment.
Risks:
Potential loss of the entire premium if the market does not move as expected.
Time decay, where the value of the option decreases as the expiration date approaches.
Example Trade:
Buy one put option on WTI Crude Oil futures with a strike price of 81.00, expiring in 30 days.
Target price: 76.00.
Stop-loss: Premium paid (e.g., 2.75 points x $1,000 per contract).
If the WTI Crude Oil futures price drops below 81.00, the put option gains value, and the trader can sell it for a profit. If the price stays above 78.25, the trader loses only the premium paid.
2. Synthetic Short: Creating a synthetic short involves buying a put option and selling a call option at the same strike price and expiration. This strategy mimics holding a short position in the underlying futures contract.
Benefits:
Similar profit potential to shorting the futures contract.
Flexibility in managing risk and adjusting positions.
Risks:
Potential for unlimited losses if the market moves significantly against the position.
Requires margin to sell the call option.
Example Trade:
Buy one put option on WTI Crude Oil futures at 81.00, expiring in 30 days.
Sell one call option on WTI Crude Oil futures at 81.00, expiring in 30 days.
Target price: 76.00.
The profit and loss (PnL) profile of the synthetic short position would be the same as holding a short position in the underlying futures contract. If the price falls, the position gains value dollar-for-dollar with the underlying futures contract. If the price rises, the position loses value in the same manner.
3. Bearish Options Spreads: Options offer versatility and adaptability, allowing traders to design various bearish spread strategies. These strategies can be customized to specific market conditions, risk tolerances, and trading goals. Popular bearish options spreads include:
Vertical Put Spreads
Bear Put Spreads
Put Debit Spreads
Ratio Put Spreads
Diagonal Put Spreads
Calendar Put Spreads
Bearish Butterfly Spreads
Bearish Condor Spreads
Etc.
Example Trade:
Bear Put Spread: Buying the 81.00 put and selling the 75.00 put with 30 days to expiration.
Risk Profile Graph:
This example shows a bear put spread aiming to profit from a decline in WTI Crude Oil prices while limiting potential losses.
For detailed explanations and examples of these and other bearish options spread strategies, please refer to our published ideas under the "Options Blueprint Series." These resources provide in-depth analysis and step-by-step guidance.
Trading Plan
A well-defined trading plan is crucial for successfully executing any strategy. Here’s a step-by-step guide to formulating your plan:
1. Select the Strategy: Choose between outright futures contracts, calendar or butterfly spreads, or options strategies based on your market outlook and risk tolerance.
2. Determine Entry and Exit Points:
Entry price: Define the price level at which you will enter the trade (e.g., breakout, UFO resistance, indicators convergence/divergence, etc.).
Target price: Set a realistic target based on technical analysis or market projections.
Stop-loss price: Establish a stop-loss level to manage risk and limit potential losses.
3. Position Sizing: Calculate the appropriate position size based on your account size and risk tolerance. Ensure that the position aligns with your overall portfolio strategy.
4. Risk Management: Implement risk management techniques such as using stop-loss orders, hedging, and diversifying positions to protect your capital. Risk management is vital in trading to protect your capital and ensure long-term success.
Conclusion
In this article, we've explored various bearish strategies using WTI Crude Oil futures, Micro WTI Crude Oil futures, and options on futures. From outright futures contracts to sophisticated spreads and options strategies, traders have multiple tools to capitalize on bearish market conditions while managing their risk effectively.
When charting futures, the data provided could be delayed. Traders working with the ticker symbols discussed in this idea may prefer to use CME Group real-time data plan on TradingView: www.tradingview.com This consideration is particularly important for shorter-term traders, whereas it may be less critical for those focused on longer-term trading strategies.
General Disclaimer:
The trade ideas presented herein are solely for illustrative purposes forming a part of a case study intended to demonstrate key principles in risk management within the context of the specific market scenarios discussed. These ideas are not to be interpreted as investment recommendations or financial advice. They do not endorse or promote any specific trading strategies, financial products, or services. The information provided is based on data believed to be reliable; however, its accuracy or completeness cannot be guaranteed. Trading in financial markets involves risks, including the potential loss of principal. Each individual should conduct their own research and consult with professional financial advisors before making any investment decisions. The author or publisher of this content bears no responsibility for any actions taken based on the information provided or for any resultant financial or other losses.

$RST Is a Prime Example of a Chart to AVOIDCharts that look like LSE:RST are the scariest ones to be in rn, especially in this downtrend.
literally no hope in sight, besides some crazy news sending it.
there's literally not even a trendline to go off of.
to turn bullish, it needs to have a 55% pump, and range in that $0.30 level for a while to show it built a floor.
then you might attract some bulls in.

ORDER BLOCK trading strategyThe order block trading strategy is based on the concept of smart money, focusing on identifying specific zones where institutional traders previously executed their orders. Once we have successfully identified these zones, we patiently wait for the price to revisit these levels.
By using a suitable strategy, we then enter our trades in the anticipated direction.
-What is an Order Block in Forex:
Order blocks are special zones within the market where significant buy or sell orders from major market participants, like institutional traders, have been previously executed.
These order clusters, situated in specific price regions, hold considerable influence over price action, market sentiment, and liquidity.
Order blocks serve as a specialized methodology to determine crucial support and resistance levels, derived from the trading behavior of institutional traders. These levels are subsequently employed as strategic points for initiating or concluding trades.
-Understanding Order Block in Trading:
In Forex or any other market, ict order block represent crucial price levels where we observe significant and aggressive price movements. These levels are characterized by large firms strategically placing their orders, which often results in the market moving forcefully from those points.
To influence the market in a specific direction, smart money or hedge funds execute orders worth billions of dollars at particular price levels. However, not all of their orders are immediately filled. As a result, smart money revisits these levels to execute the pending orders, leading to further movement in the desired direction.
-ICT Order Blocks Definition:
Order blocks can indeed be identified on any time frame, ranging from small time frame like 15m,30 m and m5 to larger time frames like daily or weekly charts.
Order blocks can be classified into two main types: Bullish Order Blocks and Bearish Order Blocks.
1. Bullish Order Block:
A Bullish Order Block is recognized as the last downward candle before the price experiences a significant and aggressive upward movement. It represents a key level where institutional traders placed substantial buy orders, causing the market to rally strongly from that point.
2. Bearish Order Block:
On the other hand, a Bearish Order Block is characterized by the last upward closing candle before the price undergoes a sharp and forceful downward movement. It signifies a critical level where large market participants, such as institutional traders, positioned significant sell orders, resulting in a significant decline in the market.
By identifying and analyzing these Bullish and Bearish Blocks, traders can gain insights into a potential reversal or continuation patterns and utilize them as entry or exit points for their trades.
Trading order blocks go beyond solely identifying the last up or down closing candle. To effectively trade order blocks, it is essential to consider several contextual factors, including:
1. Liquidity Hunt: Market participants, especially institutional traders, may strategically place their orders to trigger stop losses or create a liquidity imbalance. Understanding liquidity patterns and how they can influence price action is crucial.
2. Daily Bias: Evaluating the overall market sentiment and bias for the day is important. This involves considering factors such as news events, economic releases, and geopolitical developments that may impact the market and influence order-block behavior.
3. Interest Rates and Fundamentals: Fundamental factors, including interest rates, economic indicators, and central bank policies, can significantly influence market conditions. Understanding how these factors interact with order blocks can provide valuable insights for trading decisions.
By taking these contextual factors into account, traders can enhance their understanding of order blocks and make more informed trading decisions.
To identify order blocks, price action traders typically examine historical price movements on the chart to locate areas where the market has shown strong reactions.
-How to identifying order blocks:
1. Look for strong price reactions: Analyze the chart to identify areas where the price has displayed significant and notable reactions, such as sharp reversals, extended consolidations, or breakouts.
2. Mark potential order block levels: Once you identify these areas of strong price reactions, mark them as potential order block levels on your chart. These levels represent key price zones where institutional traders may have executed large orders.
3. Assess support and resistance characteristics: Consider how the price behaves with the marked order block levels. If the price bounces off a specific level multiple times, it indicates a robust level of support or resistance, depending on whether the price approached the level from above or below.
4. Watch for role reversal: When an order block level is breached, its role as support or resistance can reverse. For instance, a broken resistance level may transform into a support level, and vice versa. In such cases, traders often wait for a retest of the broken level before entering trades in the direction of the breakout.
By following these steps and considering the principles of support and resistance, traders can effectively identify and utilize order blocks in their trading strategies. However, it’s important to note that order block analysis is just one tool among many in a comprehensive trading approach.
-How To Trade Order Blocks:
The steps you’ve mentioned provide a general guideline for trading order blocks in forex. Here’s a breakdown of each step:
1. Point of Interest (POI): Start by identifying potential order blocks on higher time frames, such as daily and 4-hour charts. These could be areas of consolidation or strong price reactions. Once you’ve marked these POIs, move to the next step.
2. Optimization: Switch to lower time frames like 1-hour, 15-minute, or 5-minute charts to refine and optimize your POIs. By zooming in on these lower time frames, you can better analyze the price action within the identified areas.
3. Price Observation: Keep an eye on the price action in the higher time frame. Monitor how the price behaves as it approaches your POI. This observation helps you determine the strength of the order block and potential trading opportunities.
4. Rejection Analysis: When the price reaches your POI, switch to the lower time frame to examine how the order block reacts to the price. Look for signs of rejection, like fair value gap
5. Entry on Lower Time Frame: Once you’ve observed a rejection or a significant reaction at the order block on the lower time frame, you can plan your entry. Look for suitable entry signals, such as a breakout, pullback, FVG price Imbalance, and more
6. Stop Loss Placement: To manage risk, it’s important to place a stop loss order. Consider setting your stop loss 1 to 5 pips below the order block ict to allow for potential market noise and fluctuations. This helps protect your trading capital in case the trade doesn’t go as planned.
Remember, these steps provide a general framework for trading ict order blocks, but it’s crucial to develop a trading strategy that suits your risk tolerance, trading style, and market conditions.
It’s recommended to thoroughly back test and practice your strategy before applying it with real money. Additionally, staying updated with market news and having proper risk management practices are essential for successful trading.

BUT WHICH DIRECTION IS THE TREND HEADED?It's not a simple question and REALLY matters ALL of the time, so, finding a simple answer is a neat tool to have in the snuff-toolbox..
Here's the quickest, easiest down-n-dirry method for getting closer to an answer.
If you look at the ranging areas of the chart. The in-between, sideways, messy, wish-it-didn't-exist areas and draw a rough shape tracing the progression, then you'll likely notice either a "U" shape or an "n" shape (not everywhere, but at least one prominent one per section/timescale). You'll know if when you see it. Keep practicing and don't force it.
The U Shape can be reliably trusted to identify a Bullish trend, whilst the n Shape does the same when there's blood about.
Sound silly, right..
But it works.
And now you know..

Understanding the "Dead Cat Bounce" in TradingIn the dynamic world of trading, one peculiar phenomenon that often catches investors' attention is the "Dead Cat Bounce." This term, as bizarre as it sounds, is a crucial concept in technical analysis and market psychology. It refers to a temporary recovery in the price of a declining stock, followed by a continuation of the downtrend. This article delves into the nuances of the Dead Cat Bounce, helping traders recognize and navigate this pattern effectively.
What is a Dead Cat Bounce?
Originating from the saying, "even a dead cat will bounce if it falls from a great height," this metaphor is used to describe a brief and false recovery in a bear market. Essentially, it's a short-lived rally in the price of a stock or an index following a substantial decline, misleading some into believing that the downtrend has reversed.
Characteristics of a Dead Cat Bounce
Precipitating Sharp Decline: Typically, a Dead Cat Bounce occurs after a significant and rapid drop in price.
Temporary Rebound: The stock or index experiences a brief period of recovery, which may be mistaken for a trend reversal.
Resumption of Downtrend: The initial downtrend resumes, often eroding the gains made during the bounce.
Identifying a Dead Cat Bounce
The key challenge for traders is differentiating between a true market recovery and a Dead Cat Bounce. Here are some indicators:
Volume Analysis: A genuine recovery often accompanies increasing trade volumes, whereas a Dead Cat Bounce may occur on lower volumes.
Duration: Dead Cat Bounces are usually short-lived, lasting from a few days to a couple of weeks.
Technical Indicators: Tools like moving averages, RSI (Relative Strength Index), and Fibonacci retracements can aid in identifying these patterns.
Trading Strategies for Dead Cat Bounces
Short Selling: Traders might short sell a stock during a Dead Cat Bounce, anticipating the resumption of the downtrend.
Stop-Loss Orders: Setting strict stop-loss orders can mitigate risks if the bounce turns out to be a genuine reversal.
Patient Observation: Sometimes, the best strategy is to wait and observe the price action for clearer trend confirmation.
Case Studies and Examples
Analyzing past instances of Dead Cat Bounces can be educational. For instance, examining the 2008 financial crisis or the dot-com bubble burst reveals classic examples of this phenomenon.
Conclusion
The Dead Cat Bounce is a fascinating aspect of market behavior, representing the constant battle between optimism and reality in trading. Understanding this concept is not just about recognizing a pattern but also about grasping the underlying market psychology. As always, traders should approach these scenarios with caution, equipped with sound research and a well-thought-out strategy.

Mastering Market StructureBullish Market Structure:
Bullish Vibes! It's all about making Higher Highs and Higher Lows. When you spot this pattern, you're riding the wave of optimism in the market, and it's your chance to seize the moment and soar with the bulls.
Consolidation Market Structure:
Consolidation Market Structure is all about lateral movement, where the market forms Equal Highs and Equal Lows. It's a phase of uncertainty, with neither bulls nor bears holding a clear advantage. Traders often await a breakout to determine the next market direction.
Bearish Market Structure:
Bearish Market Structure: Get ready for Lower Highs and Lower Lows. Sellers are in control, creating a solid downtrend. Traders look for short entry opportunities on retracements.

📊 Popular Trading Terms CheatsheetThese are some of the most common terms you will hear around social media and often see them mentioned around trading related content. The best advice is to trade what you see in your chart, not the psychological noise of others
📌 FOMO
Fear of missing out is a common psychological event, especially when it comes to trading. You see prices go up and you feel guilty that you didnt enter on a trade and you missed that sweet 10-20% profit. The worst thing to do is be careless and enter a trade while the move has already happened. Trading is about patience and having a plan to execute. If you missed the move, you wait for the next one.
📌 FUD
Fear, uncertainty and doubt, usually spread by people that have zero idea of what they are doing. Very common observation around trading communities where they grab a headline and make it as if the world is going to end and everything is going to zero. Classic example is the whale alerts where they see big numbers of USDT moving from wallet to wallet, saying "dumb is coming sell everything". It never comes. Trade the charts not what clueless people have to say about it.
📌 HODL
Hold on for dear life, basically doubling down that you made a good trade and you should stick with it even if you know for a fact your entry was invalidated. If your plan is to day-trade and not "invest" into an asset, you should consider not hodling on losing trades. Depending how volatile that market you chose to trade is, you could hold into trades that can potentially wipe your whole account while copping with the fact that "it will get back to break even". Risk management is key, if you holding a losing trade which you invested more than 1-3% of your portfolio into it, you're already doing it wrong.
📌 MOONING
Price is actively increasing, the paradise of only up never down. A classic observation of moonboys and how they think price has only one direction. It doesn’t. This psychological state can be referred to as Euphoria and Greed. There is nothing going one direction so make sure you're a guard of your own mind and not let people like that influence what you actually see in the charts.
📌 WHALE
Wealthy investors who have enough shares of an asset to manipulate it. Basically people that bought early and cant wait for the next hype to dump their bags on new investors. Very common on the crypto world where people that bought before the hype happened, sell when the liquidity allows for it.
📌 ATH
All time high, basically the price of that asset has reached the highest it has ever been. It can have a powerful psychological impact on market participants because it makes them optimistic and over confident. If you're buying an asset that just made an ATH you add liquidity to the early investors of that asset.
📌 SHILL
Best observation of this are people promoting sh*tcoins around social media just so they can run their pump and dump schemes on their followers. When you see a "crypto" account run "airdrops" and "we will tell you the next x10000 pump coin in 10 mins" they aren't trading and you're already participating on their schemes by giving them engagements to promote what they are doing. Stay away from anything related to that, it doesn't exist.
BULLISH
The classic investors that always gonna double down that for example Bitcoin will go to 300k this year and long every dump of the market. It's never good to be doubling down on which direction the market will go then constantly long all day over a certain period of time if you're actively day trading.
📌 BEARISH
The opposite of bullish. They will tell you they will go long on Bitcoin once it gets back to 1k. Doubling down that the whole market will crash to that extend and shorting every pump. Trade the markets and what you see, having a bias such as this will likely get you rekt before you manage to see any major move to confirm your years long bearish take.
👤 @QuantVue
📅 Daily Ideas about market update, psychology & indicators
❤️ If you appreciate our work, please like, comment and follow ❤️

A loss for me a lesson for you- Trading a bearish FVGReview this first to see the fair value gap:
(1)Trades inside the -FVG
(2) Rejects -FVG(MT)
(3) Holds -FVG(L)
Note: This is a high probability sign for moves higher, price trades inside the 4H-FVG. Once price is inside, the price trades to the 4H-FVG(MT) and trades back down to the 4H-FVG(L) and price holds for a continuation inside.
(4) Prices trades through -FVG(MT)
(5) Trades and rejects the -FVG(H) and -OB
Note: This is where, and only where I should have entered for the sells that I attempted near the midpoint. We had already traded pass 4H-FVG(MT). After the failed entry, you should wait for price to reach the 4H-FVG(H) and in this case the -OB as well.

The Story Behind Bulls and BearsHello @TradingView family , this is @Vestinda, and let's have some fun and enjoy the markets together.
Vestinda is driven to offer our knowledge in developing winning strategies and make traders tasks easier.
This is The Story About Bulls and Bears. Bulls can lift things up, Bears can eat you for lunch.
Who Are The "Bulls" And The "Bears" In The Market
The terms "bulls" and "bears" are included in the trader's slang as the main categories of players in the market. Understanding the technique of the game will help you to understand the intricacies of how the market works.
"Bulls" are buying investors. Like their totem, they lift the enemy up on the horns. "Bulls" buy, wait for the rising rate and sell at a higher price. They dream of a prosperous economy: the lower the unemployment rate, the higher the GDP, the faster markets grow. Warren Buffett - the most famous representative of the bulls .
The Bears play on the opposite side. They earn on the depreciation, in a fading economy. Their ideal world is high unemployment, low GDP and large-scale crises.
It all starts long before the collapse of the market: the “bears” buy on credit and immediately resell, artificially creating a drop in prices. After the price becomes cheaper, they are purchased again, but at a lower price, and the debt is repaid. The difference between the first and second purchases is the profit of the bears.
💲 How Bulls Make Money On The Market 💲
"Bulls" buy, when they are sure that the market will go up. Examples of situations where this is possible:
🟣 the shareholder enterprise has published a financial report, and the figures exceeded forecasts;
🟣 the new reform allows to pay less taxes, thereby increasing profits;
🟣 the company has introduced a new product, which, according to analysts, will be in great demand;
🟣 the level of well-being, salary and solvency of the population are growing, which has a beneficial effect on the company's profit.
Bullish trades take time – you have to wait to make money. "Bears" are distinguished by shorter trades and the prospect of quick earnings.
A red flag for the bulls is an increase in prices by 20% from the lows and the presence of strong prerequisites for further growth. The most favorable moment comes when there are more buyers than sellers on the market.
📍 There Are 4 Key Phases Of A Bull Market:📍
1️⃣ "bearish" trends are gradually fading;
2️⃣ the backdrop of negative news has ended, but there is no confidence in future growth yet, the market is moving sideways, the growth of prices alternates with a fall;
3️⃣ the economy is going up, volatility is decreasing, investors are optimistic;
4️⃣ the peak of growth, traders make easy profits.
The market trends are cyclical, a bull market becomes overbought over time and inevitably turns into a bear market. The move up can be uneven, with periods of pullbacks and corrections, that provide an opportunity to profit on counter-trend trades.
As a rule, prices didn't rise as quickly and unpredictably as they fall. Therefore, transactions in the "bullish" market are characterized by a longer period, the so-called "long positions". Both own and borrowed money, shares and other assets, which are returned after closing, act as collateral.
Long positions are considered more stable, predictable and calm. Therefore the majority of market participants are "bulls" (or consider themselves so). In an uptrend, it's easy to choose an investment because almost everything goes up. However, the "bulls" need to be careful and remember, that there is no eternal growth, the market can be oversaturated at any moment, turning in the opposite direction. It is important for conservative traders to exit the game on time.
💲 How Bears Make Money On The Market 💲
The bears enter the arena during a downturn in the economy and prices. Their tactic is to sell at the beginning of a downtrend and then buy at the end of a downtrend. If they guess the high and low points of the bear market, they will receive the maximum margin.
Examples of situations, that will play into the hands of this category of traders:
🟣 there were large-scale economic crises, force majeure situations, natural disasters, epidemics, wars;
🟣 the shareholder enterprise found itself in the center of a scandal or changed its general director;
🟣 sales of the new product failed.
A "bear" market comes into its own, when prices fall by 20% from the maximum.
There are 4 main stages of the trend:
1️⃣ the bull market is oversaturated and goes into overbought phase;
2️⃣ against the backdrop of negative sentiment, prices fall sharply, and trading activity decreases, panic arises on the market;
3️⃣ prices fell quite strongly, but continue to gradually decline, at this time “bears” enter the market en masse;
4️⃣ seduced by cheaper prices, conservative investors become more active, due to which the market gradually turns in the opposite direction.
Thus, the "bear" market is gradually replaced by a "bullish" one.
Can a Bull become a Bear?
In fact, these divisions are rather arbitrary, they were created by exchange slang. Officially, in the market, you do not need to indicate yourself in which category you belong, so no need to be a bull or a bear all your life.
Traders' strategies are good because they can be adapted or completely changed to specific conditions on the exchange. It's not always possible to sell shares at the maximum or buy at the minimum price, so you have to adjust to the average attitude. Therefore, a “bull” can become a “bear”, just like a “bear” can become a “bull”.
Conclusion: What are Bulls and Bears in Trading?
Bulls and Bears are two sides of the stock market. Bulls are traders who believe that the stock prices will go up, while bears are traders who think that the stock prices will go down. In trading, these two forces are constantly at work, and understanding their roles can help you make better decisions when it comes to investing. Bulls and Bears play an important role in trading as they provide insight on the direction of a particular security or market trend. By understanding their roles in trading, investors can more accurately predict future price movements and make more profitable trades.
Dear friends, this is our first post. 😊 If you liked it, press <> 👍, share it on your social networks, groups - it will allow more people get interesting information, and we'll be able to delight you with new posts even more!♥️

Topping Pattern Example (Head and Shoulders)Hunstman is a chemical manufacturer whose earnings have plummeted over 85% compared to the first half of 2022. The chart is a prime example of a large head & shoulders pattern. Analysts expect its earning to remain depressed and the chart shows signs of Distribution over the past 2 years.

📉 4 Common Bearish PatternsIn trading, a bearish pattern is a technical chart pattern that indicates a potential trend reversal from an uptrend to a downtrend. These patterns are characterized by a series of price movements that signal a bearish sentiment among traders.
📍Bear Flag
🔸 A small rectangular pattern that slopes against the preceding trend
🔸 Forms after a rapid price decline (flagpole)
🔸 The pattern is completed when the price breaks below the lower trend line of the flag
📍Descending Triangle
🔸 A bearish continuation pattern that forms with a horizontal support line and a descending trendline
🔸 Forms as the price reaches lower highs, while the lows remain at the same level
🔸 The pattern is completed when the price breaks below the horizontal support line
📍Rising Wedge
🔸 A bearish reversal pattern that forms with a series of higher highs and higher lows
🔸 The pattern forms as the price moves up in a narrowing range
🔸 The pattern is completed when the price breaks below the lower trendline
📍Triple Top
🔸 A bearish reversal pattern that forms with three peaks at the same price level
🔸 The pattern forms as the price reaches resistance at the same level multiple times
🔸 The pattern is completed when the price breaks below the support level, which connects the lows between the peaks
👤 @AlgoBuddy
📅 Daily Ideas about market update, psychology & indicators
❤️ If you appreciate our work, please like, comment and follow ❤️

📉 Downtrend Identification CheatsheetWhat Is a Downtrend? A downtrend is a gradual reduction in the price or value of a stock or commodity, or the activity of a financial market. A downtrend can be contrasted with an uptrend. Downtrends are characterized by lower peaks and troughs and mimic changes in the perception of investors. A downtrend is fueled by a change in the supply of stocks investors want to sell compared with the demand for the stock by investors who want to buy. Downtrends are responses to changes that surround the security, whether macroeconomic or those associated with a company's business activity.
🔹Understanding and Identifying Downtrends
As much as it is important to look out for uptrends when trading, it is equally important to understand and identify downtrends. A trader may potentially save money if they decide to sell off a declining stock. If many traders decide to sell a stock at the same time, it will result in a sharp decline in the stock price. The stock market is sentiment-driven, and fear of a further decline may result in even further selloffs of a stock. Some traders that frequently day trade may decide to implement stop-loss orders to protect themselves against a downtrend. A stop-loss order placed with a broker helps a trader sell once the price of the security reaches a certain price. Downtrends can vary from a gradual continuation to a sharp decline. A sharp decline may occur as a result of news-related topics, such as a poor quarterly earnings report or loss of a lawsuit. A downtrend can be identified and understood through various forms of technical analysis. One simple area of technical analysis is the use of trendlines. Trendlines connect a series of high or low points. The reversal of a declining trendline signals an uptrend. Another simple area of technical analysis is the moving average technical indicator. The moving average takes the mean of prices over a period in the past. If the price of a stock tends to stay below the moving average, it signals that the price is on a downtrend.
🔹Trading on a Downtrend
Many traders look to profit from sell offs of a stock. While many traders will sell, taking the view that a price will decrease further in the future, some traders take the opposite view of hoping for a price increase. Downtrends may also lead to attractive valuation and present new opportunities for traders to purchase shares of stock.
In another sense, downtrends allow traders to make money by short-selling stocks. In order to short a stock, a trader borrows shares and immediately sells them, in hopes that the price will fall. If the price of the stock goes down, then the individual will repurchase the shares back at the lower price and return the borrowed shares. The difference between the old price and the new price is the profit that a short-selling trader holds.
👤 @AlgoBuddy
📅 Daily Ideas about market update, psychology & indicators
❤️ If you appreciate our work, please like, comment and follow ❤️

How to understand the falling wedge and rising wedgeHello dear traders,
Here are some educational chart patterns you must know in 2022 and 2025.
I hope you find this information educational and informative.
We are new here so we ask you to support our views with your likes and comments,
Feel free to ask any questions in the comments, and we'll try to answer them all, folks.
What Is a Wedge?
A wedge is a price pattern marked by converging trend lines on a price chart. The two trend lines are drawn to connect the respective highs and lows of a price series over the course of 10 to 50 periods. The lines show that the highs and the lows are rising or falling at differing rates, giving the appearance of a wedge as the lines approach a convergence. Wedge-shaped trend lines are considered useful indicators of a potential reversal in price action by technical analysts.
Understanding the Wedge Pattern:-
A wedge pattern can signal either bullish or bearish price reversals. In either case, this pattern holds three common characteristics: first, the converging trend lines; second, a pattern of declining volume as the price progresses through the pattern; third, a breakout from one of the trend lines. The two forms of the wedge pattern are a rising wedge (which signals a bearish reversal) and a falling wedge (which signals a bullish reversal).
Falling Wedge pattern:-
When a security's price has been falling over time, a wedge pattern can occur just as the trend makes its final downward move. The trend lines drawn above the highs and below the lows on the price chart pattern can converge as the price slide loses momentum and buyers step in to slow the rate of decline. Before the lines converge, the price may breakout above the upper trend line.
When the price breaks the upper trend line, the security is expected to reverse and trend higher. Traders identifying bullish reversal signals would want to look for trades that benefit from the security’s rise in price.
Rising Wedge pattern:-
This usually occurs when the security's price has been rising over time, but it can also occur in the midst of a downtrend.
Trend lines drawn above and below a price chart pattern can converge to help a trader or analyst anticipate breakout reversals. While the price can break out of either trend line, the wedge pattern has a tendency to break out from the trend line in the opposite direction.
Therefore, the ascending wedge pattern indicates a higher probability of further downside in the price after the breakdown of the lower trend line. Traders can enter bearish trades on the basis of a charted security after a breakout, either by selling the security short or by using derivatives such as futures or options. These trades will seek to profit from the possibility of a fall in prices.
Trading Profits for the Wedge Pattern:-
As a general rule, price pattern strategies for trading systems rarely produce returns that outperform buy-and-hold strategies over time, but some patterns nevertheless appear to be useful in predicting general price trends. Huh. Some studies suggest that a wedge pattern will break out toward reversal (a bullish breakout for falling wedges and a bearish breakout for rising wedges) more than two-thirds of the time, with a falling wedge being followed by a rising wedge. Is a more reliable indicator than the wedge. ,
Because wedge patterns converge in a smaller price channel, the distance between the price at the entry of the trade and the price for the stop loss is relatively smaller than at the beginning of the pattern. This means that the stop loss can be placed closer to the time the trade is initiated, and if the trade is successful, can result in a return greater than the amount of risk initially placed on the trade.
Wedge a Continuation or a Reversal Pattern:-
The wedge pattern signals a reversal. The reversal is either bearish or bullish, depending on where the trend line meets, what the trading volume is, and whether the wedge is falling or rising.
Trade with care.
If you like our content, please feel free to support our page with a like, comment
Hit the like button if you like it and share your charts in the comments section.
Thank you

How To Enter A Bear Cryptocurrency Market Entry after price pulls back to Pivot Point and Channel Resistance Level and forms a rejection candlestick.

Simple Strategy with Good R&R (Works bullish or bearish)
1. identify the trend ; whether up (bullish) or down (bearish) .
2. Identify an impulse move to the up or down side.
3. Watch for a correction from the impulse, then wait for a retest and or bounce of the 800-day ema.
4. Wait for a bullish order block (OB) that closes above the 800-day ema. Then enter on the retest of the 800-day ema and go long or short accordingly.
5. stop loss below the corrections lowest low and take profit at the impulses highest high.
This works on all types of assets from AMEX:SPY to FX:EURUSD to BINANCE:BTCUSDT and even CME_MINI:ES1! .
