Learn These Patterns And You'll Never Regret ItEVERYTHING ON THE TRIANGLE PATTERN
a triangle chart pattern involves price moving into a tighter and tighter range (like a consolidation phase which has a triangle-like shape) as time goes by and provides a visual display of a battle between bulls and bears.
The triangle pattern is generally categorised as a “continuation pattern”, meaning that after the pattern completes, it’s assumed that the price will continue in the trend direction it was moving before the pattern appeared.
note: the triangle pattern depends on the trend however don't hold on to that thought since fake-outs are possible. the point i am trying to make is that you should not be obsessed with which direction the price goes, but you should be ready for movement in either direction.
there are three triangle patterns:
a) the ascending (upward slope consisting of higher-lows and a consistent resistance),
b) descending (downward slope consisting of lower-highs and a consistent support)
c) symmetrical (equal slopes the market is forming lower-highs and higher-lows)..
the triangle is different from a wedge. however, a wedge can be in a triangle or better put the general formation of a wedge is a triangle-like shape (in some cases).
point to note:
• you need at least two points (bullish or bearish) to connect for a triangle to be considered, and a consistent support or resistance.
• the volatility of price of any instrument decreases when there's a triangle pattern and increases on breakout of the pattern.
• measuring the size of the triangle can serve as a good profit target (will explain in meeting)
• keep an open mind at all times.
📝..
Descending Triangle

Triangle Chart Patterns: How to Identify and Trade ThemTriangle Chart Patterns: How to Identify and Trade Them
Triangle chart patterns are essential tools in technical analysis, helping traders identify potential trend continuations. These formations build as the price consolidates between converging trendlines, signalling an upcoming move in the market. In this article, we’ll explore the three types of triangle patterns—symmetrical, ascending, and descending—and how traders use them to analyse price movements.
What Are Triangle Chart Patterns?
Triangle chart patterns are a common tool used to understand price movements in the market. These patterns form when the price of an asset moves within two converging trendlines, creating a triangle shape on a chart. The lines represent support and resistance levels, and as they get closer together, it signals a potential breakout in one direction.
Symmetrical, ascending, and descending are three types of triangle patterns. Each of these patterns reflects a different market sentiment, with symmetrical triangles showing indecision, ascending triangles suggesting a bullish bias, and descending triangles hinting at bearish momentum. These formations are useful because they help traders spot potential breakouts, where the price might move sharply up or down after a period of consolidation.
It’s important to note that triangles and wedge patterns are similar but not the same. Both patterns involve converging trendlines, but wedges tend to slope upward or downward. Triangles, on the other hand, either feature one horizontal trendline and a sloping trendline or two sloping trendlines at roughly the same angle.
Below, we’ll cover the three triangle types. If you’d like to follow along, head over to FXOpen and TradingView to get started with real-time charts.
Symmetrical Triangle
The symmetrical triangle is a popular chart pattern that shows up when the price of an asset starts consolidating within a tighter range. Unlike other triangle patterns, it doesn’t lean heavily in either direction—bullish or bearish—making it a neutral signal. It forms when buyers and sellers are in a bit of a standoff, with no clear trend in sight. However, this period of indecision often leads to a significant move once the price breaks out of the pattern.
What Does It Look Like?
- Two converging trendlines;
- One sloping down from the highs (resistance);
- One sloping up from the lows (support);
- The price oscillates between these two lines, forming lower highs and higher lows;
- The formation narrows as the lines get closer together, creating a point of breakout.
What Does It Indicate?
A symmetrical triangle pattern indicates a period of indecision in the market. Buyers and sellers are evenly matched, causing the price to move within a narrowing range. As it gets smaller, the pressure builds, and the price is likely to break out either up or down. Since the formation is neutral, the breakout could occur in either direction, and traders wait for this moment to see where the market is heading.
How Do Traders Use It?
Traders typically watch for a breakout from the symmetrical triangle to signal the next significant price movement. They often look for an increase in trading volume alongside the breakout, as this can confirm the strength of the move. In most cases, it’s used as a signal for potential price continuation. However, some traders see it as a reversal indicator, depending on what the preceding trend looks like.
Ascending Triangle
An ascending triangle is a bullish triangle pattern that’s often looked for when analysing potential price breakouts. It usually forms during an uptrend but may also appear in a downtrend. It suggests that buyers are becoming more aggressive, while sellers are struggling to push the price lower, creating a situation where the market might break upwards.
What Does It Look Like?
- A horizontal resistance line at the top (price struggles to break above this level);
A rising trendline at the bottom, connecting higher lows (buyers are stepping in earlier each time);
- The price moves between these two lines, creating a triangle shape;
- The formation narrows over time, putting pressure on the resistance level.
What Does It Indicate?
An ascending triangle pattern signals that buyers are gaining control. While the price keeps hitting a ceiling (resistance), the higher lows show that the market’s buying pressure is increasing. This often leads to a breakout above the resistance level, where the price can make a significant upward move. Traders usually see this formation as a sign that the market is primed for a continuation of the current uptrend. However, sometimes it can appear in a downtrend and signal a trend reversal.
How Do Traders Use It?
Traders typically use the ascending triangle to spot potential breakouts above the resistance level. When the price finally moves and closes above this line, it’s seen as confirmation that the upward trend is continuing. Many also pay close attention to the trading volume during this breakout—rising volume can confirm that the breakout is genuine.
In some cases, the price may break through the resistance quickly, while in others, it could take time before the upward move happens. There may also be false breakouts before the true bullish move occurs, with the price typically closing below resistance.
Descending Triangle
A descending triangle is a bearish chart pattern that signals potential downward movement in the market. It typically forms during a downtrend but can also appear in an uptrend. It shows that sellers are becoming more dominant, while buyers are struggling to push the price higher, which could lead to a breakdown below a key support level.
What Does It Look Like?
- A horizontal support line at the bottom (price struggles to break below this level);
- A descending trendline at the top, connecting lower highs (sellers are pushing the price down);
- The price moves between these two lines, creating a triangle shape;
- The formation narrows over time, with the pressure building on the support level.
What Does It Indicate?
A descending triangle chart pattern suggests that sellers are in control. While the price holds at the support level, the series of lower highs shows that selling pressure is increasing. This often leads to a breakdown below the support line, where the price might experience a sharp decline. Traders see the formation as a bearish signal, indicating that the market could continue its downward trend.
How Do Traders Use It?
Traders typically use the descending triangle to identify potential breakdowns below the support level. When the price falls and closes below this line, it’s considered confirmation that the sellers have taken over and that further downside movement could follow.
Similar to other triangle patterns, it’s common to watch for a rise in trading volume during the breakdown, as it can confirm the strength of the move. It’s also possible to see false breakouts below the support level when the price closes back inside the pattern almost immediately.
How Traders Use Triangle Patterns in Technical Analysis
These patterns are just one piece of the puzzle in technical analysis, but they can offer us valuable insights when used correctly.
Triangle Pattern Trading: Entry, Stop-Loss, and Profit Targets
Entry Points
Traders typically wait for a confirmed breakout from the triangle formation’s boundaries before entering a trade. For ascending triangles, this means watching for the price to break above the upper trendline (resistance), while for descending triangles, they look for a breakdown below the lower trendline (support). In a symmetrical triangle, the breakout may be in either direction, usually informed by the broader market trend.
The entry is often confirmed by a closing candle above or below these key levels to reduce the risk of false breakouts.
Stop-Loss Placement
Stop-loss orders are crucial here. For ascending triangles, stop losses might be placed just below the last swing low, while for descending triangles, they might be set just above the recent swing high. In the case of symmetrical triangles, traders often place the stop-loss just outside the formation’s apex.
Profit Targets
To set profit targets, traders typically use the triangle's height (the distance between the highest and lowest points). This height is then projected from the breakout point, offering a realistic target for the trade. For example, if a triangle stock pattern’s height is $10 and the breakout occurs at $50, the target would be $60 for a bullish move.
Combining with Market Context
Triangles may become more reliable when considered in the context of the broader market environment. Traders don’t just look at the pattern in isolation—they analyse the prevailing trend, market sentiment, and even macroeconomic factors to gauge whether a breakout aligns with the larger market movement. For instance, an ascending formation in a strong uptrend adds confidence to the idea of a bullish breakout.
Using Other Indicators for Confirmation
While triangles provide a useful framework, they’re usually combined with other technical indicators for confirmation. Traders often align triangles with volumes, moving averages, or momentum indicators to assess whether the breakout has strong support behind it. For instance, a breakout confirmed by high volume or a moving average crossover might add confluence to the trade.
Limitations and Considerations of Triangle Patterns
Triangles are useful tools in technical analysis, but they come with limitations and important considerations. While they can signal potential breakouts, it’s essential to approach them cautiously.
- False Breakouts: Triangles often experience false breakouts, where the price briefly moves beyond the trendline but quickly reverses. This may trap traders in unfavourable positions.
- Subjectivity: These formations are open to interpretation. Different people may draw trendlines slightly differently, leading to varying conclusions about where the breakout occurs.
- Need for Confirmation: Relying solely on patterns can be risky. They may work better when combined with other indicators, such as volume or moving averages, to confirm the trend direction.
- Market Conditions: In volatile or news-driven markets, chart patterns may not behave as expected, reducing their reliability. They may provide false signals or lose significance in these situations.
The Bottom Line
Triangle chart patterns are popular tools among those looking to analyse market movements and potential breakouts. Whether it’s a symmetrical, ascending, or descending triangle, these patterns provide valuable insights into price consolidation and future trends. While no pattern guarantees a winning trade, combining triangles with other indicators may improve market analysis.
Ready to apply your knowledge? Open an FXOpen account to explore chart patterns in more than 700 live markets and take advantage of our low-cost, high-speed trading environment backed by advanced trading platforms.
FAQ
What Is a Triangle Chart Pattern?
A triangle chart is a pattern in technical analysis that forms when the price of an asset moves between converging trendlines, creating a triangle shape on a price chart. They typically signal a period of consolidation before a strong potential breakout in price.
What Are the Patterns of Triangles?
There are three main types of triangles in chart patterns: symmetrical, ascending, and descending. Symmetrical triangles indicate indecision in the market while ascending triangles are often bullish, and descending triangles tend to be bearish.
How to Trade a Triangle?
Traders typically wait for a confirmed breakout from the triangle’s trendlines. According to theory, entry points are based on a breakout above resistance or below support, with stop-loss orders placed just outside the triangle. Profit targets are often set based on the height (the distance between the highest and lowest points) of the pattern.
What Is the Triangle Pattern Strategy?
The triangle pattern strategy involves waiting for a breakout and using the formation’s height to set profit targets. It’s combined with tools like volume, moving averages, and momentum indicators to confirm the move and avoid false breakouts.
Is the Triangle Pattern Bullish or Bearish?
They can be both bullish and bearish. Ascending triangles are generally seen before a bullish movement, descending triangles are bearish, and symmetrical triangles can be either.
This article represents the opinion of the Companies operating under the FXOpen brand only. It is not to be construed as an offer, solicitation, or recommendation with respect to products and services provided by the Companies operating under the FXOpen brand, nor is it to be considered financial advice.

Actual Success Rates of Ascending and Descending TrianglesActual Success Rates of Ascending and Descending Triangles
Here is an analysis of the actual success rates of ascending and descending triangles in trading, based on the information provided:
Success Rates
Ascending and descending triangles generally have fairly high success rates as continuation patterns:
-The ascending triangle has a success rate of approximately 72.77%.
-The descending triangle has a slightly higher success rate of 72.93%.
These numbers come from a study that tested over 200,000 price patterns over a 10-year period.
Factors Influencing Success
Several factors can influence the success rate of these patterns:
-The trader's ability to execute the strategy correctly
-Market conditions at the time the triangle formed
-Market liquidity
-Overall market sentiment
Important Points to Consider
-Triangles are considered reliable continuation patterns, especially in trending markets.
-The ascending triangle in an uptrend is statistically more reliable than the descending triangle.
-To validate the pattern, the price must touch at least twice each of the upper and lower lines.
-An increase in volume during the breakout is an important confirmation sign.
Strategies to improve the chances of success
-Wait for the triangle to fully form before entering a position1.
-Confirm the breakout with a close above/below the resistance/support level.
-Use additional technical indicators to confirm the signal.
-Pay attention to the volume, which should increase during the breakout.
Conclusion
Although ascending and descending triangles have relatively high success rates, it is important to use them in conjunction with other technical analysis tools and to take into account the overall market context to maximize the chances of success.

CHARTIST TRIANGLES: HOW DOES IT WORK? ANSWER is HERE!ASCENDING TRIANGLE:
Identify the levels where the price has often closed and opened (black line).
The price is making higher and higher lows.
Draw a bullish diagonal.
Take Profit is calculated by plotting the lowest increase on the black line (see graph).
Report this segment to the BREAK of the black line, but ESPECIALLY to the CLOSING of the candle in its time unit!!!
___________________________________________________
DESCENDING TRIANGLE:
Identify the levels where the price has often closed and opened (black line).
The price makes higher and lower highs.
Draw a bullish diagonal.
Take Profit is calculated by plotting the highest drop on the black line (see graph).
Report this segment to the BREAK of the black line, but ESPECIALLY to the CLOSING of the candle in its time unit!!!
___________________________________________________
SYMMETRICAL TRIANGLE:
The triangle of indecision, just like the RANGE!!
The price is tightening, and we don't know in which direction it's going PETER!!??
Draw a bullish and bearish diagonal.
Wait for a break in one of the diagonals.
The Take Profit is calculated by reporting the highest side of the rectangle which made a PULLBACK (see my old publication on "PULLBACK") and see graph below.
Report this segment to the BREAK of one of the diagonals, but ESPECIALLY to the CLOSING of the candle in its time unit!!!
STOP Loss below the previous low if you are BUYING.
STOP Loss above the previous high if you are SHORT (Seller).

4 Triangle Types You Need to KnowTriangle chart patterns offer valuable insights into market dynamics, symbolizing a clash between buyers and sellers within a contracting price range. These patterns are often classified as continuation or neutral patterns, suggesting that the price is likely to persist in its existing trend after the pattern concludes.
1. Symmetrical Triangle:
A symmetrical triangle manifests when the slope of the price's highs and lows converges, creating a triangular structure. This pattern signifies a period of consolidation, with lower highs and higher lows indicating equilibrium between buyers and sellers. As the slopes converge, a breakout becomes imminent, though the breakout direction remains uncertain.
To capitalize on a symmetrical triangle , consider placing entry orders above the slope of the lower highs and below the slope of the higher lows, prepared to ride the price in the direction of the breakout.
2. Ascending Triangle:
An ascending triangle features a resistance level and a slope of higher lows. Buyers gradually push the price up, testing the resistance level. This pattern often signals an upward breakout as buyers gain strength and attempt to breach the resistance.
To trade an ascending triangle , set entry orders above the resistance line and below the slope of the higher lows, anticipating a potential upward breakout. However, remain open to movement in either direction, as the resistance level may prove formidable.
3. Descending Triangle:
In contrast to the ascending triangle , a descending triangle comprises lower highs forming the upper line, with a robust support level acting as the lower line. Sellers gain ground against buyers, and in most cases, the support line eventually breaks, leading to a continued downward move.
To trade a descending triangle , set entry orders above the upper line (lower highs) and below the support line, prepared for a potential breakout. Note that sometimes, the support line may hold, resulting in a robust upward move.
4. Broadening Triangle:
Now, let's delve into the captivating Broadening Triangle , also known as a Megaphone Pattern. This pattern stands out due to its expanding price range, creating a distinctive visual pattern on the chart.
The Megaphone Pattern comprises a series of higher highs and lower lows, causing the price range to widen over time. This pattern reflects increasing volatility and uncertainty in the market, with both buyers and sellers actively participating.
Trading Triangles demands meticulous analysis and risk management due to their nature and potential for unpredictable price moves.
To approach Triangle patterns effectively:
1️⃣ Pay attention to the pattern's boundaries: Identify the upper trendline connecting the highs and the lower trendline connecting the lows. These trendlines define the range of price movement within the pattern.
2️⃣ Watch for breakouts and reversals: Triangles often precede significant price movements. Look for breakouts above the upper trendline or breakdowns below the lower trendline as potential trading opportunities.
3️⃣ Confirm with additional indicators: Combine your analysis with other technical indicators or tools to validate your trading decisions. Consider using indicators like moving averages, oscillators, or volume analysis to confirm the pattern's potential direction.
Remember, trading Triangles necessitates careful analysis and risk management. Consider the overall market context, fundamental factors, and other technical signals to make informed trading decisions.
While chart patterns provide valuable insights, they cannot guarantee future price movements. Always conduct thorough research, stay updated with market news, and adapt your strategy as market conditions evolve.
Wishing you successful trading journeys guided by these patterns! 🚀📈✨
💬 We would love to hear your thoughts and feedback on the article! Please leave your comments and questions below the article. Your input is valuable to us!

TRADING SYMMETRICAL⬇️⬆️🔄 ASCENDING📈 DESCENDING📉🔻⬇️TRIANGLES
Hello traders, today we will delve into three types of triangles, which are significant chart patterns providing valuable insights into potential market movements. Understanding these patterns can play a pivotal role in making well-informed trading decisions. Let's explore each type and learn how to identify and interpret them effectively.
**1. Symmetrical Triangle:**
The symmetrical triangle pattern is formed by a series of lower highs and higher lows, resulting in converging trendlines. It indicates a period of market consolidation, where the price oscillates between lower highs and higher lows, signaling an imminent breakout in either direction.
**Key Characteristics:**
- **Shape:** Resembles a triangle, with converging trendlines. The horizontal resistance line connects the price highs, while the rising trendline connects the higher lows.
- **Duration:** Can take several weeks or even months to form, depending on the time frame being analyzed.
- **Volume:** As the symmetrical triangle develops, the trading volume tends to diminish. However, during the breakout, there may be an increase in volume, confirming the validity of the pattern.
- **Breakout:** The pattern is confirmed once the price breaks decisively above the horizontal resistance line (bullish breakout) or below the rising trendline (bearish breakout).
- **Price Target:** To estimate the potential price target after the breakout, measure the height of the triangle at its widest point (the distance between the highest high and lowest low within the triangle) and project it in the direction of the breakout.
- **Stop Loss:** Traders typically place their stop-loss orders just outside the triangle, slightly beyond the opposite trendline from the direction of the breakout, to protect against false breakouts.
Traders often enter a long (buy) position when the price breaks above the horizontal resistance line with a significant increase in volume or below the rising trendline in the case of a bearish breakout.
**Limitations:**
- **False Breakouts:** Sometimes, the price may briefly break above the resistance line or below the rising trendline, only to reverse in the opposite direction, causing a false breakout. Waiting for confirmation is crucial to avoid getting trapped in false signals
- **Market Context:** While the symmetrical triangle indicates potential continuation, it's essential to consider the broader market context and use other technical indicators or fundamental analysis to support trading decisions.
**2. Ascending Triangle:**
The ascending triangle pattern is a bullish chart pattern that forms during an uptrend and represents a continuation pattern. It is formed by a horizontal resistance level and an upward-sloping trendline acting as support. This pattern suggests that buying pressure is gradually intensifying, and a breakout above the horizontal resistance may trigger a bullish move.
**Key Characteristics:**
- **Shape:** Resembles a triangle, where the horizontal resistance line connects two or more price highs, and the rising trendline connects higher lows.
- **Duration:** The pattern can take several weeks or even months to form, depending on the time frame being analyzed.
- **Volume:** Volume tends to diminish as the pattern develops. However, during the breakout, there is often an increase in volume, confirming the pattern's validity.
- **Breakout:** The pattern is confirmed once the price breaks above the horizontal resistance line. The breakout is considered a bullish signal, suggesting that the upward trend is likely to continue.
- **Price Target:** To estimate the potential price target after the breakout, measure the height of the triangle's base (the distance between the horizontal resistance line and the rising trendline) and project it upward from the breakout point.
- **Stop Loss:** Traders typically place their stop-loss orders just below the rising trendline to protect against a false breakout.
**Trading the ascending triangle:**
- **Entry:** Traders often enter a long (buy) position when the price breaks above the horizontal resistance line with a surge in volume.
- **Stop Loss:** The stop-loss level is usually set just below the rising trendline.
- **Take Profit:** The take-profit level is determined using the measured move method by adding the height of the triangle's base to the breakout point.
- **Confirmation:** It is crucial to wait for a clear breakout before entering the trade, as false breakouts can occur. A significant increase in volume during the breakout is often considered a strong confirmation signal.
**Limitations:**
- **False breakouts:** Sometimes, the price may break above the resistance line temporarily and then reverse lower, causing a false breakout. It is essential to wait for a clear confirmation.
- **Market context:** While the ascending triangle is a bullish pattern, it's important to consider the broader market context and analyze other indicators to confirm the likelihood of the pattern leading to a successful trade.
**3. Descending Triangle:**
The descending triangle pattern is a bearish chart pattern that forms during a downtrend and represents a continuation pattern. It is formed by a horizontal support level and a downward-sloping trendline as resistance. This pattern indicates that selling pressure is progressively strengthening, and a breakdown below the horizontal support might lead to a bearish move.
**Key Characteristics:**
- **Shape:** Resembles a triangle, where the horizontal support line connects two or more price lows, and the downward-sloping trendline connects lower highs.
- **Duration:** The pattern can take several weeks or even months to form, depending on the time frame being analyzed.
- **Volume:** Volume tends to diminish as the pattern develops. However, during the breakdown, there is often an increase in volume, confirming the pattern's validity.
- **Breakdown:** The pattern is confirmed once the price breaks below the horizontal support line. The breakdown is considered a bearish signal, suggesting that the downtrend is likely to continue.
- **Price Target:** To estimate the potential price target after the breakdown, measure the height of the triangle's base (the distance between the horizontal support line and the downward-sloping trendline) and project it downward from the breakdown point.
- **Stop Loss:** Traders typically place their stop-loss orders just above the downward-sloping trendline to protect against a false breakdown.
**Trading the descending triangle:**
- **Entry:** Traders often enter a short (sell) position when the price breaks below the horizontal support line with a surge in volume.
- **Stop Loss:** The stop-loss level is usually set just above the downward-sloping trendline.
- **Take Profit:** The take-profit level is determined using the measured move method by subtracting the height of the triangle's base from the breakdown point.
- **Confirmation:** It is crucial to wait for a clear breakdown before entering the trade, as false breakdowns can occur. A significant increase in volume during the breakdown is often considered a strong confirmation signal.
**Limitations:**
- **False breakdowns:** Sometimes, the price may break below the support line temporarily and then reverse higher, causing a false breakdown
. It is essential to wait for a clear confirmation.
- **Market context:** While the descending triangle is a bearish pattern, it's important to consider the broader market context and analyze other indicators to confirm the likelihood of the pattern leading to a successful trade.
**In conclusion, understanding these triangle patterns can provide valuable insights into potential market movements. Traders should use them as part of their technical analysis toolkit and combine them with other forms of analysis to make well-informed trading decisions. Happy trading! 📈💹**
TCPLTP

📉 4 Common Bearish PatternsIn trading, a bearish pattern is a technical chart pattern that indicates a potential trend reversal from an uptrend to a downtrend. These patterns are characterized by a series of price movements that signal a bearish sentiment among traders.
📍Bear Flag
🔸 A small rectangular pattern that slopes against the preceding trend
🔸 Forms after a rapid price decline (flagpole)
🔸 The pattern is completed when the price breaks below the lower trend line of the flag
📍Descending Triangle
🔸 A bearish continuation pattern that forms with a horizontal support line and a descending trendline
🔸 Forms as the price reaches lower highs, while the lows remain at the same level
🔸 The pattern is completed when the price breaks below the horizontal support line
📍Rising Wedge
🔸 A bearish reversal pattern that forms with a series of higher highs and higher lows
🔸 The pattern forms as the price moves up in a narrowing range
🔸 The pattern is completed when the price breaks below the lower trendline
📍Triple Top
🔸 A bearish reversal pattern that forms with three peaks at the same price level
🔸 The pattern forms as the price reaches resistance at the same level multiple times
🔸 The pattern is completed when the price breaks below the support level, which connects the lows between the peaks
👤 @AlgoBuddy
📅 Daily Ideas about market update, psychology & indicators
❤️ If you appreciate our work, please like, comment and follow ❤️

0% Inflation very soon?United States Inflation Rate, Year-over-Year, 1914-2022 chart
----------------------------------------------------------------
Why do I think inflation will go down to 0%?
Inflation is currently at the main trendline (established in 1920). This is a very strong resistance, and as a general rule, do not short a support or long a resistance. In other words, you don't want to speculate on inflation increasing when inflation is at its critical point. FED cares about their charts, and they also want the charts to look great. That's why they will push inflation down.
----------------------------------------------------------------
Why the Inflation Rate Matter?
The inflation rate demonstrates the health of a country's economy. It is a measurement tool used by a country's central bank, economists, and government officials to gauge whether action is needed to keep an economy healthy. That's when businesses are producing, consumers are spending, and supply and demand are as close to equilibrium as possible.
A healthy rate of inflation is good for both consumers and businesses. During deflation, consumers hold on to their cash because the goods will be cheaper tomorrow. Businesses lose money, cutting costs by reducing pay or employment. That happened during the subprime housing crisis.
In galloping inflation, consumers spend now before prices rise tomorrow. That artificially increases demand. Businesses raise prices because they can, as inflation spirals out of control.
When inflation is steady, at around 2%, the economy is more or less as stable as it can get. Consumers are buying what businesses are selling.
----------------------------------------------------------------
How is inflation measured?
There are several ways to measure inflation, but the U.S. Bureau of Labor Statistics uses the consumer price index. The CPI aggregates price data from 23,000 businesses and 80,000 consumer goods to determine how much prices have changed in a given period of time. If the CPI rises by 3% year over year, for example, then the inflation rate is 3%. The Fed, on the other hand, relies on the price index for personal consumption expenditures (PCE). This index gives more weight to items such as healthcare costs.
----------------------------------------------------------------
How do you hedge against inflation?
Because inflation causes money to lose value over time, hedging against it is an important part of any sound investing strategy. Investors use a diversified portfolio with a variety of asset types to offset inflation and ensure that the overall growth of their portfolio outpaces it.
----------------------------------------------------------------
YEAR - INFLATION RATE YOY - FED FUNDS RATE - BUSINESS CYCLE (GDP GROWTH) - EVENTS AFFECTING INFLATION
1929 0.6% NA August peak Market crash
1930 -6.4% NA Contraction (-8.5%) Smoot-Hawley
1931 -9.3% NA Contraction (-6.4%) Dust Bowl
1932 -10.3% NA Contraction (-12.9%) Hoover tax hikes
1933 0.8% NA Contraction ended in March (-1.2%) FDR's New Deal
1934 1.5% NA Expansion (10.8%) U.S. debt rose
1935 3.0% NA Expansion (8.9%) Social Security
1936 1.4% NA Expansion (12.9%) FDR tax hikes
1937 2.9% NA Expansion peaked in May (5.1%) Depression resumes
1938 -2.8% NA Contraction ended in June (-3.3%) Depression ended
1939 0.0% NA Expansion (8.0% Dust Bowl ended
1940 0.7% NA Expansion (8.8%) Defense increased
1941 9.9% NA Expansion (17.7%) Pearl Harbor
1942 9.0% NA Expansion (18.9%) Defense spending
1943 3.0% NA Expansion (17.0%) Defense spending
1944 2.3% NA Expansion (8.0%) Bretton Woods
1945 2.2% NA Feb. peak, Oct. trough (-1.0%) Truman ended WWII
1946 18.1% NA Expansion (-11.6%) Budget cuts
1947 8.8% NA Expansion (-1.1%) Cold War spending
1948 3.0% NA Nov. peak (4.1%)
1949 -2.1% NA Oct trough (-0.6%) Fair Deal, NATO
1950 5.9% NA Expansion (8.7%) Korean War
1951 6.0% NA Expansion (8.0%)
1952 0.8% NA Expansion (4.1%)
1953 0.7% NA July peak (4.7%) Eisenhower ended Korean War
1954 -0.7% 1.25% May trough (-0.6%) Dow returned to 1929 high
1955 0.4% 2.50% Expansion (7.1%)
1956 3.0% 3.00% Expansion (2.1%)
1957 2.9% 3.00% Aug. peak (2.1%) Recession
1958 1.8% 2.50% April trough (-0.7%) Recession ended
1959 1.7% 4.00% Expansion (6.9%) Fed raised rates
1960 1.4% 2.00% April peak (2.6%) Recession
1961 0.7% 2.25% Feb. trough (2.6%) JFK's deficit spending ended recession
1962 1.3% 3.00% Expansion (6.1%)
1963 1.6% 3.5% Expansion (4.4%)
1964 1.0% 3.75% Expansion (5.8%) LBJ Medicare, Medicaid
1965 1.9% 4.25% Expansion (6.5%)
1966 3.5% 5.50% Expansion (6.6%) Vietnam War
1967 3.0% 4.50% Expansion (2.7%)
1968 4.7% 6.00% Expansion (4.9%) Moon landing
1969 6.2% 9.00% Dec. peak (3.1%) Nixon took office
1970 5.6% 5.00% Nov. trough (0.2%) Recession
1971 3.3% 5.00% Expansion (3.3%) Wage-price controls
1972 3.4% 5.75% Expansion (5.3%) Stagflation
1973 8.7% 9.00% Nov. peak (5.6%) End of gold standard
1974 12.3% 8.00% Contraction (-0.5%) Watergate
1975 6.9% 4.75% March trough (-0.2%) Stop-gap monetary policy confused businesses and kept prices high
1976 4.9% 4.75% Expansion (5.4%)
1977 6.7% 6.50% Expansion (4.6%)
1978 9.0% 10.00% Expansion (5.5%)
1979 13.3% 12.00% Expansion (3.2%)
1980 12.5% 18.00% Jan. peak (-0.3%) Recession
1981 8.9% 12.00% July trough (2.5%) Reagan tax cut
1982 3.8% 8.50% November (-1.8%) Recession ended
1983 3.8% 9.25% Expansion (4.6%) Military spending
1984 3.9% 8.25% Expansion (7.2%)
1985 3.8% 7.75% Expansion (4.2%)
1986 1.1% 6.00% Expansion (3.5%) Tax cut
1987 4.4% 6.75% Expansion (3.5%) Black Monday crash
1988 4.4% 9.75% Expansion (4.2%) Fed raised rates
1989 4.6% 8.25% Expansion (3.7%) S&L Crisis
1990 6.1% 7.00% July peak (1.9%) Recession
1991 3.1% 4.00% Mar trough (-0.1%) Fed lowered rates
1992 2.9% 3.00% Expansion (3.5%) NAFTA drafted
1993 2.7% 3.00% Expansion (2.8%) Balanced Budget Act
1994 2.7% 5.50% Expansion (4.0%)
1995 2.5% 5.50% Expansion (2.7%)
1996 3.3% 5.25% Expansion (3.8%) Welfare reform
1997 1.7% 5.50% Expansion (4.4%) Fed raised rates
1998 1.6% 4.75% Expansion (4.5%) LTCM crisis
1999 2.7% 5.50% Expansion (4.8%) Glass-Steagall repealed
2000 3.4% 6.50% Expansion (4.1%) Tech bubble burst
2001 1.6% 1.75% March peak, Nov. trough (1.0%) Bush tax cut, 9/11 attacks
2002 2.4% 1.25% Expansion (1.7%) War on Terror
2003 1.9% 1.00% Expansion (2.9%) JGTRRA
2004 3.3% 2.25% Expansion (3.8%)
2005 3.4% 4.25% Expansion (3.5%) Katrina, Bankruptcy Act
2006 2.5% 5.25% Expansion (2.9%)
2007 4.1% 4.25% Dec peak (1.9%) Bank crisis
2008 0.1% 0.25% Contraction (-0.1%) Financial crisis
2009 2.7% 0.25% June trough (-2.5%) ARRA
2010 1.5% 0.25% Expansion (2.6%) ACA, Dodd-Frank Act
2011 3.0% 0.25% Expansion (1.6%) Debt ceiling crisis
2012 1.7% 0.25% Expansion (2.2%)
2013 1.5% 0.25% Expansion (1.8%) Government shutdown. Sequestration
2014 0.8% 0.25% Expansion (2.5%) QE ends
2015 0.7% 0.50% Expansion (3.1%) Deflation in oil and gas prices
2016 2.1% 0.75% Expansion (1.7%)
2017 2.1% 1.50% Expansion (2.3%)
2018 1.9% 2.50% Expansion (3.0%)
2019 2.3% 1.75% Expansion (2.2%)
2020 1.4% 0.25% Contraction (-3.4%) COVID-19
2021 7.0% 0.25% Expansion (5.9%) COVID-19
2022 8.3% 3.25% Contraction (-1.6%) As of Sept. 21. 2022
2023 2.7% (est.) 2.8% (est.) Expansion (2.2%) March 2022 projection

How To Trade The Descending TriangleDraw line touching the lower highs which is the negative slope trend line. Draw horizontal level connecting equal highs. The horizontal level is a zero slope line.
Wait for a convincing close below the horizontal level.
This is a convincing close below the horizontal level. Draw the fib from the previous lower high touching the diagonal trend line. In this case, it is the the third lower high. The result is the 50% Fibonacci Retracement Level overlaps the Horizontal Level a little bit. That overlap is a confluence factor. Now wait for price to pull back to the 50% Retracement Level.
Price pulled back to the 50% Fibonacci Retracement Level, Horizontal Level, EMA 10 Level, and EMA 20 Level.
Set Measured Objective Target Using the Height of the Pattern.
Enter when the bear candles closes near 50% Fibonacci Retracement Level, Horizontal Level, EMA 10 Level, and EMA 20 Level. I would like to see a bearish price action signal at this level like a pin bar, rejection candlestick, or engulfing bar. This candlestick is not a engulfing bar on the 4H time frame, but it is still good enough for me to trade it. Price pulled back to the levels and produced a wick through the horizontal level. Price never closed above the horizontal level. If price closed above the horizontal level, then discard the trade idea.

Chart Patterns | Triangles & ChannelsChart Patterns | Triangles & Channels
1- Ascending Triangle :-
An ascending triangle is a type of triangle chart pattern that occurs when there is a resistance level and a slope of higher lows.
2- Descending Triangle :-
In descending triangle chart pattern, there is a string of lower highs that forms the upper line. The lower line is a support level in which the price cannot seem to break.
3- Symmetrical Triangle :-
A symmetrical triangle is a chart formation where the slope of the price’s highs and the slope of the price’s lows converge together to a point where it looks like a triangle.
4- Parallel Channel :-
A Parallel Channel is a chart pattern formed when the price is bounded by parallel support and resistance levels.
5- Ascending Channel :-
An ascending channel is a chart pattern formed from two upward trend lines drawn above and below a price representing resistance and support levels.
6- Descending Channel :-
A descending channel is a chart pattern formed from two downward trendlines drawn above and below a price representing resistance and support levels.
Please like the idea for Support & Subscribe for More ideas like this and share your ideas and charts in Comments Section..!!
Thanks for Your Love & Support..!!

Descending Triangle Patternhe descending triangle pattern is one of the top continuation patterns that appear in the middle of a trend. Traders anticipate the market to continue in the direction of the bigger trend and accordingly develop trading setups.

📚Trading Lesson. Triangle Types & How to Read Them📚
Triangle is a classic price action pattern that is applied by technical analysts to make predictions trading different financial markets.
Depending on the shape of the triangle, there are three main variations of this pattern.
Its meaning changes dramatically from one to another so it is crucially important for you to know the difference.
👉 The symmetrical triangle is determined by two contracting trend lines.
The pattern is considered to be indecisive meaning that while the market is stuck within, the directional bias is unknown.
Only the breakout of a boundary of a triangle clarifies the future direction.
👉 In contrast, the ascending triangle (also called a bullish accumulation) is a classic example of a bullish biased pattern.
With a horizontal trend line serving as resistance and a rising trend line service as support, the market is accumulating volumes for a bullish breakout.
Once the horizontal resistance is broken, bullish continuation follows.
👉 The descending triangle is a bearish biased pattern. Also called a bearish accumulation, the pattern indicates the preparation of the market participants to set a new low after consolidation and contraction within a triangle.
Once the horizontal support is broken, bearish continuation follows.
🔔Please, support this educational post with a lovely comment and like.
Also, subscribe to our page for more educational posts & signals.🔔

👨🏫 Continuing Pattern: ✅ Triangles👀Triangles are among the most reliabiable of the continuation pateerns. There are 3 types of Triangles with forcasting value.
Ascending Triangles
Descendung Triangles
Symmentrical Triangle

GOLD & THE TUESDAY NIGHT? WINS STOCK MARKET RALLY
? WINS STOCK MARKET DOWNTURN
NO WINNER TONIGHT STOCK MARKET SEVERE DOWNTURN
BECAUSE STOCK MARKET DOES NOT LIKE UNCERTAINTY.
Descending Chart Pattern
Price Bias is Bearish
While gold has an inverse relationship with the dollar, stocks markets also have a deep connection to the metal.
Investors commonly perceive gold as a haven in the event of a severe stock market downturn. ...
Typically, stocks have a high negative correlation with the US dollar .
However, gold has an opposite relationship.

Psychology behind Ascending and Descending Triangles PatternJust as with ascending triangles, most of the times, the price will break the horizontal support line, and continue with the move lower.
there is usually psychology behind every chart pattern ; and ascending and descending triangles are no exception.
Follow me closely as we will now ‘investigate’ the PSYCHOLOGY behind ascending triangles :
To make the analysis easier, let’s think of the ascending triangle pattern as a visualization of an ongoing battle between the bulls (#buyers) and the bears (#sellers).
The bulls keep pushing the stock up in price until they get overpowered by the bears/sellers at the horizontal resistance level.
It is at that resistance level that bears/sellers attempt to push the price down.
Though sellers are somehow successful in pushing the price down, they are however unable to push the price to the previous low levels, as bulls/buyers are persistent, and the price sets a higher low (bottom trend line).
This pattern continues until the price action becomes confined to the vertex of the triangle, representing a pivotal moment in this battle. At this point, either the bears will win, and the stock will break the bottom trend line, or the bulls will win and break the horizontal resistance line.
If history is anything to go by, this pattern favors the bulls, and if the horizontal resistance line is broken, the bulls will be able to push the price up, triggering a breakout.
This same psychology also applies to descending triangles, but in reverse .
Now let’s looks at how we can to make money from this chart pattern:
1. Wait for the Breakout –we should wait price to break above the horizontal resistance line before placing a trade.
2. Lookout for Volume – High volume usually represents conviction behind a move, indicating that a large number of traders want a position in the stock. While above average volume is not necessary for an ascending triangle pattern breakout, it may increase the likelihood of a stronger move.
3. Look for Confirmation – If an ascending triangle breakout is genuine, the flat line resistance level should become a support level. If the stock starts to pullback after the breakout, you should look for the previous resistance level to hold as support. This will help confirm the legitimacy of the breakout. It also allows traders who missed the initial move to take a position
4. Have an Exit Plan – All trades require an exit plan for both favorable and unfavorable outcomes.
For ascending triangles, Stop loss should typically be placed just below the previous horizontal resistance (which will now be acting as support).
Thanks for Your Likes & Support & Subscribe....

THE ASCENDING AND DESCENDING TRIANGLE CHART PATTERN
Ascending triangles are classified as continuation Patterns . Here are the key elements that make up an ascending triangle:
1. Bottom Trend Line(Support) – An ascending triangle is characterized by a bottom trend line that is formed as the price continues to set higher lows. The more touch points on the trend line, the more reliable it will be.
2. Horizontal Resistance Line – An ascending triangle also contains a flat horizontal resistance line that is formed as the stock continues to reject its previous highs (for a given period). Once again, the more touch points on the resistance line, the more reliable the pattern will be.
You must be wondering how the chart pattern get to be formed?
What happens during the formation of an ascending triangle is that there is a certain level that the buyers cannot seem to break ( red resistance line ).
However, as evidenced by the higher lows ( green uptrend support line ), buyers will gradually push the price up, hence we end up with an uptrend of higher lows.
As buyers and sellers keep putting pressure, a breakout will become inevitable.
Though a price breakout is inevitable, the big question is, “ Who will break the price, buyers or sellers? Will the buyers be able to break that resistance level, or will the resistance be too strong?”
Well, the answer is, most of the times the price will break the resistance area and go up.
However, it is not always the case, sometimes, the resistance is too strong for buyers to break.
Now let’s look at its inverse, the DESCENDING TRIANGLE CHAT PATTERN
In a descending triangle chart pattern, as can be seen on the BTCUSD chart above, there is a string of lower highs which forms the upper line (red resistance line). The lower line is a support area (green horizontal line) in which the price seems to be failing to break.
Just as with ascending triangles, most of the times, the price will break the horizontal support line, and continue with the move lower.
Follow me closely as we will now ‘investigate’ the PSYCHOLOGY behind ascending triangles:
To make the analysis easier, let’s think of the ascending triangle pattern as a visualization of an ongoing battle between the bulls (buyers) and the bears (sellers).
The bulls keep pushing the stock up in price until they get overpowered by the bears/sellers at the horizontal resistance level.
It is at that resistance level that bears/sellers attempt to push the price down.
Though sellers are somehow successful in pushing the price down, they are however unable to push the price to the previous low levels, as bulls/buyers are persistent, and the price sets a higher low (bottom trend line).
This pattern continues until the price action becomes confined to the vertex of the triangle, representing a pivotal moment in this battle. At this point, either the bears will win, and the BTC will break the bottom trend line, or the bulls will win and break the horizontal resistance line.
If history is anything to go by, this pattern favors the bulls, and if the horizontal resistance line is broken, the bulls will be able to push the price up, triggering a breakout.
Thanks for Your Likes & Support & Subscribe....

Descending Triangle as Continuation and Bilateral patternDescending Triangle Pattern Tutorial :
Descending Triangle is a bearish pattern and sometimes it also act as bilateral pattern. (about bilateral pattern in the previous post : "https://www.tradingview.com/chart/BTCUSDT/vYen5wAu-Ascending-Triangle-as-Continuation-and-Bilateral-pattern/")
A Descending Triangle Pattern can be easily identified if you see a falling upper trendline along with a flat support. Also descending triangle have some shortcomings like it can occur false breakout and the price reverses same as Ascending Triangle. You need to see how strong the breakout was with the help of volume indicator at the time of breakout.

Descending TriangleLooks like Ethereum just broke the descending triangle. My personal targets are between 100-110 due to strong support/psychological support, though we may see some bounces as we go down. Fast capitulation of the market would be a more bullish indicator for me as it indicates less manipulation and less attempts at whip-lashing retail traders.

APEX and RippleHello fellas, Here it is I represent to you my view about Ripple.
Based on the technical analysis, I found an important pattern which forms a descending type of the triangle. But, once again I remind you that even the descending triangle which usually indicate a bearish pressure, it has a potential to make it a failure too. However, I only see that currently the price for ripple has already trended in the APEX of this huge triangle on weekly chart. These are the 2 scenarios :
1. Break out of the resistance trend line : will lead the price to $0.47 or even $0.87 in mid term
2. Break down of the support line : will lead the price to form new low in 2019 around $0.14
Thank you

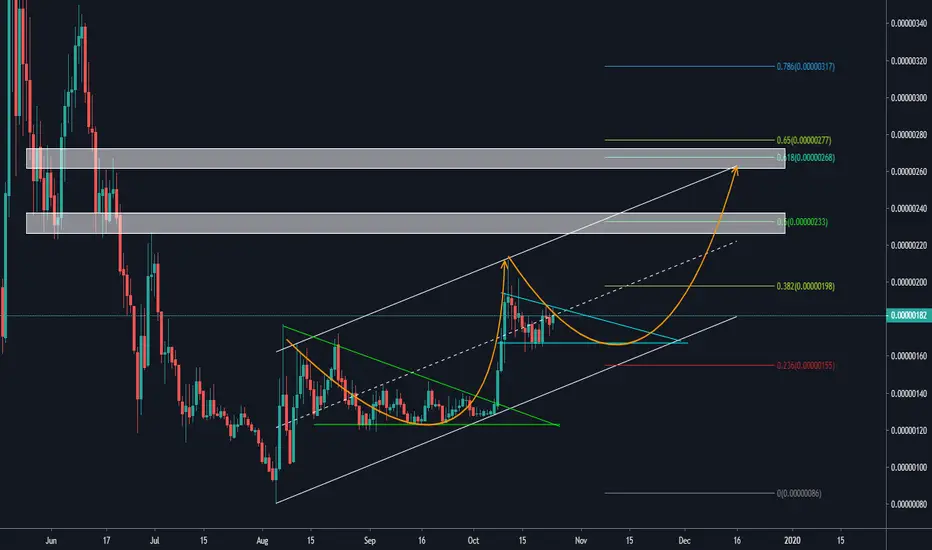
Matic network with possible 50% gain on SWINGThis is a quick update analysis about some of altcoins which have a good potential to grow and produce a possible huge profit in the near future. Let's do the technical analysis.
History is repeating itself is the most suitable quotes on MATIC here. we can see a similar pattern with previous structure in this huge up trend channel. we see a failure descending triangle which it broke to the upside. And in this current move, there is a possibility of it to repeating this previous pattern. A series of higher high and higher low can be a good reason for me to enter this trade.
If the price breaks out of the upper line of the triangle, I will enter the position and targeting the upper line of the huge up trend channel. 2 potential target that have the alignment with the previous price action is at around 230 and 270.
Watch out and let's be rich together.
ALXN - Monthly chart storyNote : Pharma cos can remain bearish/ bullish for extended time frames as a lot of the movement is based on future expectations and trials.
NASDAQ:ALXN has been in the descending triangle and has nicely tested support levels as indicated in the chart. Lovely similar formations on RSI and OBV, both confirming the downward trends
Descending triangles are bearish formations and if you look at the charts closely, most of the monthly, actually nearly all the monthly closes are below the 50 Day (to be read in this case as 50 period) moving average, again no respite as bearish.
The strategy here could be as follows
1. Ideal way would be to wait for breakout and sell when the support is breached
2. In case you want to Sell, then do as at the top of the triangle once it is rejected at the resistance level....
3. In case you had conviction on this pharma company, then Buy near supports when it bounces and retests the support zone and back in the triangle (this can be very dangerous as the formation is bearish)
If you like what you see, please share a thumbs up and your views in the comment section
Cheers

Bitcoin : End of the week, consolidation is in playHappy Saturday all, welcome back with me in this newest update about bitcoin. let's check it out!
If you remember about 2 methods of connecting the trend line, there are wick to wick and the body to body connecting method. Personally, I am more interested in using the body to body connecting method because it will exclude the bull/bear trap region and exclude the possible manipulative region for the crypto asset. But, once again it is still very subjective and a personal judgement that works based on case by case occur.
In this case, which I use the daily time frame to find a possible trend line, I use the body to body connecting method and I find a descending triangle is forming on current price pattern. As we know, the descending triangle usually end up bearish in most of the price pattern. But, in this level and circumstance I really recommend you to wait more for the confirmation to enter any position. There are several example of a failure descending triangle that is bullish, that's why a break out to both side is expected and I will stay neutral on middle term.
In overall, after a huge drop on September 23rd and 24th, the price forms a triangle pattern that usually is a consolidation pattern for the moves. This pattern is still normal and very ideal. Waiting is gold now for bitcoin.
For altcoins, I've seen some candidates to be a hype in crypto universe but, still confirmation is the most crucial thing to wait.
