Smart Money Liquidity Trap Explained⭐ Smart Money Liquidity Trap Explained
✨ A deep dive into how institutions manipulate price before major moves ✨
In every financial market — Forex, Crypto, Stocks, Indices — price doesn’t simply move at random. Behind the scenes, Smart Money (institutions, banks, hedge funds) engineer setups that allow them to enter positions at the best possible price. One of their most effective tools is the Liquidity Trap.
Let’s break it down beautifully and clearly. 👇
🔥 What Is a Liquidity Trap?
A Liquidity Trap occurs when Smart Money deliberately pushes price into areas loaded with:
❌ Stop-loss orders
📉 Sell-side liquidity
📈 Buy-side liquidity
😰 Emotional retail entries
🔥 Breakout traders placing pending orders
These areas become liquidity pools — perfect fuel for institutions to fill their massive positions.
Retail traders think it’s a breakout…
But Smart Money thinks:
➡️ "Thank you for the liquidity."
🧩 How Smart Money Creates the Trap
1️⃣ Phase 1: Build the Setup
Smart Money guides price slowly toward an obvious level:
A clean high
A clean low
A trendline
A double top/bottom
Retail traders get excited:
📢 “Breakout coming!”
But institutions are simply gathering attention.
2️⃣ Phase 2: The Liquidity Grab ⚡
Price spikes violently above/below the obvious level.
This move triggers:
🟥 Stop-loss hunts
📉 Forced liquidations
💥 Breakouts that fail instantly
This sudden spike gives institutions the liquidity needed to place large buy or sell orders without causing massive slippage.
This is why the spike is often fast and dramatic.
3️⃣ Phase 3: The Real Move Begins 🚀
After the liquidity is collected, price reverses sharply.
This is the moment Smart Money actually commits to the real direction.
Retail traders feel:
🤯 “Why did it reverse?!”
😭 “I got stopped out for nothing!”
😵 “The breakout was fake!”
But Smart Money simply executed their strategy perfectly.
🎯 How to Use Liquidity Traps in Your Trading
Study where retail traders commonly place:
⛔ Stops
📌 Breakout orders
❗ Predictable entries
Then wait for the fast liquidity grab followed by:
A displacement 🎇
A sharp wick rejection
A structure shift (CHoCH / BOS)
These signals often reveal the true direction of the upcoming move.
💡 Key Features of a Smart Money Liquidity Trap
✨ Sudden spike into obvious areas
✨ Fast liquidation and stop-hunting behavior
✨ Sharp wick rejections
✨ Structure shift after the spike
✨ Smooth continuation in the real direction
🚀 Why This Concept Is So Powerful
Recognizing liquidity traps allows you to:
❌ Avoid fake breakouts
🛡️ Protect yourself from stop-hunts
🎯 Enter the market at premium/discount levels
🤝 Align with Smart Money
💼 Improve long-term consistency
This is how professional traders stay on the right side of volatility — by understanding why the market moves, not just where it moves.
Community ideas
Understanding Forex Money Flow: Risk-on & Risk-offWhen it comes to Forex, most traders focus on technicals, chart patterns, or indicators. But “money flow” — the force that truly moves price — is often overlooked. If you want to read the market like a pro, you must understand Risk-on and Risk-off: the two sentiment states that drive global capital.
Today, let’s break them down clearly, practically, and in a way you can apply immediately.
🔥 What Is Risk-on?
“Risk-on” appears when the market is optimistic, investors seek risk, and money flows strongly into high-return assets.
Signals of a Risk-on Environment:
Strong stock market rallies
Capital shifts into riskier assets
Bond yields rise
Positive economic news or geopolitical easing
Assets That Benefit in Forex:
AUD, NZD, CAD (commodity currencies)
GBP, EUR (when the economy is stable)
Bitcoin, oil, and equities also tend to rise
Risk-on = “The market is excited → money flows into high-yield assets”.
💥 What Is Risk-off?
“Risk-off” occurs when the market fears uncertainty, causing money to move toward safe-haven assets.
Signals of a Risk-off Environment:
Stock markets fall sharply
Money exits risky assets
Gold spikes
USD and JPY strengthen
Negative economic news, war, inflation, or political instability
Assets That Benefit in Forex:
USD, JPY, CHF
Gold (XAUUSD)
U.S. government bonds
Risk-off = “The market is scared → money runs to safety”.
❓ Why Forex Traders MUST Understand Risk-on / Risk-off
No matter what indicator you use, the market ultimately reacts to major capital flow.
Understanding these two states helps you:
Trade with market sentiment → dramatically increases win rate
Avoid entering trades against the money flow → fewer “pointless stop-loss hits”
Identify strong/weak currencies → choose high-probability setups
Many perfect technical setups fail simply because they go against global money flow.
📌 How to Apply This Immediately in Your Forex Trading
1. Check the News → Identify Sentiment
Good news? Strong GDP? Stable markets? → Risk-on
Bad news? War? Inflation? Hawkish Fed? → Risk-off
2. Compare Currency Strength
Simple formula:
Risk-on → prioritize BUY AUD, NZD, CAD
Risk-off → prioritize BUY USD, JPY, CHF
3. Follow the Trend — Avoid Fighting Money Flow
The strongest trends often come from shifts between Risk-on and Risk-off.
Examples:
Bad news → JPY strengthens → XXXJPY pairs fall hard
Risk-on returns → USD weakens → gold rises quickly
Follow the money flow, and you’re already ahead of 80% of traders.
🧠 Conclusion – If You Want to Trade Smart, Trade With the Money Flow
Risk-on and Risk-off aren’t just theory — they’re the compass that reveals market psychology, which is the foundation of every trend.
Want to trade like Smart Money?
→ Watch where the money is moving, not just where the candles are going.

Don't Trade These Trend Lines. Forex Gold Trading Basics
A lot of traders apply trend lines for trading and making predictions on different financial markets.
Trend line can also be an important element of price action patterns.
However, only few knows that some trend lines are better to be avoided .
In this article, I will share with you the types of trend lines that you should avoid and not rely on for making trading decisions.
Invalidated Trend Line
Even the strongest trend lines may lose their significance with time.
Before you take a trade from a trend line, make sure that it still remains valid.
If the trend line is not respected by the buyers and then by the sellers,
or by the sellers and then by the buyers, we say that such a trend line lost its significance, and it is better to not trade it.
Have a look at that rising trend line on USDCAD.
We see strong bullish reactions to that, and we may expect a bullish movement from that, once it is tested.
However, it was violated and after a breakout it should turn into a vertical resistance.
Retesting that, the price easily went through the broken trend line.
The trend line lost its significance, and it is better to not trade that in the future.
2 Touches Based Trend Line
When you are looking for a strong trend line to trade, remember that the trend line should be confirmed by at least 3 touches and 3 consequent bullish / bearish reactions to that.
Above is the example of a valid and reliable trend line.
However, quite often, newbie trade 2 touches based trend lines.
Most of the time, such trend lines are neglected by the market.
Moreover, relying on 2-touches-based trend lines, your chart will look like a complete mess .
Simply because there are too many trend line meeting that criteria.
Receding trend line
There are the trend lines that go against your trade with time while remaining valid.
Have a look at a major falling trend line on NZDCHF on a daily time frame.
You may open a swing long position from that on a daily or a day trade on intraday time frames like an hourly.
You can see that the market may easily go against your predictions for a long time, while perfectly respecting a trend line.
The price was sliding on that trend line for 6 consequent days before it finally started to grow.
Such trend lines are better to be avoided .
Make sure that a trend line and your trade have the same direction.
Trend lines can provide very safe points for trading entries. However, the trend lines are not equal and while some of them can be very profitable, some of them can lead to substantial losses.
❤️Please, support my work with like, thank you!❤️
I am part of Trade Nation's Influencer program and receive a monthly fee for using their TradingView charts in my analysis.

I am right. Emotional traps in tradingVery often I catch myself thinking before opening a trade that I want to be right about the chosen direction. The first thought is not even about how much I can earn, but that it feels nice to be right, nice when the market confirms the chosen direction — that warm and pleasant feeling of a life-winner who takes control into their own hands. Sometimes I think that the overwhelming majority of traders came to the market not for money, but for this very feeling of being right, being competent and important. And opening a trade from this point is an emotional trap that eats up our deposits. Let’s figure out why and how to fix it.
Let’s start with what happens before opening a trade, when we come to the market to prove that we are right. You’ve surely seen such posts, and maybe even wrote them yourself, like “I told you so!”. This often happens with beginners in trading, because in the beginning, by the laws of the genre, the price often goes in the direction of the beginner, and it seems more and more to them that they’ve cracked the market, are always right and cannot be wrong. Before opening a trade in such a case there appears the emotion of happiness in anticipation of that cozy feeling of being right.
Usually the trader starts thinking and saying phrases like:
I know where the price will go
The price will be 1000 in a week
Save this post/tweet
I’ve always been right and now too, you’ll see
I’m telling you for sure the price will be 500 in 4 hours
This is the bottom/reversal point/top, from here we will go this way
If you recognize similar patterns and use them as a signal to open a trade, I have bad news for you. The moment will come when “I am right” inside one single trade will take away your whole deposit, and maybe not just one. You will never forget that dull pain somewhere in the chest after this. It usually pushes 95% of beginner traders out of the market, because after “I am right” doesn’t work, they usually say:
It’s all whales manipulating
It’s the exchange’s fault
It’s the president who is wrong
Technical analysis doesn’t work
Trading is a casino and you can’t make money here
It’s all a scam
“I am right” can even lead to very sad consequences. This is a psychological trap not of the market, but of our own perception of ourselves and what a trade is.
What a trade is NOT
A trade is not you
A trade is not a tool for proving anything to the market
A trade is not a toy for when you’re bored
A trade is not an enemy
A trade is not something that will never happen again
A trade is not a bet of your whole deposit on black
A trade is not a wife/husband — no need to cling to it
When we trade based on the signal “I am right”, we trade “I want validation”, “I want to prove that I’m smart”, “I want approval, recognition, and applause”, “I want to feel control”. Control is an important component. You cannot control the market in order to always be right, but you can control yourself, your risks and your trade management — not from the position “I want to be right”, but from the position “I want to see the result, any result”.
Why “being right” is dangerous
You start holding losing trades.
Because admitting a loss = admitting your mistake.
And the ego hates that.
You sit through drawdowns.
Not because it’s part of the strategy, but because you want to prove to the market, to yourself or to the world:
“I was right from the beginning.”
You don’t take profit.
Because you’re waiting for the perfect point to prove:
“Look, I caught the exact top/bottom!”
As a result, the pullback eats most of the profit.
You lose flexibility.
And flexibility is the only thing that gives a trader survival.
Why does the desire to be right appear?
The desire to regain control when a trade goes against us — at such a moment we see nothing but the chart, because a burning desire appears to pull the trade back to our entry. So we wait, increasing the loss, instead of admitting that we are NOT right and taking the loss.
The fear of making a mistake, admitting that no one knows the future and that it is normal to make mistakes — treating mistakes as a curse, not as part of the learning path, a normal and natural part.
When we were shamed for mistakes, and now shame doesn’t allow us to admit that I am NOT right, and that this is normal. This goes deeply back to childhood — you need to dig into your patterns and programs.
Perfectionism, which, like corrosion, always eats through everything. The world is NOT perfect, everyone makes mistakes, and nothing and no one can do something without first learning how to be NOT right.
The desire to be noticed. I’m right, I guessed the market direction, I got approval; I didn’t guess — I didn’t get it. Self-esteem is what you need to start with in trading — learning to praise yourself, finding the source of validation inside.
The illusion of others being right. This is a real scourge of our social-media age — the perfect picture of profit screenshots, but usually we don’t publish blown accounts. Why? Because being NOT right and admitting it — that is the level of a pro and a transition to a higher stage of your own psycho-emotional state.
What actually causes the desire to be right?
Short answer:
✔️ Fear of being wrong
✔️ Fear of shame
✔️ Fear of losing control
✔️ Fear of being “not enough”
✔️ Dependence on external validation
✔️ Childhood traumas of “idealness” and “rightness”
✔️ Broken inner support: “I must not make mistakes”
✔️ Undifferentiated ego: mistake = I am bad
So how do you get rid of the desire to be right?
I think you can’t get rid of it, but you can notice it and transform it.
Practice #1: Mark the “ego moment”
As soon as thoughts appear:
“I know, it will reverse”
“It just can’t keep going like this…”
“I’ll get back to breakeven and close”
“I just couldn’t be wrong”
Practice #2: Micro-stops on the emotional level
Not only technical stop-losses.
Set emotional stops:
accelerated heartbeat
the feeling “I must wait”
fear of closing
the desire to prove
Practice #3: A phrase that cuts off the ego
When the fight for “rightness” begins, tell yourself:
“My task is to protect capital, not my pride.”
Also write down reminders and put them somewhere visible:
“I’m okay even when I’m wrong.”
“I am not the trade.”
“I’m saving the deposit, not the trade.”
“I can change my mind and that’s normal; no one knows the future.”
“I don’t need to be right to make money.”
“I’m okay. A trade is just a trade, there will always be another one.”
Do you fight for your rightness? Or are you okay being wrong?

Why 90% of Traders Blow Their Account?-And How to NEVER Be One!What is Risk Management? ⚠️
In trading, it means evaluating, measuring, and reducing potential losses , while capital management focuses on preserving and growing your capital. The main goal is to ensure that even if several trades turn out to be losers, your entire account doesn't get wiped out. For example, always ask yourself before entering a trade: "How much am I willing to lose?" ❓ This helps maintain your trading psychology 🧠 and prevents emotional decisions 🚫.
Practical Risk Management Techniques:
Using Stop-Loss and Take-Profit : Always set a stop-loss 🛑 so the trade closes automatically if the market moves against you. Also, use trailing stops to adjust the stop as the market moves in your favor and lock in more profits 💹.
Position Sizing : Never risk more than 1-2% of your total capital on a single trade. For example, if your account is $10,000, risk a maximum of $100-200 💸. This is called the "2% rule" and helps keep your capital safe even after several consecutive losses 🔄.
Risk-Reward Ratio : Always aim for at least 1:2 – meaning for every 1 unit of risk, target 2 units of potential reward. For example, if you risk $100, aim for at least $200 in profit. This way, even if only 50% of your trades win 🏆, you'll still come out profitable overall.
Diversification : Spread your capital across different markets (like forex, crypto, and stocks) to ensure that risk in one market doesn't impact everything else. For example, allocate 30% to stocks 📊, 40% to forex 💱, and 30% to crypto 🪙.
⚠️This post is for educational purposes only.⚠️
What’s YOUR biggest risk management rule? Drop it in the comments!👇

Spot + Hedge — The Fundamental Framework for Investors Who TradeYou don’t have to treat holding and trading as two separate worlds. The most effective market participants combine both. They anchor their strategy in long-term conviction while using short-term tools to manage volatility and protect capital. This balance allows them to participate in structural growth without exposing their portfolio to unnecessary drawdowns.
Spot holdings are the foundation. A well-built spot position compounds through cycles, absorbs volatility, and benefits from every wave of adoption that pushes the market forward. Staking adds an additional layer by generating yield during periods of consolidation. For traders who think in cycles rather than days, spot is the engine that keeps building value in the background.
A hedge position serves a different purpose. It is not designed for aggressive speculation. It is a tactical layer that reduces exposure when conditions become unstable. Futures shorts, when sized properly, act as a defensive tool that preserves the value of your long-term assets without forcing you to sell them. This approach keeps you invested while giving you room to breathe during sharp corrections.
When hedging makes sense:
– After a strong rally pushing into major resistance levels.
– When funding rates are extremely positive and the market is crowded with leveraged longs.
– When macro data shifts, liquidity tightens, or a regulatory event increases uncertainty.
– When your portfolio has grown significantly and you want to lock in part of that increase without taking profits.
The purpose of the hedge is stability. You are not aiming to turn the short into a profit engine. You are using it as portfolio insurance. A well-timed hedge limits the damage during pullbacks and keeps you positioned for the next leg of the cycle.
Simple implementation example: assume you hold $20,000 of ETH spot as your long-term allocation. To hedge, you short 25–30 percent of the position using ETH perpetual contracts. If ETH drops 10 percent, the hedge cushions the downside by generating gains on the short. If ETH continues rising, your spot position captures the upside and the hedge becomes the cost of protection, similar to an insurance premium.
This framework helps traders stay in the market, avoid emotional exits, and preserve capital during volatile periods. It combines conviction with discipline and gives long-term holders a practical way to navigate uncertainty without breaking their overall strategy.

3 Option Strategies✅ 1. 0-DTE Iron Fly (ATM Iron Butterfly)
The 0-DTE Iron Fly — selling an at-the-money straddle and buying wings for protection — is the most powerful theta-harvesting strategy in same-day options trading. Its core edge derives from the extraordinary rate of time decay at the money. ATM options experience the fastest gamma and theta changes, and within hours of expiration, their value collapses dramatically if price remains relatively stable.
An iron fly sells both the ATM call and ATM put, while purchasing further OTM wings to cap risk. This creates a defined-risk straddle, turning unlimited risk into a predictable maximum loss. Because you are collecting the highest premium on the chain (the ATM options), this strategy often yields 3–20× more credit than bull put spreads.
Professionals use iron flies on days where the market is expected to consolidate, remain rangebound, or collapse in implied volatility. The setup excels after large overnight moves, strong gap opens, or major news the previous day. These conditions often produce morning chop followed by volatility compression — the exact environment that crushes ATM premiums.
Key Greek behavior defines this strategy’s edge. The position is delta-neutral, vega-negative, and theta-maximizing. A neutral delta means you’re not betting directionally — any sideways action generates rapid profit. The negative vega means falling IV immediately boosts your P&L, and the extraordinarily high theta means the position decays in your favor every minute, especially after 11 AM ET.
However, gamma is the double-edged sword. ATM options have the highest gamma, meaning price moving too far too fast can rapidly eat into the credit and even create maximum loss conditions. For this reason, institutional traders manage iron flies aggressively using time-based exits, gamma stops, and dynamic hedging using micro futures (MES, ES, or SPX futures). They often hedge intraday with small futures positions to flatten delta.
A well-built iron fly has wings positioned at 15–30 delta, balancing risk and credit. The payoff is largest when price finishes near the ATM strike. Closing early—especially when you’ve captured 40–70% of the total credit—is standard practice. The trade is almost always exited before 2:00 PM ET to avoid the “gamma death zone,” where even minor price moves cause large swings.
Iron flies are best for traders with mechanical discipline, strong understanding of intraday volatility patterns, and the ability to manage delta quickly. When executed correctly in calm or mean-reverting markets, the iron fly is the most profitable theta-capture strategy in the entire 0-DTE universe.
Why it’s the best?
Highest theta concentration (ATM options decay the fastest).
Very tight structure → excellent gamma control.
Collects huge premium → offsets intraday noise.
You can define risk precisely.
When to use?
Low–moderate volatility mornings
Rangebound price action
Strong liquidity in SPX, narrow bid–ask
Typical setup:
Sell ATM call + ATM put
Buy wings ±15–30 points
Hold 1–2 hours, manage delta
Stats:
Win rate often 60–75%
Avg R:R 1:0.6 to 1:0.8
Excellent for consistency
✅ 2. 0-DTE Bull Put Spread (BPS)
The Bull Put Spread is the highest-probability and most stable 0-DTE income strategy used by SPX and XSP premium sellers. It involves selling a put that is out of the money and simultaneously buying another put further OTM to define risk. Its primary advantage lies in its exposure to positive theta, negative vega, and controlled gamma, making it ideal for days with orderly price action or bullish-to-neutral drift.
The core principle behind the bull put spread is simple: markets typically spend more time drifting upward or sideways than collapsing. 0-DTE options lose value extremely fast, particularly out-of-the-money options. By selling a 22–26 delta put and buying a 15–17 delta put, you position yourself in the zone where time decay works aggressively in your favor, and where IV crush after the open exponentially increases your probability of profit.
Professional traders rely on several metrics to select the correct strikes. First, the delta ratio between the short and long legs should be between 1.45–1.70. This ensures you're collecting enough premium for the risk while keeping gamma manageable. Next, the short-leg gamma must remain below threshold (0.045 for XSP, 0.015 for SPX), preventing sudden P&L swings late in the session. You also want net vega negative, so falling implied volatility benefits your trade, and net theta positive, so time decay improves your position.
Volume profile, expected move, skew, and opening volatility conditions guide entry timing. The best window tends to be 9:50–10:20 AM ET, after the initial volatility shock has normalized. Avoid entering during major macro events (CPI, FOMC, NFP), as volatility expansion can instantly destroy the probability structure.
You profit if price stays above your short put strike at expiration. Even if price moves downward slightly, the speed of decay can still allow you to win. Risk is strictly defined by the width of the spread, typically 3–5 points in XSP and 30–50 points in SPX. This creates a predictable maximum loss and controlled exposure.
Profit-taking is straightforward: close the spread when it's worth 5 cents or less, or when you’ve captured 70–90% of max profit. Stop out if the spread doubles in value relative to your credit (e.g., enter for $0.30, stop at $0.60). Always exit entirely by 3:32 PM ET to avoid gamma slingshot behavior.
Overall, the bull put spread is the most consistent 0-DTE strategy, with typical win rates between 75–90%, depending on strike selection. It is ideal for traders looking for systematic, repeatable edge without needing to predict market direction — only that markets won’t collapse that day.
Why it works?
Markets drift upward intraday statistically.
Keeps positive theta + directional bias.
When to use?
ES/NQ bullish open
SPX trending strong
VIX < 17
Breadth strong (AD line positive)
Typical setup:
Short put at 5–15 delta
Long put 20–30 points lower
Risk-defined, easy to automate
Stats:
Win rate 80–90% in bullish days
Low stress
Great for small accounts
✅ 3. 0-DTE Broken Wing Butterfly (BWB)
The Broken Wing Butterfly is the most advanced and nuanced 0-DTE strategy, offering asymmetric risk, low cost, and powerful edge during high-volatility or directional days. A BWB is essentially a skewed iron fly or skewed butterfly where one wing is placed further away, creating a structure with higher reward than risk or even a no-debit or credit-based butterfly.
A typical bullish BWB sells two ATM or slightly OTM puts, buys a closer lower put, and buys a further lower put several strikes away. This creates a payoff profile where the middle strike yields the highest profit, but losing scenarios are heavily controlled. The beauty of the BWB is that you can collect credit while still having a buffer zone and minimizing tail risk.
Unlike the bull put spread or iron fly, the broken wing butterfly shines in volatile markets. It's designed to handle one-directional moves, strong intraday drops, or large opens. When skew is elevated — especially put skew — the far-out wing becomes cheap, allowing you to build the structure for little or no cost. This skew is what gives BWBs institutional appeal: they exploit uneven pricing in the options chain created by market fear.
Key features include moderate gamma, moderate theta, and mildly negative vega. Although not as theta-rich as iron flies or as high-probability as bull put spreads, BWBs offer something neither of those provide: asymmetric opportunity. You risk less than you can make, while still benefiting from IV crush and directional drift.
Professionals place BWBs based on expected move, skew, and opening momentum. A bullish BWB is ideal when price is expected to drift upward or when volatility is high enough that selling ATM premium is too dangerous. It provides better tail risk management than credit spreads and avoids the unlimited risk of naked options.
Management rules revolve around maintaining delta, controlling gamma, and monitoring whether price migrates toward the tent peak. Traders often take profits early if price stalls near the short strike or begins to threaten the near wing. If price collapses rapidly, a BWB tends to hold up far better than a credit spread, because the long wing absorbs much of the gamma and Vega shock.
The BWB becomes exceptionally powerful when structured for zero debit, creating a free “lottery ticket” with hedged downside. Many traders use multiples—layering BWBs at different levels—to build a volatility-weighted directional profile.
In high volatility, trending, or one-directional markets, the broken wing butterfly is the best risk-adjusted strategy, offering safety, optionality, and strong skew exploitation.
Why this is sleeper-OP?
Collects more credit than risk (asymmetry).
Handles violent intraday moves better than iron fly.
Still benefits from fast theta burn.
When to use?
VIX severe > 20
ES/NQ whipsaw
FOMC days, CPI, NFP
Big macro catalyst days
Typical setup:
Sell ATM short strikes
One wing close
One wing far out
Net credit > max loss
Stats:
Win rate 50–70%
Best for tail-risk adjusted returns.
⭐ Which one is best overall?
If you want consistency:
→ 0-DTE Iron Fly
If you want safest risk-defined trending play:
→ 0-DTE Bull Put Spread
If you want best payout on volatile days:
→ 0-DTE Broken Wing Butterfly
Types of delivery pricesUnderstanding the conditions in which the price is at the moment gives us the context within which we will use the tools.
Its just a 4 most common price moves on a charts what you can find on different timeframes
Expansion - It's an impulse growth or fall in the price.
Reversal - Change in the direction of price movement, opposite to the trend
Correction - It's a movement within the structure
Consolidation - Sideways price movement; conditions under which it is impossible to clearly define the direction
The first thing to define before opening a position is the context.
Taking into account the structure and liquidity zones, determine where the price is now and where it is most likely to go.
When the direction is clear, look at the points of interest (POI) from which you can expect a reaction. Inside the zone of interest, we are waiting for confirmation to enter the position.
Confirmation is a change of structure in a later period, which confirms the validity of the POI.
Thanks for reading

Why Retailers lose 90%? Smart Money doesn't allow to follow!Hello. If you’re curious about trading or you’ve tried to beat the markets ? Think what smart money has been doing again and again.
Disclaimer:
This post is dedicated solely to educational content and community-driven insights. All information shared here—including strategies, trade setups, and opinions—are for informational purposes only and should not be considered as financial, investment, or trading advice.
Viewers are solely responsible for their own investment decisions.
Trading and investing in financial markets involve risk, and the channel will not be held responsible for any losses or damages incurred as a result of actions taken based on the content presented.
Please consult with a qualified financial advisor before making any investment decisions.
In this post you will learn:
1. How to read price action, not just indicators.
2. How to follow the smart money, not the crowd.
3. Real statistics, live examples, and honest warnings. The discipline needed to turn a trading account into long-lasting wealth.
4. If you’re ready to stop searching for shortcuts and finally learn what works from first principles, understand this post.
Let’s begin at the root: What is trading?
It is the act of buying and selling financial instruments, like stocks, currencies, commodities, or derivatives, with the sole aim of making a profit which has the ability to impact the economy of a country is now accessible to anyone with a mobile phone.
You might wonder, how does trading influence an entire economy?
Trading adds massive liquidity to financial markets, allows companies to raise capital for expansion, and lets investors participate in a country’s growth story. However, wild or speculative trading can sometimes trigger volatility, even a crisis, impacting jobs and industries across the economy.
So when it is available to everyone, why do Most Fail? Why It’s Not for Everyone?
Here’s the catch — trading isn’t everyone’s cup of tea. Statistics are brutal: Nearly 90% of retail traders lose money over time. Only about 10% manage to survive, and an even smaller fraction thrives long-term. So, if you’re looking for an easy way out or quick money, trading might not be for you.
Honestly, if you want guaranteed results and dislike uncertainty, it’s better to focus your energy elsewhere — that’s the hard truth.
At the same time, Who Thrives in Trading?
It is one of the toughest jobs in the world — tougher than rocket science or open-heart surgery, because here, the enemy is your own psychology. Those who succeed have discipline, patience, and adaptability. If that excites you, then let’s continue.
Moving forward, Why Most Retail Traders Lose?
Let’s talk about indicators and patterns. Have you ever wondered why there’s a flood of free tools online, each claiming to unlock profits? If these tools worked, wouldn’t everyone be rich? The harsh reality is Big institutions and banks have the resource to track all algorithms and setups of every petty retailer. Indicators are often designed to manipulate the masses, helping big players—smart money—feed off smaller, retail traders. Most of these strategies look good on paper, but fail miserably upto 50% in real trades.
Let me explain further with A Live Example: How Smart Money Profits from Retailers:
Whenever retail traders enter a popular selling zone, their collective stop losses are clustered just above that zone. The smart money—hedge funds and institutional players—can see these clusters. Smart money already has the expertise and resources to track down the cluster of stop losses. They push the price up briefly, either by buying pressure or hedging, triggering retail stop losses and buying those positions at a discount. The losing retail traders exit in panic, while the smart money enjoys the rebound.
So, the common man’s entry price often becomes the rich man’s exit, and the provider of liquidity is the one who loses.
Thus, The Statistics emphasise on Rich Get Richer, Poor Get Poorer.
Statistics don’t lie. The top 1% of traders control over 80% of the wealth because they understand market psychology, price action, and institutional flow. Most retail traders keep chasing easy profits, only to end up as “fuel” for the professionals. The famous saying, “In trading, money flows from the impatient to the patient,” is very real.
In all these circumstances, Can Retail Traders Ever Win?
Is there any hope for retailers to win consistently? Yes, but only with the right approach!
Forget about magic indicators, secret patterns, or the latest news flash—institutions can manipulate all that. But there’s one thing nobody can manipulate: price itself.
Stop chasing the crowd, imagine them as a school of fish. Instead, hug the belly of the big sharks—blend in with institutional flow and study pure price action.
Why Price Action is King?
Why trust price action? Because price is the total of every force—news, sentiment, manipulation, and truly valuable information. If you can read the footprints left by smart money, you’ll stop getting tricked by the bread crumbs distributed to unsuspecting retailers.
Stop losses of retailers are literally profits for institutions. A retailer’s entry, without proper analysis, often becomes a signal for big players to do the opposite. Follow price—not noise.
Drop a comment sharing your own trading journey, mistakes, or burning questions.

Bitcoin Time-Channel CyclesYellow = 1064d expansion
Green = 658d mean node
Blue = 364d compression
This chart documents a repeating BTC time-channel structure built from prior cycle highs and lows. The goal here is not to force a price prediction, but to show that Bitcoin has been respecting a consistent rhythm in time and slope across multiple market regimes. When the previous major ATL is used as the anchor, the next macro expansion phase has repeatedly aligned with a ~1064-day duration. That expansion window is displayed as the larger corridor, and it has now shown up cleanly from the 2015 ATL into the 2017 ATH, from the 2018 ATL into the 2021 ATH, and again from the 2022 ATL into the 2025 ATH..
Inside each 1064-day expansion corridor, a secondary time node appears at roughly 658 days, which is the golden-ratio contraction of the full expansion cycle. What’s notable is that price has not been randomly positioned at this midpoint in time. Instead, it has repeatedly migrated back to the mean of the rising channel near the 658 day mark, acting like a structural equilibrium reset within the broader uptrend. This “mean hit” behavior is visible across cycles and is one of the main reasons to watch time geometry alongside price geometry. After the mean-hit, the market has historically rotated into the final leg of the expansion phase before completing the cycle high.
Following each macro high, the bearish compression phase has clustered around ~364 days, shown as the blue corridor. These reset windows are materially shorter than the expansion windows, which matches the observed tendency for bullish advances to build over years while bearish phases compress into faster, more volatile declines. The expansion to compression ratio is close to 3:1, reinforcing the idea that the market “inhales” slowly and “exhales” quickly in time. The important takeaway is that the model is not asking price to obey a specific number; it’s showing how price has behaved inside repeating time-based corridors, with the mean of the channel acting as a magnet around the 658 day node.
This framework is shared as a structural study, not a guarantee. Markets can mutate, and no historical symmetry is permanent. However, when a time-channel sequence repeats cleanly across multiple cycles, it becomes a useful way to frame expectation, especially for identifying where equilibrium touches and regime shifts are statistically more likely to occur. If this rhythm continues to hold, future cycle windows can be mapped the same way, with the emphasis placed on time-based decision zones and mean reactions rather than on any single price target.

FireHoseReel | Engulfing Candlestick Pattern (Crypto Version)🔥 Welcome FireHoseReel !
Let’s dive into the Engulfing Candlestick Pattern.
✔️ Bearish Engulfing – Basics
The Bearish Engulfing is a two-candlestick reversal pattern.
The first candle is bullish, and the second is a larger bearish candle that fully engulfs the first candle’s body and closes below its low.
Since crypto rarely has gaps, the key condition is that the second body completely covers the first body.
Shadows are not significant.
This pattern is most reliable after a weakening uptrend.
🎯 Bearish Engulfing – Psychology
This pattern shows a strong bearish shift.
Buyers push price upward at first, but the second candle proves sellers have taken full control, dragging price down and even breaking the previous candle’s low.
It signals momentum shifting from bulls to bears.
🧮 Bearish Engulfing – Setup & Levels
• Trigger: Break below the low of the second candle.
• Confirmation: A close below the trigger.
• Stoploss: Above the high of the second candle or whole structure.
• Buy-stop entry: Only if the main trend remains strongly bullish (rare in crypto).
✔️ Bullish Engulfing – Basics
The Bullish Engulfing is a two-candlestick reversal.
The first candle is bearish, and the second is a larger bullish candle that fully engulfs the first body and closes above its high.
In crypto, the key factor is that the second bullish body fully covers the first bearish body.
It works best after a downtrend or capitulation phase.
🎯 Bullish Engulfing – Psychology
This pattern indicates a strong bullish reversal.
Sellers control the first candle, but buyers return aggressively on the second candle, overpowering them and closing above the previous high.
It signals momentum shifting from bears to bulls.
🧮 Bullish Engulfing – Setup & Levels
• Trigger: Break above the high of the second candle.
• Confirmation: A close above the trigger.
• Stoploss: Below the low of the second candle or structure.
• Sell-stop entry: Only in strong downtrends and rarely recommended.
🛞 Risk Management & Disclaimer
Please remember to always use proper risk management and position sizing. Nothing in this analysis is financial advice. The market can change quickly, so always trade based on your own strategy, research, and risk tolerance. You are fully responsible for your own trades.

BRICS Thriving in the Global Market1. Economic Powerhouse: The Growing Weight of BRICS
BRICS nations collectively account for:
~45% of the world’s population
~36% of global GDP (PPP terms)
Over 30% of global energy supply
More than 25% of global exports
This economic heft gives the bloc a powerful edge in global markets. China and India alone are among the world’s top three economies (PPP), contributing significantly to global consumption and manufacturing.
Diverse Economic Strengths
Each BRICS nation contributes uniquely:
China remains the world’s manufacturing hub.
India is a technology and services powerhouse.
Brazil dominates agricultural exports—soybeans, beef, sugar.
Russia is a global leader in oil, gas, and defence.
South Africa is rich in minerals and precious metals.
Saudi Arabia & UAE bring capital and strategic energy influence.
Iran adds geopolitical depth and massive energy reserves.
Egypt & Ethiopia boost African connectivity and demographic momentum.
This diversity allows BRICS to remain resilient amid global disruptions, creating a balanced ecosystem that strengthens intra-bloc cooperation.
2. Trade Expansion: Intra-BRICS and Global Influence
BRICS countries are rapidly expanding trade ties among themselves to reduce dependence on Western markets. China’s trade with BRICS partners has surged, while India has significantly increased exports to Brazil, Russia, and Middle Eastern BRICS members.
Key Factors Driving BRICS Trade Growth
a) Complementary Economies
China and India require energy → Russia, Saudi Arabia, Iran supply it.
Brazil’s agricultural exports feed Asia.
Africa’s mineral wealth fuels global industrial supply chains.
This interdependence strengthens BRICS’ internal trade network.
b) Reduced Trade Barriers
Countries are increasingly settling trade in local currencies rather than the U.S. dollar, reducing currency volatility and sanctions exposure.
c) Shift in Global Supply Chains
The “China+1” and “China+2” strategies have allowed India, Brazil, and others to attract manufacturing investments as global firms diversify.
3. Financial Resilience: BRICS Challenging the Western Banking System
One of the strongest signs of BRICS thriving in the global market is the growing independence from Western-dominated financial structures.
The New Development Bank (NDB)
Founded in 2014, the NDB finances infrastructure and sustainable projects across member countries. It has approved billions in funding and aims to rival institutions like the World Bank.
Local Currency Settlements
Countries like India, Russia, and China are increasingly settling trade in:
Indian Rupee (INR)
Chinese Yuan (CNY)
Russian Ruble (RUB)
This reduces dollar dependency and creates a more stable financial ecosystem.
Rise of Yuan in Global Trade
With China’s vast trade network, the Yuan has become a preferred settlement currency in Asia, Middle East, and parts of Africa—indicating the financial reach of BRICS nations.
4. Energy Dominance: A Core Strength of BRICS
Energy-rich BRICS members—Russia, Saudi Arabia, Iran, Brazil—have reshaped global oil and gas markets.
Why Energy Gives BRICS Global Power
They control over 40% of the world’s oil production.
They significantly influence OPEC+ decisions.
Asian demand for energy gives the bloc leverage.
Energy trade in local currencies challenges petrodollar dominance.
This energy ecosystem further strengthens BRICS economic integration.
5. Technological and Digital Growth: The New Engine of BRICS
Technology and digital infrastructure are crucial for modern economic dominance. BRICS nations, especially China and India, are leading in several key areas:
a) Digital Payments
India’s UPI has become a global model.
Brazil’s PIX and China’s WeChat Pay dominate domestic markets.
b) Artificial Intelligence & Semiconductors
China is a global AI leader; India is emerging as a major chip-design hub.
c) Space Technology
India, China, and Brazil have advanced space programs that boost telecom, navigation, and climate research.
d) 5G and Future Tech
China’s Huawei leads global telecom infrastructure development, especially in Africa and Asia.
BRICS nations are not just consumers of technology—they are innovators and exporters, enhancing their global market competitiveness.
6. Geopolitical Influence: BRICS as a Multipolar Power Center
The growth of BRICS is inherently tied to the global shift away from unipolarity. With the West and emerging economies diverging in priorities, BRICS offers an alternative global governance model.
Geopolitical Strengths of BRICS
Represents major regional powers across Asia, Africa, Middle East, South America.
Coordinates policies on global issues like climate, development, and trade.
Provides a counterweight to NATO, G7, and Western-led financial institutions.
The expansion of BRICS signals its rising diplomatic and strategic relevance.
7. Global South Leadership: BRICS as a Voice for Developing Nations
A major reason BRICS is thriving is its role as the champion of the Global South.
Key roles include:
Promoting fairer global trade rules.
Improving access to development finance.
Supporting infrastructure development across Africa & Asia.
Challenging Western dominance in global decision-making.
As inequality between developed and developing countries rises, BRICS becomes a preferred platform for emerging economies.
8. Future Outlook: Can BRICS Redefine Global Markets?
The momentum behind BRICS is strong, but the future will depend on:
Deepening financial integration.
Improving trade logistics.
Balancing China–India competition.
Leveraging energy dominance responsibly.
Expanding technological cooperation.
If successful, BRICS could become the largest economic bloc in the world by 2035, shaping global trade, currencies, and geopolitics.
Conclusion
BRICS is thriving in the global market due to its massive population, resource wealth, rapid digital growth, rising financial independence, and strategic geopolitical influence. As the world transitions toward a multipolar era, BRICS nations are not only shaping global trade but also redefining the economic and political architecture of the 21st century. With expanding membership, growing economic interdependence, and increasing relevance in global governance, BRICS is poised to become one of the most powerful alliances in the decades ahead.

Liquidity Hunt: How Whales Move the MarketEver wonder why prices always seem to drop just below your stop loss before bouncing back? It’s not bad luck; it’s liquidity in action. The big players are prowling, hunting for stops, and if you don't understand where they’re lurking, you might just be their next target. Liquidity definition refers to how easily an asset can be bought or sold without significantly affecting its price, and in the world of crypto, this dynamic can make or break your trade. Let’s dig into how these whales work the market and how you can avoid becoming their prey.
What is Liquidity?
Liquidity meaning refers to how easily an asset can be bought or sold without affecting its price. In the context of crypto, it's crucial to know that high liquidity means less slippage, while low liquidity can lead to sharp price moves. Market liquidity is essential for smooth trading, but it also creates opportunities for big players to manipulate price action by targeting stop losses.
Liquidity Risk and Big Players
Liquidity risk arises when there's not enough liquidity to execute trades efficiently, especially during volatile periods. Big players exploit these conditions by pushing prices through key support and resistance levels, triggering stop orders and capturing liquidity. This is why it’s vital to be aware of where liquidity is concentrated — big players often target areas with many stop losses, trapping retail traders in the process.
Tools to Analyze Liquidity
Volume Indicators: Use tools like Accumulation/Distribution or On-Balance Volume (OBV) to spot surges in volume that may indicate manipulation or big players entering the market.
Bitcoin Liquidity Heatmap: A Bitcoin liquidity heatmap shows where large buy and sell orders are placed, helping you avoid areas where liquidity is likely to be targeted by whales.
Liquidity Ratio Formula: Another great tool which helps measure market depth and liquidity. You can calculate it as:
A higher ratio indicates that there is more buying pressure, suggesting the market is more liquid and less prone to manipulation. On the other hand, a lower ratio signals more sell orders, which could expose you to increased liquidity risk and higher chances of price manipulation by big players.
Price Action: Watch for candlestick patterns like pin bars or engulfing candles near key support or resistance levels to anticipate price reversals after stop hunts.
Conclusion
While tools like volume indicators and Bitcoin liquidity heatmaps can help, always stay vigilant. Use wider stop losses to avoid getting trapped at key levels, and stay cautious during periods of low liquidity when whales are most active. This article isn’t trading advice — always DYOR and trade responsibly.

Inverse Head & Shoulders on USDJPY (Quarterly Chart)Japanese yen is pretty technical on the charts
Its very good for education
This time I spotted for you a textbook
Giant Inverse Head & Shoulders reversal bullish pattern
It was built at the bottom of the move with three consecutive troughs
with the deepest in the middle called the Head and the side parts called the Shoulders
The dotted trendline connecting the peaks of the inverted Head is the Neckline
The latter is a key barrier for the bullish trigger
Price broke above it in 2022 and quickly pushed beyond the 151 level
Then a classic textbook pullback unfolded to accurately retest the broken Neckline
After that price resumed its uptrend to test the crucial resistance at 160.40
built from the peak of distant 1990!
It was a die hard barrier as price was rejected and fell back into the 140 area
And now again we are heading to retest that solid barrier
Back to the pattern
The target for the Inverse Head & Shoulders is set at the depth of the Head
Neckline minus Heads bottom added to the Neckline
It is located at 174 a potential gain of a whopping 11 percent
Price should stay above the Neckline beyond 127 before reaching the target
otherwise the pattern becomes invalidated
And if we zoom in you can see a wide empty space without strong barriers
until price hits the next major resistance at 277.79 the peak of the 80s
That means JPY could lose almost 73 percent of its value to USD

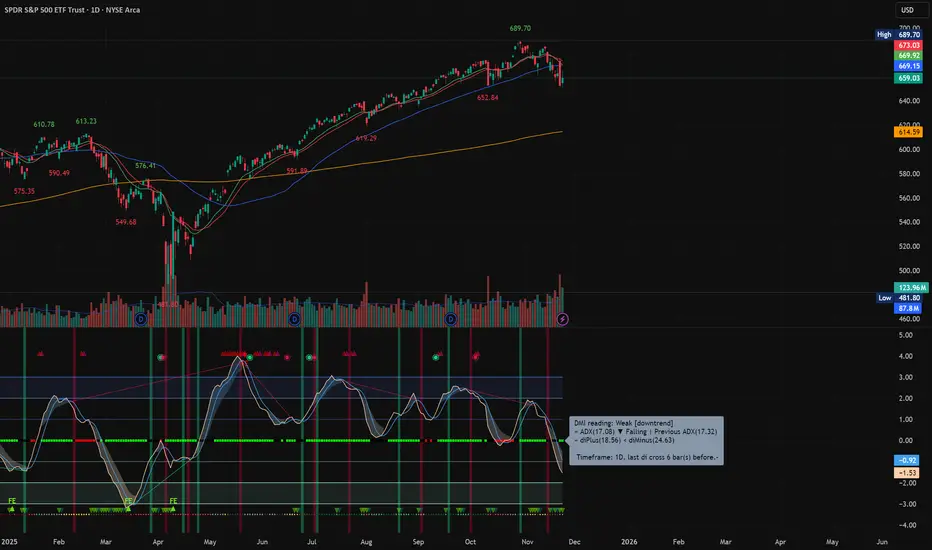
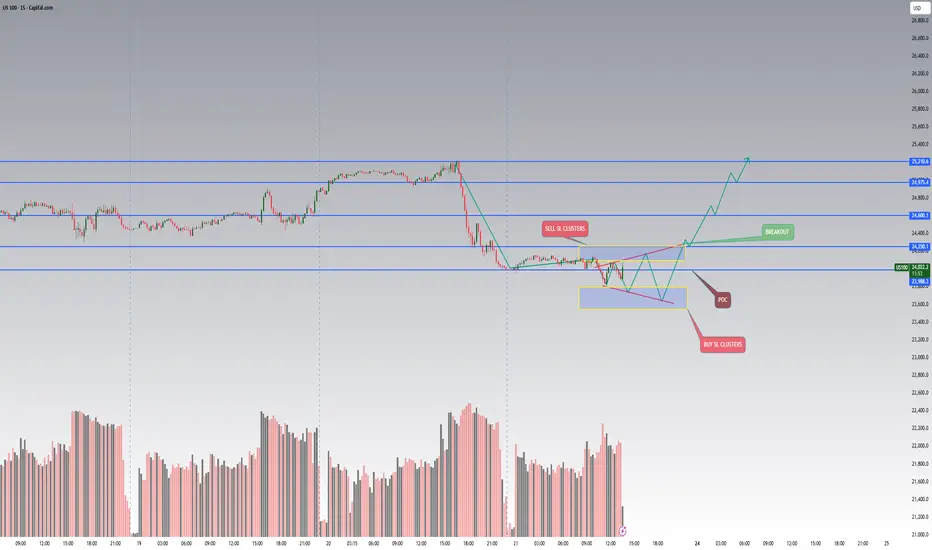
Why Markets Struggle After a Big Drop (NASDAQ Case Study)Understanding liquidity, distribution phases and market-maker behavior
After the NASDAQ fell sharply from 25 000 to 24 000, many traders were surprised why the market suddenly stopped moving and started to “chop” around the same area.
But this behavior is not random — it’s a structural problem inside the order-flow.
1️⃣ Markets can fall fast — but they cannot continue without liquidity
Every trade in the market has a counter-party.
If traders want to buy the dip, someone must sell to them.
After a large drop, fewer participants are willing to sell at the new low prices.
Institutions are often already hedged or already sold during the fall.
Market makers cannot force liquidity out of thin air — they must create it.
This leads to a distribution phase, where price stops trending and starts rotating around a key area.
2️⃣ Why distribution forms around the Point of Control (POC)
When aggressive hedging is finished and volatility slows down, the market enters a phase where:
Price rotates around the Point of Control (POC)
Volume increases
Market makers attempt to rebuild liquidity on both sides of the range
This is not accumulation or re-accumulation — it is a liquidity-engineering phase.
Market makers need enough:
Buy-side liquidity above POC (stop losses of shorts, breakout traders, trapped buyers)
Sell-side liquidity below POC (stop losses of longs, late dip-buyers, liquidation clusters)
Without these pools, the market cannot initiate the next impulsive move.
3️⃣ The problem with sell-side liquidity after a big fall
When NAS dropped from 25k → 24k:
Most weak longs were already liquidated
Many sellers closed positions or took profit
Fresh shorts hesitate to enter at the lows
Institutions are waiting for better prices
This creates a liquidity vacuum.
To solve this vacuum, the market “mirrors” trades inside the range:
Price moves up → build stops above
Price moves down → build stops below
Repeated sweeps → fill both sides of liquidity
Only after enough stop-loss clusters form, the market is capable of moving again with real momentum.
4️⃣ What this means for traders
This is not a buy or sell signal.
It’s an explanation of why the market becomes extremely slow, sideways or manipulative after a big impulsive move.
In this phase:
Breakouts usually fail
Trend trading performs poorly
Range traps occur frequently
Market reacts strongly to liquidity pockets, not fundamentals
The key is to understand what the market is missing:
➡️ Not direction.
➡️ Not fundamentals.
➡️ But liquidity.
Until the liquidity pools are recreated, the next real directional move cannot start.
5️⃣ Final takeaway
A strong decline does not end because “buyers step in.”
It ends because no more sellers exist at those levels, forcing market makers to rotate price and rebuild the order-book.
Learning to identify these liquidity-reset periods helps traders avoid:
Chasing breakouts
Entering too early
Getting trapped during fake momentum
Misreading sideways distribution as a reversal
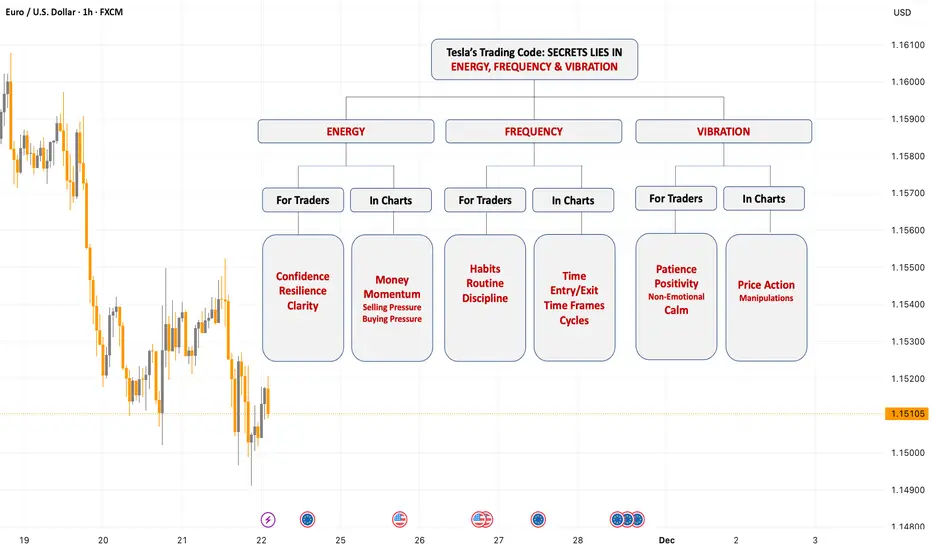
Decoding Trading Charts and Psychology in NIKOLA TESLA'S way! Hey, how are you all! Let's dive deep into a powerful concept inspired by Nikola Tesla’s famous quote: “If you wish to find the secrets of the universe, think in terms of ENERGY, FREQUENCY, and VIBRATION.” This idea, though from the realm of physics, it beautifully translates into the world of trading—both in developing the individual’s right trading mindset and understanding price charts.
Disclaimer:
This post is dedicated solely to educational content and community-driven insights. All information shared here—including strategies, trade setups, and opinions—are for informational purposes only and should not be considered as financial, investment, or trading advice.
Viewers are solely responsible for their own investment decisions.
Trading and investing in financial markets involve risk, and the channel will not be held responsible for any losses or damages incurred as a result of actions taken based on the content presented.
Please consult with a qualified financial advisor before making any investment decisions.
Let’s break down each component and see how you can apply it practically to your trading journey.
At first, let’s talk about the Energy: The Driving Force in Mindset of an individual and Money in Markets.
Energy —Tesla described it as the fundamental driving force behind everything. In trading mindset, energy is your mental and emotional vitality. It’s the passion that fuels your motivation to study markets daily, the focus that keeps you glued to charts during sessions, and the resilience that helps you bounce back from losses without losing confidence.
Imagine two traders: One wakes up excited, ready to analyse and follow their strategy, maintaining positivity even after a tough day. The other wakes up tired and doubtful, easily frustrated by every small loss. The difference? Their energy levels. High, consistent energy levels mean a trader can handle stress better, maintain discipline, and stick to a well-thought plan rather than acting impulsively.
On the market side, think of it as the driving force in the universe of trading. In trading, energy directly corresponds to Money. Money represents the real driving power or driving force behind price movement. It is the buying or selling pressure that injects momentum into the market.
When big chunks of money flow into a stock, like institutional buying, it fuels powerful upward moves. Conversely, large sell-offs drain energy, pushing prices down. Understanding where money is concentrated and how much “Energy” in the form of “Money” is behind the moves lets you anticipate strong trends or reversals.
Secondly, It’s time to discuss about Frequency: The Discipline of an individual and the Time factor in Trading.
Frequency, which for Tesla referred to the rate at which something vibrates or repeats. In trading mindset, frequency is the rhythm of your actions—your habits, your routine, and your discipline. Are you consistently reviewing charts at time intervals? Do you stick to your risk management and trading plan day after day? That regularity creates a frequency that stabilise your results.
Consider a trader who trades instantly, jumping into random setups at different hours without a plan. Their frequency is erratic, and their results are often inconsistent. Contrast that with a trader who enters the market with a fixed routine, analysing and executing trades in well-defined sessions. This disciplined frequency builds confidence and clarity, reducing emotional reactions like fear and greed.
For market charts, the context is in which price move happen in market hours, trading sessions, days, weeks, or months. Frequency is about the rhythm or cycle of these movements. The time of entry and exit of a trade needs understanding of the time factor to achieve better results. For example, price Accumulation and Distribution within an area represent the range of price movements in the near future.
It relates to the timing of price moves. This includes how often prices spend in a particular area without sweeping their highs and lows. The more time spent on it can potentially be how directional the price can behave.
At last, it is Vibration we must look into: It is the Emotional State of an individual and Price Action in charts.
Vibration: On a psychological level, vibration reflects your emotional states—the subtle feelings influencing how you react to market moves. Positive vibrations like calmness, confidence, and patience help you stay grounded, while negative ones like fear, frustration, and impatience can cause poor decisions.
For example, a trader who can stay calm during a price pullback might hold their position with confidence, trusting their analysis. Another who feels anxious might exit too early or overtrade to compensate, resulting in losses.
On the chart side, vibration is best understood as the actual Price Action on the charts—the patterns, candlesticks, and trends that represent how the market feels and behaves at any moment.
Just as vibration represents waves or oscillations in physics, price action is the ever-changing market vibration, reflecting trader sentiment, supply and demand shifts, and market psychology.
For example, a strong bullish trend or bearish trend are vibrations signalling increasing pressure. Sideways or choppy price action indicates indecision and low vibration energy. Learning to read these vibrations means interpreting the real-time mood and momentum of the market.
vibration is the actual price action—the patterns, trends, and candlestick formations that “vibrate” with market sentiment. Sharp price spikes, steady trends, or choppy sideways movement all represent different vibrations of the market. Learning to “read” these vibrations lets you align your trades with what the market is truly expressing.
Bringing It All Together>>>>>>>>>>>
So, how do we use these three—energy, frequency, and vibration—in practical trading mastery?
- First, cultivate your energy by maintaining a positive mindset, managing stress, and staying passionate about learning how, where and when the money is being exchanged.
- Next, build your frequency by developing and sticking to disciplined routines and timing your trades in harmony with market rhythms.
- Lastly, heighten your awareness of vibration by controlling your emotions and learning to interpret price action signals accurately.
Mastering these interconnected elements doesn’t just help you with strategy—it transforms your entire trading psychology, turning you into a more consistent and confident trader.
If this perspective adds value and if you have any inputs to this understanding about trading, Share your experiences or questions in the comments below—I love hearing the application of this thought into charts. Until next time, focus on your energy, maintain your frequency, and tune into the vibrations. Trade smart, and stay disciplined!
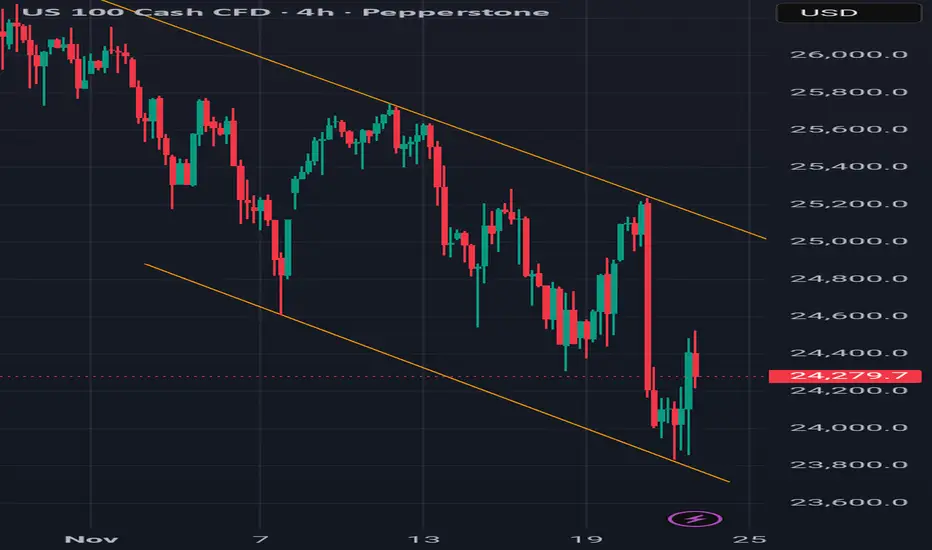
Momentum meets structure - Asset: US 100 Cash CFD
- Timeframe: 4H
- Structure: Descending channel (bearish trend)
- Momentum: Stochastic RSI (14,3,3) rising from oversold
- Event: Price bounced off lower trend line with stochastic confirming upward momentum
1. Trend Line Structure
- The descending channel defines a bearish environment.
- Price touches the lower boundary → potential support zone.
- This is a structural signal: price may bounce within the channel.
2. Stochastic Confirmation
- Stochastic RSI was in the oversold zone (<20).
- Lines are now crossing upward, signaling momentum shift.
- This is a momentum signal: buyers are stepping in.
3. Confluence = High-Probability Setup
- Structure (trendline support) + Momentum (stochastic reversal) = confluence.
- This increases the probability of a short-term bullish move toward the upper trend line.
-Price action within a descending channel shows a bounce off support. Stochastic RSI confirms momentum shift from oversold. This confluence offers a textbook example of how structure and momentum combine for a high-probability setup.
This setup teaches traders to:
- Wait for confluence, not isolated signals.
- Use stochastic to confirm trend line reactions.
- Respect the channel boundaries for targeting and risk.
Supply & Demand vs Support & Resistance — Beyond the Lines“Two traders can look at the same level.
One sees a line.
The other sees the reason behind it.”
Most beginners start with Support & Resistance.
Advanced traders shift into Supply & Demand.
Both seem similar… and in some cases, they are the same.
But the difference lies in why price reacts — not just where.
Let’s break this down clearly.
1. Support & Resistance: The Surface Layer
Support and resistance are simple horizontal reaction levels.
Support
A price level where the market tends to bounce upward.
Resistance
A price level where the market tends to reject downward.
These levels represent crowd behavior.
Retail traders love them — which is why they often turn into liquidity pools.
Strength: easy to spot, widely used
Weakness: easily manipulated because stops cluster there
2. Supply & Demand: The Deeper Institutional Layer
Supply & Demand zones are created by imbalances — strong, one-sided moves driven by institutional orders.
To make the concept crystal clear:
Demand Zone
The last bearish candle (or group of candles) before a strong impulsive move upward, caused by institutional buying and imbalance.
Supply Zone
The last bullish candle (or group of candles) before a strong impulsive move downward, caused by institutional selling and imbalance.
These zones show where institutional buying or selling actually started.
Strength: precise entries, strong reaction zones
Weakness: requires deeper understanding and confirmation
3. How They Connect
This is where most traders get confused.
Support/Resistance = the reaction.
Supply/Demand = the reason for the reaction.
Many times:
A support level is formed because a demand zone sits right below it.
A resistance level is formed because a supply zone sits above it.
So yes — in many cases:
Demand = Support
Supply = Resistance
But only when the reaction was created by institutional imbalance.
4. When They Are NOT the Same
This is the part traders often miss.
❌ Support is NOT demand when:
• Price bounced many times (retail clustering)
• No strong bullish impulse originated there
• Candle structure shows hesitation, not institutional entry
This is just retail support, not a demand zone.
❌ Resistance is NOT supply when:
• Price tapped repeatedly (equal highs)
• No sharp drop came from that level
• The zone lacks displacement or imbalance
This is simply retail resistance, not a supply zone.
5. How to Use Both for Maximum Clarity
Here’s the practical way to combine them:
Use Support/Resistance to understand where retail will react.
Use Supply/Demand to understand where institutions will react.
Best workflow:
• Mark higher timeframe Supply/Demand
• Mark intraday Support/Resistance
• Wait for price to move between these layers
• Look for confirmation (ChoCH/BOS) at the real institutional zone
• Avoid taking trades directly at retail S/R without deeper context
This gives you direction, patience, and precision.
Example (XAUUSD)
Refer to M15 chart above:
Price respected an intraday support level,
but the real reversal happened only after tapping the demand zone below it,
where imbalance and institutional orders existed.
Support showed the bounce.
Demand explained the bounce.
One shows the line.
The other shows the truth behind the line.
📘 Shared by @ChartIsMirror
Do you trade with support and resistance, supply and demand, or a mix of both?
Share what you see — your approach reveals how you read the market’s story.

Climate Change Impact on the Global Market1. Economic Disruptions and Global GDP Impact
Climate change directly affects global economic output through productivity losses, infrastructure damage, agricultural decline, and health impacts. Increasing temperatures reduce labor productivity, especially in agriculture, construction, and manufacturing. Coastal economies face rising costs due to sea-level rise, threatening ports, factories, and tourism hubs.
Studies consistently estimate that unmitigated climate change could reduce global GDP by 10–20% by 2100, with disproportionate impacts on developing regions such as South Asia, Africa, and Southeast Asia. These regions face intensified heatwaves, droughts, and floods that strain food systems and public resources. Conversely, countries with cooler climates may experience temporary benefits, such as longer growing seasons, yet these are overshadowed by global supply-chain disruptions and market volatility.
2. Supply Chain Disruptions and Global Trade
Climate change poses a serious threat to global supply chains that depend on stable transportation networks, predictable weather, and consistent resource availability. Extreme weather events—such as floods in China, heatwaves in Europe, and hurricanes in the US—regularly disrupt manufacturing hubs, ports, and logistics networks.
For example:
Flooding disrupts industrial zones in China, Thailand, and India, impacting electronics, automobiles, and textile production.
Droughts reduce water availability for hydropower and manufacturing, affecting production costs and reliability.
Hurricanes halt shipping lanes and damage ports, slowing global trade flows.
Industry giants are now diversifying suppliers, relocating production, and investing in climate-resilient infrastructure. Companies increasingly factor climate risk into procurement and logistics decisions, making climate resilience a competitive advantage.
3. Agriculture, Food Prices, and Commodity Markets
Agriculture is among the most vulnerable sectors. Shifting rainfall patterns, extreme heat, soil degradation, and water scarcity reduce crop yields for staples like wheat, rice, maize, and soy. These disruptions trigger volatility in global food markets.
Key impacts include:
Reduced yield stability, making long-term pricing unpredictable.
Increased input costs due to water scarcity and changing pest patterns.
Price spikes in commodities such as grains, edible oils, and sugar.
Higher insurance and credit costs for farmers exposed to climate risks.
Livestock and fisheries also suffer, with warming oceans affecting fish stocks and coral reefs. As food prices rise and become more volatile, inflationary pressures build across developing economies, impacting household budgets and political stability.
4. Energy Markets and the Shift to Renewables
Climate change drives a massive transition in global energy systems. Governments and corporations worldwide are shifting from fossil fuels to renewable energy sources like solar, wind, hydropower, hydrogen, and bioenergy. This shift impacts global markets in several ways:
A. Decline of Fossil Fuels
Oil, gas, and coal sectors face decreasing long-term demand due to carbon regulations, electric vehicle growth, and renewable adoption. Major oil companies are diversifying portfolios into green energy and carbon capture technologies.
B. Rise of Renewables
Solar and wind energy markets are rapidly expanding, creating new jobs, lower power costs, and large-scale investment opportunities. Battery storage and grid modernization are also experiencing accelerated growth.
C. Energy Price Volatility
Climate-related events, such as hurricanes shutting down offshore rigs or droughts reducing hydropower output, contribute to unpredictable energy supply and price instability.
The energy transition is reshaping geopolitics: countries with strong renewable potential—such as India, China, and Brazil—gain competitive advantages in green manufacturing and energy security.
5. Financial Markets: Risks, Returns, and Regulations
Climate change increasingly influences financial markets through three major channels:
1. Physical Risks
Damage from natural disasters affects stock valuations, bond risks, and insurance claims. Companies with assets in high-risk regions face declining valuations and higher operating costs.
2. Transition Risks
Sectors slow to shift to low-carbon models face regulatory penalties, higher carbon taxes, and stranded assets (e.g., coal plants, oil fields). Investors increasingly examine decarbonization strategies before allocating capital.
3. ESG and Sustainable Investing
Environmental, Social, and Governance (ESG) investing has grown into a multi-trillion-dollar market. Climate-focused funds, green bonds, carbon-neutral portfolios, and impact investing influence stock market performance. Companies with strong climate policies attract more investment and better credit ratings.
Central banks worldwide now require financial institutions to assess climate risks through stress tests, making climate resilience a core component of global financial stability.
6. Insurance and Risk Management
Climate disasters—wildfires, floods, hurricanes—are more frequent and severe, overwhelming insurance systems. Claims have skyrocketed in recent years, forcing insurers to:
Increase premiums
Limit coverage in high-risk areas
Adjust business models toward risk prevention
Invest in climate analytics and catastrophe modeling
Some regions could become "uninsurable," which directly affects real estate prices, investment decisions, and economic development.
7. Corporate Strategy, Innovation, and Green Technology
Corporations are transforming their business models to cope with climate change. Many industries are embracing innovation to reduce carbon footprints and capture new market opportunities.
Key innovation areas include:
Renewable energy technologies
Electric vehicles (EVs) and charging networks
Smart grids and energy-efficient buildings
Carbon capture, utilization, and storage (CCUS)
Sustainable agriculture and vertical farming
Climate analytics and AI-driven risk modelling
Water-saving technologies and desalination
Companies that adapt quickly gain competitive advantages in regulatory compliance, consumer trust, and long-term profitability.
8. Consumer Behavior and Market Demand
Climate change has shifted consumer preferences toward sustainable products and green lifestyles. Demand is increasing for:
Electric vehicles
Plant-based foods
Eco-friendly packaging
Energy-efficient appliances
Ethical brands with sustainability commitments
Younger consumers, in particular, prefer brands that align with climate responsibility. Businesses that fail to adapt face declining market share.
Conclusion
Climate change is no longer a distant threat—it is a present and powerful force reshaping the global market. It affects everything from GDP growth and supply chains to financial markets, energy systems, and consumer behavior. While the risks are enormous, including economic losses, resource scarcity, and market instability, the transition to a low-carbon economy presents unprecedented opportunities. Companies, investors, and nations that innovate and adapt quickly will lead the next era of sustainable global growth.
Selecting the Best Broker Platform1. Understanding the Purpose of a Broker Platform
A broker platform is a gateway that connects you to financial markets—stocks, derivatives, currencies, commodities, bonds, and more. Your broker allows you to buy and sell, provides market data, offers tools for analysis, and sometimes even educational material. A good platform should:
Be easy to use
Execute orders fast
Provide accurate data
Keep costs transparent
Offer strong security
Your decision depends largely on what type of trader or investor you are, which leads us to the next step.
2. Identify Your Trading or Investment Style
Not all brokers suit all styles. Before choosing, identify what you need:
a. Long-Term Investor
You prioritize low charges, SIP options, corporate action updates, and portfolio analytics.
b. Swing / Positional Trader
You require charting tools, indicators, margin facilities, and reliable order execution.
c. Intraday Trader
Speed of execution, low latency, minimal brokerage, and advanced charts matter the most.
d. F&O / Options Trader
You need margin calculators, real-time option chain, Greeks, strategy builder, and fast execution.
e. Commodity or Currency Trader
Your priority is extended market hours, reliable futures pricing, and risk tools.
Once you clarify your category, the evaluation becomes easier.
3. Key Factors to Evaluate Before Selecting a Broker
**1. Brokerage Charges & Hidden Fees
Cost is a crucial factor. Brokers may charge:
Intraday brokerage (flat per order or percentage)
Delivery charges (some offer zero)
Futures & options charges
Call & trade fees
Platform subscription charges
Demat maintenance charges
Look for transparency. Compare effective yearly cost, not just listed price.
**2. Trading Platform Quality (App + Desktop + Web)
A good trading platform must be:
Fast
Stable during market volatility
Easy to navigate
Capable of advanced charting
Able to execute orders in milliseconds
Check the following:
a. User Interface & Experience
Intuitive layout, simple order placement, personalization options.
b. Charting Features
Indicators
Drawing tools
Timeframes
Multi-chart view
Backtesting features
c. Compatibility
Available on Android, iOS, Windows/Mac, and browser.
d. Order Types
The broker should support:
Market/Limit/SL/SL-M
Bracket Orders (BO)
Cover Orders (CO)
GTT or GTD (good-till-triggered)
AMO (after-market orders)
**3. Regulation & Safety
In India or any global market, regulation is crucial. Ensure your broker is registered with a recognized authority such as:
SEBI (India)
FINRA (US)
FCA (UK)
ASIC (Australia)
Check their complaints history, audit reports, and trust score.
**4. Fund Transfer Convenience
A good broker should allow:
Instant deposits
Instant withdrawals
Multiple payment options
Bank linking without hassle
Delay in withdrawals is a red flag.
**5. Customer Support Quality
Trading is time-sensitive. Good brokers offer:
Fast chat support
Phone support during trading hours
Email resolution within 24 hours
Issue tracking system
You can test support by asking a few queries before opening an account.
**6. Research & Education Tools
For beginners, integrated learning resources help a lot. Look for:
Daily market updates
Earnings reports
Tutorials & courses
Stock analysis tools
Screeners (fundamental + technical)
**7. Margin & Leverage Policies
Check how much margin they offer for:
Intraday
Futures
Options selling
Currency
Commodities
Ensure margin rules align with your trading strategies.
**8. Additional Features
Depending on your needs, extra features may matter:
Algo trading support
API connectivity
Strategy builder
Backtesting platform
Portfolio tracking
Tax reports
SIP in stocks or ETFs
4. Compare Brokers Based on User Type
A. Best for Beginners
A beginner-friendly broker should offer:
Simple app interface
Low account opening charges
Educational videos
Zero or low delivery brokerage
Safe long-term investment options
B. Best for Intraday Traders
Look for:
Ultra-low brokerage
Fast execution
High uptime
Professional charts
Quick support
Execution speed matters more than cosmetics.
C. Best for F&O / Options Traders
Important features:
Option chain
Greeks
Strategy builder
Margin calculator
Low-cost per order
D. Best for Investors (Long-Term)
Look for:
Zero delivery charges
Good research reports
Portfolio insights
Corporate action updates
IPO access
5. Checklist Before Finalizing a Broker
Here is a simple checklist you can use:
Is the broker regulated and reputed?
Are charges transparent?
Is the platform easy to use?
Does it offer your required market segments (equity/F&O/MCX/forex)?
Does it have strong charting tools?
Are there hidden charges?
Is customer support efficient?
Are deposits and withdrawals fast?
Are reviews and user feedback positive?
Are features aligned with your trading style?
Ticking all the above ensures the broker is reliable.
6. Common Mistakes to Avoid When Choosing a Broker
1. Choosing only based on low brokerage
Cheap doesn’t always mean good. Stability and reliability matter more.
2. Ignoring platform speed
A slow platform can cause slippage and unexpected losses.
3. Overlooking customer support
In fast-moving markets, delayed help can cost you money.
4. Not checking hidden charges
DP charges, demat AMC, platform subscription fees matter in the long run.
5. Not testing the platform before funding
Open the account, explore the app, check charting, and only then deposit money.
7. How to Test a Broker Before Final Decision
Sign up for a free account (most brokers allow this).
Explore the app/web platform.
Use virtual money or paper trading if available.
Test charting tools and order placement speed.
Ask customer support queries.
Check delay in withdrawals with a small amount.
After this test run, you’ll know whether the broker suits you or not.
8. Final Thoughts – Choose What Matches You
There is no universally “best” broker. The best broker is the one that fits your trading style, financial goals, and experience level. If you are a beginner, prioritize ease and learning. If you are an active trader, focus on execution speed and low costs. If you are an options trader, tools like strategy builders and Greek calculators are essential.
Take your time to research, compare, and test before finalizing. A good broker can support your trading journey, while a wrong one can create obstacles. The right platform will help you trade confidently, grow consistently, and manage risk effectively.

Central Bank Impact on the Global Market1. Monetary Policy and Global Liquidity
The most direct way central banks impact the global economy is through monetary policy, which includes interest rate changes and balance sheet operations.
a. Interest Rate Decisions
When a major central bank changes its policy interest rate, it alters the global cost of capital. For example:
If the Federal Reserve raises interest rates, borrowing becomes expensive not only in the United States but across global markets that depend on dollar funding.
Higher rates cause international investors to pull money from emerging markets and invest in U.S. assets for better yields, leading to:
Capital outflows from emerging markets,
Currency depreciation in developing countries,
Rising borrowing costs globally.
Conversely, when central banks cut rates, global liquidity expands, and risk assets such as stocks and commodities usually rally.
b. Quantitative Easing (QE) and Balance Sheet Expansion
During crises, major central banks purchase government bonds, corporate bonds, or other assets to inject liquidity. This boosts global risk appetite because:
Investors search for higher returns,
Global asset prices rise,
Borrowing becomes cheaper worldwide.
For instance, QE by the Fed after the 2008 financial crisis and during the COVID-19 pandemic lowered global interest rates and caused a surge in liquidity across world markets.
2. Exchange Rate Movements and Currency Policy
Central banks significantly influence exchange rates, which directly affect global trade and capital flows.
a. Currency Appreciation/Depreciation
When a central bank tightens policy (raising rates), its currency usually strengthens. A strong currency has global implications:
It makes imports cheaper but exports more expensive,
It can create competitive pressures for trading partners,
It may cause global commodity prices (priced in that currency) to fluctuate.
For example, a strong U.S. dollar typically:
Pushes global commodity prices downward,
Makes emerging market debt harder to repay,
Reduces global trade volumes due to expensive financing.
On the other hand, loose monetary policy causes currency depreciation, supporting export competitiveness and global trade flows.
b. Currency Interventions
Some central banks actively intervene in currency markets. For example:
The Bank of Japan intervenes to curb excessive appreciation of the yen.
The People’s Bank of China regulates the yuan to maintain stability for its export-driven economy.
Such interventions influence global currency markets, cross-border investments, and international trade competitiveness.
3. Impact on Global Financial Markets
Central bank decisions directly affect global stock markets, bond markets, commodities, and derivatives.
a. Stock Markets
Lower interest rates generally boost global stock indexes by:
Reducing discount rates used in valuation,
Increasing corporate borrowing capacity,
Encouraging investment in risk assets.
Conversely, rate hikes lead to global stock market corrections, especially in sectors sensitive to financing such as technology, real estate, and banking.
b. Bond Markets
Central banks influence:
Government bond yields,
Corporate bond spreads,
Global fixed-income returns.
When central banks signal future rate hikes, global bond yields rise, causing bond prices to fall.
c. Commodity Markets
Since many commodities are priced in dollars, the Federal Reserve’s monetary policy strongly affects global commodity cycles. A stronger dollar generally leads to weaker demand for commodities like oil, gold, and metals.
4. Inflation Control and Global Price Stability
Inflation dynamics in one major economy can spill over into global markets due to interconnected supply chains and energy markets.
a. Inflation Targeting
Most central banks aim to keep inflation around a target (usually 2%). When inflation rises, central banks:
Tighten monetary policy,
Reduce liquidity,
Increase borrowing costs globally.
This can slow global trade and investment.
b. Import and Export Inflation
A country’s inflation can be influenced by foreign price levels. For example:
Rising global oil prices cause inflation in energy-importing countries.
High U.S. inflation increases import costs for other countries.
Central bank responses to inflation therefore have global implications.
5. Financial Stability and Crisis Management
Central banks act as lenders of last resort during financial crises, helping prevent global contagion.
a. Liquidity Backstops
During crises, central banks inject emergency liquidity to stabilize markets. For example:
The Fed provides dollar swap lines to global central banks to prevent shortages of dollar liquidity.
The ECB creates special financing programs during European debt crises.
This helps avoid widespread defaults and maintains confidence in global finance.
b. Regulation and Macroprudential Policy
Central banks oversee:
Bank capital requirements,
Stress testing,
Systemic risk monitoring.
Stronger regulations in major economies (like Basel III norms) influence global banking practices.
6. Influence Through Forward Guidance
Modern central banks use communication as a policy tool.
a. Market Expectations
Central bank speeches, press releases, and meeting minutes shape expectations around future policy. Global financial markets react instantly to:
Hawkish statements (more tightening),
Dovish statements (more easing).
For example, a single speech by the Federal Reserve Chair can move stock markets, bond yields, and currencies worldwide.
b. Transparency and Credibility
Consistent communication enhances global confidence and reduces volatility. Uncertain or contradictory statements can cause major market swings.
7. Coordination Between Central Banks
Sometimes central banks coordinate policy actions to stabilize the global market.
a. Joint Rate Cuts
During the 2008 crisis, multiple central banks cut rates simultaneously to restore confidence.
b. Swap Lines
Currency swap lines ensure smooth functioning of global payment systems.
c. Global Regulatory Standards
Central banks collaborate through bodies like the Bank for International Settlements (BIS) to maintain financial stability.
8. Impact on Emerging Markets
Emerging markets are often the most affected by major central bank decisions.
a. Capital Flows
Tighter policy in the U.S. causes:
Outflows from emerging markets,
Weakening currencies,
Rising inflation and borrowing costs.
b. External Debt Burden
Many emerging markets have dollar-denominated debt. A stronger dollar increases repayment burdens.
c. Trade Impact
Fluctuations in exchange rates influence export competitiveness and trade balances.
Conclusion
Central banks play a decisive role in shaping the global economic and financial environment. Through interest rate decisions, liquidity management, currency policy, and crisis interventions, they influence everything from global stock markets and capital flows to trade balances and inflation levels. In an interconnected world, the decisions of major central banks have far-reaching implications not just domestically but across the entire global market. As the global economy becomes more integrated, the influence of central banks will continue to grow, making their policies a key factor for investors, businesses, and governments worldwide.
CBDCs in the World Trading System1. What Are CBDCs?
A CBDC is a digital form of legal tender issued by a country’s central bank. It is:
Sovereign-backed
Regulated and stable
A digital liability of the central bank
Designed for domestic and international use
CBDCs generally come in two forms:
Retail CBDCs – used by the general public for everyday transactions.
Wholesale CBDCs – used by financial institutions for large-value payments and settlements.
In the context of world trade, wholesale CBDCs hold greater significance due to their ability to streamline international payments and reduce reliance on intermediary banking systems.
2. Current Problems in the World Trading and Payment System
Before understanding the value of CBDCs, it's important to consider the limitations of the existing trading and settlement framework:
a. High Cost of Cross-Border Payments
International transactions often involve multiple banks, SWIFT messaging, and correspondent banking networks. This leads to:
Expensive transfer fees
Slow processing times
Reliance on intermediaries
b. Dollar-Dominated Global Trade
Over 80% of global trade is invoiced in USD. This creates:
Dependency on US monetary policy
Currency risk for emerging markets
High demand for dollar liquidity
c. Slow Settlement Processes
Cross-border trade can take days to settle due to:
Time zone differences
Compliance checks
Lack of common settlement rails
d. Fragmented Financial Infrastructure
Different countries use incompatible regulations, payment systems, and messaging formats, making interoperability difficult.
CBDCs are considered a strategic solution to all these challenges.
3. How CBDCs Can Transform the World Trading System
CBDCs have the potential to reshape global trade in multiple ways.
a. Instant and Low-Cost Cross-Border Settlements
CBDCs can enable near-instant settlements by connecting central bank systems directly through digital ledger technology (DLT).
Benefits:
Reduced transaction fees
Faster trade finance processes
Lower counterparty and settlement risk
b. Reduced Dependence on Intermediaries
Traditional cross-border payments rely on correspondent banks. CBDCs, however, enable:
Direct central bank-to-central bank transactions
Fewer intermediaries
Reduced complexity in the payments chain
This leads to greater efficiency and transparency.
c. Enhanced Transparency and Anti-Fraud Controls
CBDCs allow full traceability. This is advantageous for global trade because:
Money laundering can be detected easily
Fraud and trade-based financial crimes reduce
Compliance becomes more automated
With programmable features, central banks can embed smart compliance rules into the currency itself.
d. Strengthening of Local Currencies in Trade
If CBDCs become interoperable, nations may settle trades in their own currency instead of relying on USD.
This will help countries:
Reduce dollar exposure
Stabilize local exchange rates
Enhance monetary sovereignty
China’s Digital Yuan (e-CNY) is already being tested for cross-border trade to promote Yuan internationalization.
e. Programmability in Trade Finance
CBDCs can support programmable smart contracts, enabling automated trade functions such as:
Conditional payments
Automated customs clearance
Real-time shipment tracking linked to payment triggers
Smart invoices and escrow systems
This reduces human error, delays, and contract disputes.
4. CBDCs and Global Trade Networks
a. Interoperability Projects
Many global initiatives aim to connect CBDCs across borders:
mBridge (Hong Kong, China, UAE, Thailand, BIS)
Project Dunbar (Australia, Malaysia, Singapore, South Africa)
Project Icebreaker (BIS, Sweden, Norway, Israel)
These projects test how CBDCs can settle international trade without SWIFT.
b. Digital Trade Corridors
CBDC-enabled digital trade corridors can make it easier for regions to conduct business without dependency on legacy systems. They also facilitate:
Bilateral and multilateral trade agreements
Currency swap arrangements
Real-time settlement layers
c. Impact on SWIFT and Correspondent Banking
CBDCs could reduce global reliance on SWIFT. Although SWIFT is adapting through digital integration, CBDCs bypass many of SWIFT’s limitations.
5. Challenges and Risks of CBDCs in World Trade
Despite their potential, CBDCs face significant challenges.
a. Lack of Global Standards
Without common frameworks for:
Cybersecurity
Privacy
Settlement rules
Regulatory alignment
interoperability will be limited.
b. Cybersecurity Concerns
CBDCs increase vulnerability to:
Cross-border cyber-attacks
Systemic risk if central bank networks fail
State-sponsored digital warfare
c. Geopolitical Competition
Countries may use CBDCs to:
Avoid sanctions
Reduce dependence on dominant currencies
Create regional trade blocs
This could reshape global power balances.
d. Privacy Concerns
Governments may monitor transactions too closely, raising:
Data security issues
User privacy concerns
Risks of misuse of financial information
e. Impact on Commercial Banks
If businesses prefer using CBDCs for trade:
Commercial banks may lose transaction revenue
Deposits could shift away from banks
Banks may face funding pressure
Central banks must balance innovation without destabilizing financial institutions.
6. Future of CBDCs in the World Trading System
CBDCs are still in their experimental stage, but global momentum is strong:
Over 130 countries are exploring CBDCs
Over 20 countries are in pilot or launch phases
Major economies like China, India, UAE, and the EU are leading adoption
CBDCs will likely become a core settlement infrastructure in global trade within the next decade.
Future expectations:
CBDC-based trade hubs in Asia and the Middle East
Digital currencies replacing letters of credit (LCs)
Automation of global supply chain finance
Programmable trade contracts integrated into logistics systems
Rise of multi-CBDC platforms creating a unified digital trade layer
Conclusion
CBDCs represent a revolutionary step in the evolution of the world trading system. By providing a faster, cheaper, and more transparent method of cross-border settlement, CBDCs have the power to significantly reduce inefficiencies in global trade. They also promote monetary sovereignty, reduce dependence on the US dollar, and enable programmable trade finance. Although challenges such as cybersecurity, privacy, and geopolitical tensions persist, the direction of global finance clearly indicates that CBDCs will play a major role in shaping the future of international commerce.
Capital Flows: Concept and Characteristics1. Concept of Capital Flows
Definition
Capital flows refer to the movement of financial resources between countries. These resources include investments in financial markets, real assets, loans, and banking transfers. The underlying motivation behind these flows is to seek higher returns, diversify risks, fund economic development, or benefit from interest rate differentials and exchange rate expectations.
In macroeconomic terms, capital flows form the capital account and financial account of a country’s balance of payments (BoP). When foreign investors invest in a country, it records capital inflows. When domestic investors invest abroad, it results in capital outflows.
Types of Capital Flows
Capital flows can be broadly categorized into two major types:
A. Foreign Direct Investment (FDI)
FDI involves long-term investments where a foreign entity acquires ownership or controlling stake in a domestic company. Examples include:
Setting up factories
Buying significant equity in a foreign company
Mergers and acquisitions
FDI is typically stable, growth-enhancing, and associated with technology transfer and employment generation.
B. Foreign Portfolio Investment (FPI)
These are investments in financial assets such as stocks, bonds, and other securities without acquiring management control. FPIs are highly liquid and sensitive to:
Interest rates
Market sentiment
Global financial conditions
Due to their volatility, FPIs are often called hot money flows.
C. Other Capital Flows
Bank loans and deposits
External commercial borrowings (ECBs)
Sovereign bond purchases
Remittances (often classified separately)
Short-term speculative flows
2. Importance of Capital Flows in the Global Economy
A. Financing Development
Capital flows help developing economies fill investment gaps. Low domestic savings often restrict capital formation, and foreign investment helps fund infrastructure, manufacturing, and services.
B. Enhancing Financial Market Efficiency
Global capital flows integrate financial markets, increasing liquidity and improving price discovery. This allows companies to raise funds more efficiently and reduces the cost of capital.
C. Boosting Productivity and Innovation
FDI brings new technologies, management practices, and skills that enhance productivity. Exposure to global competition also pushes domestic firms to innovate and modernize.
D. Supporting Balance of Payments Stability
Capital inflows help countries finance current account deficits. For example, if a nation imports more than it exports, foreign investments can help cover the gap.
E. Influencing Exchange Rates
Large inflows appreciate the domestic currency, while outflows lead to depreciation. Exchange rate movements, in turn, influence trade competitiveness and inflation.
3. Characteristics of Capital Flows
Capital flows vary in size, stability, duration, and impact. The following are key characteristics that define their behavior:
A. Mobility
In today’s digital, globalized financial system, capital flows are highly mobile. Investors can shift funds across borders with the click of a button. This mobility increases liquidity but also contributes to volatility.
For instance:
Rising US interest rates may trigger outflows from emerging markets within hours.
A geopolitical tension may cause investors to rapidly move towards safe-haven assets like gold or US Treasury bonds.
B. Volatility
Not all capital flows are stable. Portfolio investments, short-term loans, and speculative flows are extremely sensitive to:
Global interest rate changes
Investor sentiment
Currency movements
Political stability
A sudden reversal of flows can trigger financial instability, known as capital flight. Emerging markets are especially vulnerable because their financial systems are relatively smaller and more fragile.
C. Risk–Return Driven
The direction of capital flows is predominantly determined by risk–return calculations. Investors compare:
Interest rate differentials (e.g., “carry trade”)
Expected currency changes
Economic growth prospects
Political risks
Financial stability metrics
Countries with stable policies, higher returns, and sound macroeconomics attract more inflows.
D. Impact on Currency and Exchange Rates
Large capital inflows strengthen the domestic currency because foreign investors must purchase local currency to invest. This can lead to:
Cheaper imports
More expensive exports
On the other hand, capital outflows weaken the currency, sometimes resulting in inflationary pressures.
E. Short-Term vs. Long-Term Nature
Capital flows differ in duration:
FDI is long-term, stable, and less likely to exit suddenly.
Portfolio flows are short-term and highly reversible.
Short-term debts increase vulnerability during crises.
Countries with higher shares of short-term external debt face greater risks during global financial shocks.
F. Pro-Cyclicality
Capital flows often move in tandem with global economic cycles:
During global booms, flows rush into emerging markets seeking higher returns.
During recessions or crises, investors retreat to safer assets (“flight to safety”).
This pro-cyclical nature can amplify economic fluctuations in recipient countries.
G. Influence of Global Liquidity Conditions
Global financial conditions, especially monetary policies of major central banks like the US Federal Reserve and ECB, heavily influence the magnitude and direction of capital flows.
For example:
Low interest rates in the U.S. push investors toward emerging markets for higher yields.
Tightening monetary policy triggers widespread outflows.
H. Policy Sensitivity
Capital flows respond quickly to changes in:
Tax policies
Capital control regulations
FDI norms
Banking sector reforms
Political developments
Stable and transparent policies attract long-term capital, while unpredictable regulations discourage investors.
I. Impact on Domestic Financial Stability
Large capital inflows can create:
Asset bubbles (stocks, real estate)
Credit booms
Over-leveraging
Similarly, sharp outflows can lead to:
Currency crashes
Stock market declines
Liquidity shortages
Thus, managing capital flows is crucial to financial stability.
4. Policy Tools to Manage Capital Flows
Countries use several strategies to handle volatile capital movements:
A. Capital Controls
Restrictions on inflows or outflows to reduce vulnerabilities.
Examples:
Limits on foreign ownership
Taxes on short-term flows
Minimum holding periods
B. Exchange Rate Interventions
Central banks may buy or sell foreign currency to stabilize exchange rates.
C. Macroprudential Policies
Limits on external borrowing
Stress tests for banks
Higher reserve requirements
D. Building Forex Reserves
Large reserves help soften the impact of outflows and boost investor confidence.
Conclusion
Capital flows are a vital engine of global economic growth and integration. They help countries access investment, improve productivity, strengthen financial markets, and support development. At the same time, their volatility, mobility, and sensitivity to global events pose significant risks, especially for developing economies.
Understanding the concept, types, and characteristics of capital flows is essential for designing effective policies that maximize benefits while reducing vulnerabilities. Proper management of these flows enables countries to achieve sustainable economic growth and maintain financial stability in a highly interconnected world.