Is There the Best Moving Average For Swing Trading?Is There the Best Moving Average For Swing Trading?
In swing trading, moving averages are widely used to analyse market trends and identify potential turning points. In this article, we’ll dive into the most commonly used MAs, their unique characteristics, and how they can be applied in swing trading strategies.
What Are Moving Averages?
You definitely know what moving averages are. However, we need to start our article with a brief introduction to this market analysis tool.
A moving average (MA) is a fundamental tool in technical analysis that helps traders understand the direction of a market trend by smoothing out price fluctuations, often touted among the best indicators for swing trading. Instead of focusing on the volatile ups and downs, MAs calculate an average of prices over a specific period, such as 20, 50, or 200 periods. This gives traders a clearer picture of the overall trend by filtering out short-term volatility.
There are different types of moving averages, but they all work on the same principle: tracking the average price over time to highlight the market's trajectory. For example, a 20-period MA shows the average (usually closing price but a trader can choose highs, lows, and opens) over the past 20 periods, updating as new prices come in. This rolling calculation creates a line on the chart, making it easy to identify whether the market is trending upwards, downwards, or moving sideways.
Types of Moving Averages
Moving averages come in various forms, each with unique characteristics that cater to different trading styles and strategies.
Simple Moving Average (SMA)
The simple moving average (SMA) is the most straightforward type, calculated by averaging the closing prices (but a trader can choose any price type) over a set number of periods. For example, a 20-period SMA adds up the last 20 closing prices and divides by 20. It’s popular among traders who want a broader view of price trends without overreacting to short-term fluctuations, making it a contender for one of the best moving averages for swing trading. However, SMAs can lag behind price action, as they give equal weight to all prices in the calculation.
Hull Moving Average (HMA)
The hull moving average (HMA) is designed to reduce lag while maintaining a smooth line. By combining weighted averages with additional smoothing techniques, the HMA offers a balance of speed and clarity, making it an underrated moving average for swing trading.
Exponential Moving Average (EMA)
The exponential moving average (EMA) prioritises recent prices, giving them more weight in the calculation. This makes it more responsive to price changes compared to the SMA. Swing traders often use EMAs in faster-moving markets, where quick adjustments to trend shifts are crucial, with 8- and 21-period EMAs considered by some traders as two of the best EMAs for swing trading. For instance, a 20-period EMA reacts faster to sudden price movements than a 20-period SMA, helping traders spot potential reversals sooner.
Weighted Moving Average (WMA)
Similar to the EMA, the weighted moving average (WMA) also gives more importance to recent prices but does so with a linear weighting system. This means the most recent price has the greatest impact, gradually decreasing with older data. WMAs are less common but useful when traders want a more precise reflection of recent price action.
How to Use Moving Averages in Swing Analysis and Trading
Moving averages are versatile tools that can provide valuable insights for swing traders. Beyond highlighting trends, they can help identify potential turning points and dynamic support or resistance levels. Here’s how they’re commonly used in swing trading:
1. Identifying Trends
MAs are widely used to assess the direction of a trend. For instance, if the price consistently stays above a rising moving average, it suggests an upward trend. Conversely, when prices remain below a declining moving average, the market could be trending downward. Swing traders often rely on shorter moving averages, like the 20-period, for identifying trends that align with their trading horizon.
2. Spotting Reversals with Crossovers
Crossovers happen when two MAs intersect. A common example is a shorter MA crossing above a longer one, which may indicate a shift towards bullish momentum and vice versa.
3. Dynamic Support and Resistance
MAs act as floating support and resistance levels. MAs serve as a support level in an uptrend, with the price bouncing off it repeatedly. In a downtrend, the same moving average might act as resistance, limiting upward moves.
4. Filtering Market Noise
In choppy markets, MAs can smooth out minor fluctuations, making it easier to focus on the bigger picture. Swing traders often use longer MAs, such as the 50-day or 200-day, to filter out irrelevant short-term movements.
5. Timing Entry and Exit Zones
Many traders use crossovers to time their entries and exits, though it’s worth noting their lagging nature means they can result in untimely trades. They can also provide context. For example, if the price approaches a key moving average after a strong move, it might indicate a consolidation phase or a potential reversal, allowing traders to adapt their analysis.
Common Moving Averages for Swing Trading: The 20, 50, and 200 MAs
Swing traders often turn to the 20-, 50-, and 200-period moving averages as their go-to tools for analysing market trends. Each serves a specific purpose, helping traders gauge short-, medium-, and long-term price movements. These moving averages are often used together.
20-Period Moving Average
The 20-period MA is a favourite for short-term trend analysis. It reacts quickly to price changes; therefore, traders use it to identify recent momentum or potential trend shifts. Traders frequently watch for price “bounces” off the 20-period MA as potential indications of continuation in the current trend.
50-Period Moving Average
The 50-period MA provides a medium-term perspective, offering a smoother look at price trends. It’s slower to react than the 20-period MA but avoids being overly lagging. This balance makes it useful for identifying sustained trends while filtering out minor price noise. When prices interact with the 50-period MA, it often acts as a dynamic support or resistance level.
200-Period Moving Average
The 200-period MA is the benchmark for long-term trend analysis. It’s often used to determine the overall market direction. This MA is also a widely followed indicator for institutional traders, adding weight to its significance. Interactions with the 200-period MA often mark key turning points or areas of consolidation.
Traders also monitor crossovers between the 50- and 200-period MAs, recognised by some as the best moving average crossover for swing trading. For instance:
- Golden Cross: When the 50-period MA crosses above the 200-period MA, it suggests potential bullish momentum.
- Death Cross: When the 50-period MA drops below the 200-period MA, it signals a possible bearish shift.
Using Them Together
Using the 20-, 50-, and 200-period MAs together offers a comprehensive approach to identifying the best moving average crossover setups, allowing traders to see the bigger picture while still tracking short-term shifts. For instance, when the price breaks above the 200-period MA while the 20-period MA crosses above the 50-period MA, it may signal the beginning of a broader bullish trend. Meanwhile, a price drop below all three MAs could suggest broader bearish momentum.
Other Moving Average Combinations for Swing Trading
While the 20, 50, and 200-period MAs are staples in swing trading, exploring other combinations can offer nuanced insights tailored to specific trading strategies. Some alternative moving average setups that traders often employ include:
8-Period and 21-Period Exponential Moving Averages (EMAs)
This pairing is favoured by traders seeking to capture short-term price movements with greater sensitivity. They call this the best EMA crossover strategy. The 8-period EMA responds swiftly to recent price changes, while the 21-period EMA provides a slightly broader perspective.
10-Period and 50-Period Simple Moving Averages (SMAs)
Combining the 10- and 50-period SMAs offers a balance between short-term agility and medium-term trend identification. This combination helps traders filter out minor price fluctuations and focus on more sustained movements.
28-Period and 50-Period HMAs
For traders focused on short-to-medium-term trends, the 28- and 50-period HMAs offer a balanced approach. The 28-period HMA reacts quickly to price changes, while the 50-period HMA provides a steadier view of the broader trend. Crossovers between the two can signal potential bullish or bearish momentum shifts, benefiting from the HMA’s reduced lag.
13-Period and 34-Period WMAs
Rooted in Fibonacci sequences, the 13- and 34-period WMAs are employed by traders who believe in the natural rhythm of the markets. A 55-period WMA can also be included for a longer-term perspective. Crossovers between these WMAs can highlight potential trend reversals or continuations, with the WMA adapting more quickly than other MAs due to its weighted calculation.
Implementing These Combinations
When applying these moving average combinations, it's crucial to consider the following:
- Market Conditions: These combinations often perform better in trending markets versus ranging markets. Moreover, shorter MAs might be more effective in capturing quick price movements during high volatility.
- Timeframes: Traders align MAs with their trading horizon. Shorter periods like the 5-period or 8-period MAs are usually used by traders focusing on brief swings, while longer periods like the 50-period MA cater to those looking at extended trends.
- Confirmation with Other Indicators: Relying solely on moving averages can lead to false signals. Traders corroborate these signals with other technical indicators, such as Bollinger Bands or the Relative Strength Index (RSI).
What Moving Averages Should You Use for Swing Trading?
There is no best moving average for swing trading. The choice of MAs ultimately depends on a trader's strategy and preferences. The combinations discussed provide a framework, but experimenting with different setups can help identify what aligns with individual trading styles and objectives.
The Bottom Line
Moving averages are powerful tools for swing trading, offering insights into trends and potential market turning points. Whatever your unique preference for different types and lengths, understanding their application can refine your strategy.
FAQ
Which Moving Average Is Good for Swing Trading?
The 20-period, 50-period, and 200-period moving averages are widely used in swing trading. However, different combinations, like the 8- and 21-period or 13- and 34-period MAs can offer equally valuable insights; it ultimately comes down to the trader’s preference.
What Is the Most Popular Moving Average to Use?
The most popular moving average depends on a trader’s trading style and goals. Shorter MAs, like the 20-day MA, are popular for quick trend identification, while longer ones, such as the 200-day MA, provide a bigger picture. Many traders combine MAs to cover different timeframes.
Is 200 EMA Good for Swing Trading?
The 200-period EMA is useful for swing traders seeking to understand long-term trends. It reacts faster than the 200-period SMA, making it suitable for traders looking to incorporate a responsive indicator in their analysis.
Which Indicator Is Most Popular for Swing Trading?
There isn’t a single best indicator for swing trading. Moving averages, RSI, MACD, and volume indicators are commonly used. Combining these can provide a more comprehensive analysis.
Which Volume Indicator Is Popular for Swing Trading?
The On-Balance Volume (OBV) and Volume Weighted Average Price (VWAP) are popular volume indicators for swing traders, helping assess market momentum.
Which RSI Indicator Is Popular for Swing Trading?
The standard 14-period RSI is widely used. Swing traders often adjust it to shorter periods (e.g., 7) for faster signals or longer periods (e.g., 21) for smoother trends.
This article represents the opinion of the Companies operating under the FXOpen brand only. It is not to be construed as an offer, solicitation, or recommendation with respect to products and services provided by the Companies operating under the FXOpen brand, nor is it to be considered financial advice.
Swingtrade

Swing Trading: Unique Features and StrategiesSwing Trading: Unique Features and Strategies
Swing trading stands out as a dynamic approach in the trading world, blending elements of both short-term and long-term strategies. In this article, we will explore the unique features of swing trading, including its reliance on technical analysis, the use of chart patterns, and the strategic timing of entries and exits. Whether you're new to trading or seeking to refine your approach, understanding the nuances of swing trading can provide valuable insights into navigating the financial markets.
The Basics of Swing Trading
Swing trading meaning refers to a style that involves holding short- and medium-term positions - usually from a couple of days to a few weeks - with the aim of capitalising on the “swings” in the market.
What is a swing trader? A swing trader’s definition is simple: swing traders are those who typically enter and exit markets at significant support and resistance levels, hoping to capture the bulk of expected moves.
These traders tend to look at hourly to weekly charts to guide their entries, although the timeframe used will depend on the swing trader’s individual approach and the asset being traded. Swing trading can be used across all asset classes, from stocks and forex to cryptocurrencies* and commodities. In the stock market, swing trading can be especially effective, as stocks tend to experience high volatility and are subject to frequent news and events that can drive prices.
Swing traders predominantly use technical analysis to determine their entries and exits, but fundamental analysis, like comparing the interest rates of two economies, can also play a significant role. It can help determine a price direction over the course of days or weeks.
Swing Trading vs Other Styles
To better understand the unique features of swing trading, let’s compare it with our styles.
Position trading involves holding trades for weeks and months, focusing on capturing long-term trends. Position traders are less concerned with short-term fluctuations and are more likely to use fundamental analysis, such as economic data and company earnings, to make their decisions. This style requires patience and a long-term perspective, with fewer trades but potentially larger returns per trade.
Swing trading involves holding trades for several days to a few weeks, aiming to capture short- and medium-term price movements within a larger trend. This style balances the need for active market participation with the flexibility to not monitor trades constantly. Swing traders primarily rely on technical analysis to identify entry and exit points, focusing on chart patterns and indicators.
Day trading requires traders to buy and sell assets within the same trading day, often holding positions for just minutes or hours. The goal is to capitalise on intraday price movements, and traders close all positions before the market closes to avoid overnight risk. This style demands constant market monitoring and quick decision-making, with a strong reliance on real-time technical analysis.
Scalping is an ultra-short-term trading style where positions are held for seconds to minutes, aiming to make small profits on numerous trades throughout the day. Scalpers rely almost entirely on technical analysis and need to act quickly, often executing dozens or hundreds of trades daily. The focus is on high-frequency trading with very tight stop-losses, requiring intense concentration.
Swing Trading: Benefits and Challenges
Although swing trading provides numerous opportunities which makes it popular among traders, it comes with a few challenges traders should be aware of.
Benefits:
- Lower Time Commitment. One of the most significant benefits for swing traders is the reduced time commitment. This style can be adapted to suit a trader’s individual schedule.
- Flexibility. It is often more flexible than other styles. Not only does it offer time flexibility, but it allows for a wider range of tools to be used to determine price swings. Also, it can be applied to many assets. The most common is swing trading in forex and swing trading in stocks.
- Technical Analysis Focus: Utilises technical indicators and chart patterns to identify entry and exit points, providing clear criteria for decision-making.
- More Opportunities Compared to Long-Term Techniques. Because swing traders usually hold positions for a few days to a few weeks, they have the ability to take advantage of shorter-term market movements that might not be reflected in longer-term price trends.
Challenges:
- Exposure to Overnight Risk. Positions held overnight or over weekends can be affected by unexpected news or events, leading to potential gaps or adverse price movements.
- Requires Patience: Effective swing trading requires waiting for trades to develop over days or weeks, which may test a trader's patience.
- Market Volatility: Performance can be impacted by periods of low volatility or choppy markets, where price movements may not align with your expectations.
Popular Tools to Use When Swing Trading
The effectiveness of a swing traders’ strategies will ultimately depend on their ability to correctly identify price movements. For this, traders use different chart patterns and technical indicators. Here are three common tools that can be used as part of a swing trading strategy.
Channels
Traders can use channels to take advantage of well-identified price trends that play out over days and weeks. To plot a channel, you first need to identify a trending asset that’s moving in a relative zig-zag pattern rather than one with large jumps in price. Traders will often use the channel to open a swing trade in the direction of the trend; in the example above, they might look to buy when the price tests the lower line and take profit when the price touches the upper line of the channel.
Moving Averages
Moving averages (MAs) are one of the commonly used indicators and they can help swing traders determine the direction of the trend at a glance. The options here are endless:
- You could pair fast and slow moving averages and wait for the two to cross; this is known as a moving average crossover. When a shorter MA crosses above a longer one, the price is expected to rise. Conversely, when a shorter MA breaks below a longer one, the price is supposed to decline.
- You could stick with one and observe whether the price is above or below its average to gauge the trend. When the price is above the MA, it’s an uptrend; when it’s below the MA, it’s a downtrend.
- You could use an MA as a support or resistance level, placing a buy order when the price falls to the MA in an uptrend and a sell order when it rises to the MA in a downtrend.
Fibonacci Retracements
Lastly, many swing traders look to enter pullbacks in a larger trend. One of the most popular ways to identify entry levels during these pullbacks is the Fibonacci Retracement tool. Traders typically wait for a shift in price direction, then apply the tool to a swing high and swing low. Then, they enter at a pullback, usually to the 0.5 or 0.618 levels, to take advantage of the continuation of the trend. As seen above, this strategy can offer entry points for those looking to get in early before a trend continues.
The Bottom Line
Swing trading stands out for its ability to balance the demands of active trading with the flexibility of longer-term investing. The unique features of swing trading, such as its moderate holding periods and strategic use of technical indicators, allow traders to potentially manage risk and adapt to various market conditions. Embracing swing trading strategies can help traders refine their approach. As with any trading style, continued learning and disciplined execution are key to achieving consistent results.
FAQ
What Is Swing Trading?
Swing trading is a style that involves holding positions over a period of several days to weeks to take advantage of price movements within a trend. Swing traders use technical analysis, including chart patterns and indicators, to identify potential entry and exit points, balancing the need for active participation with a longer-term perspective.
What Is Swing Trading vs Day Trading?
Swing trading and day trading are distinct methods. The former focuses on capturing price movements over several days to weeks, allowing for less frequent trading and requiring less constant market monitoring. In contrast, the latter involves buying and selling assets within the same trading day, often holding positions for minutes or hours, and requires continuous market observation and quick decision-making.
What Is the Downside of Swing Trading?
The downsides of swing trading include exposure to overnight and weekend risks, as positions held outside market hours can be affected by unexpected news or events. Additionally, this method requires patience and discipline, as trades may take time to develop, and performance can be impacted by periods of low volatility or choppy markets.
*Important: At FXOpen UK, Cryptocurrency trading via CFDs is only available to our Professional clients. They are not available for trading by Retail clients. To find out more information about how this may affect you, please get in touch with our team.
This article represents the opinion of the Companies operating under the FXOpen brand only. It is not to be construed as an offer, solicitation, or recommendation with respect to products and services provided by the Companies operating under the FXOpen brand, nor is it to be considered financial advice.

Gaps and How Markets Move In Contraction and ExpansionThere are several ways to trade gaps but first, there should be a solid understanding of what Gaps are and how they show up. Markets aren't that hard to read if we have some simple ways to see them that adhere to the principles of movement.
All markets move in contraction and expansion. A Gap is the sudden supply/demand imbalance that comes out of the contraction and shows up as the expansion. These expansions can even be used to measure how far the next expansion will go.
Start with a simple bar chart and erase everything else off the chart. Look and simply see the dense areas of contraction (Range). Then see the expansion (Gap), followed by another contraction.
Look for same-size contractions and expansion and you will start to see how organized price flow can be. It's no different than swings in that minor contractions and expansions make up the major contractions and expansions.
Shane

HOLDING UP MY 3 SWING POSITIONSWe are almost done with the first week of the year 2024, and still, my 3 open swing positions are holding up.
Currently, if I close all these 3 positions now, the results will generally GAIN.
I will keep holding this as long as the market does not hit my SL and TSL.
Happy Trading everyone in this Community!!!

How to Day Trade or Swing Trade S&P500 Part 2Hey Traders,
So this is part 2 of the previous strategy I talked about with the stock indexes. I used to trade the Forex, Commodities, Crypto and other markets. But in my opinion these stock indexes are the best markets of the all to trade because they move daily with strong volume and give you multiple trading opportunites. So lets look at now how we can truly fine tune this strategy and turn it into a great method. In the future I believe I will only focus on trading the stock indexes S&P500, Nasdaq 100 and Russell 2000.
Enjoy!
Trade Well,
Clifford

🔻 How To Swing Trade In A Bear Market 🔻Forex traders that decide to trade in a bear market are looking for a strategy or a way to make a profit when markets are falling. But, is it possible to swing trade in a bear market? It is. The most used strategy in bear market trading is the swing strategy. Traders that want to swing trade must first understand the swing trade meaning. Swing trade is a trading path that comes with challenges. While many traders prefer to stay profitable in a continuing bull market, many traders will choose to earn their profit by swing trading in the following bear market. Swing trading is challenging but can also be profitable in short-term intervals. A trader must know how to use the given signals from the market before starting to swing trade in a bear market.
How To Do Swing Trading
Traders often wonder how to swing trade forex, and the first thing to know is the swing trade definition first:
Swing trading is a type of trading style that focuses on profiting from changing trends in price action in short-term intervals. Swing trading is a trading strategy that involves holding a position long or short for more than one session. It can be from one day up, but not longer than several weeks.
Traders that use this strategy look to technical and fundamental analysis. They try to explore trading opportunities and analyze price trends and patterns. Considering the volatile conditions in the forex market, a swing trader tries to catch a potential price movement and make a small profit out of it. Generally, swing trading is a good strategy for beginners because they can trade with much less capital than the other trading strategies.
Is It Possible To Swing Trade In A Bear Market?
A bear market in forex means that prices fall 20% or more from recent highs, which gives the traders a negative outlook and hopelessness. A bear market is always caused by a group of developments or events such as monetary conditions, monetary policy, shifts in yield curves, and many others. The forex market is very volatile and changes very fast. It creates many opportunities to catch the momentum of price action and make a profit out of it. Swing trading is one of the trading options in a bear market.
Implementing a swing trading strategy for the bear market is one way for a forex trader to trade successfully. To swing trade profitably in a bear market, traders need to have a strategy likely to survive the changing market conditions. Swing trading in a bear market does work but usually can give the trader a tough time. Traders need to do a market analysis, research all historical data, and create a safe trading plan before going live.
What Is Swing Trading And Its Advantages?
Swing trading is a short-term trading strategy where you hold your trades for one day up to a few weeks at most. Swing traders use technical analysis, to make a trading plan, and a strategy for an entry and exit from the market. Swing trading can be divided into discretionary swing trading and systematic swing trading. From experience, traders have found systematic swing trading more efficient, as it has shown better results.
Advantages Of Swing Trading
Traders know their results quickly, from one day up to one month. They give time to work on the swing strategy and make changes on the next entry. The trader has a clear boundary because there is a specific area to observe, knowing exactly when the trade isn't working. Traders can easily limit the damage of a losing position. By entering and leaving the market in short periods, traders can identify a lot of opportunities. It allows the trader to spread the risk and minimize losses. It is important to mention that swing trading is a very good trading strategy for forex beginners and traders that are short on time.
Swing Trade Strategy For A Bear Market
Swing trading can make a trader's way much easier if they use one of the trading indicators and stick to it. The most are moving averages, Relative Strength Index (RSI), Stochastic Oscillator, and Volume. A trader has many options to create a swing trading strategy for bear market conditions. Traders also use mean reversion as the most common strategy type. In mean reversion, traders assume that the market will make some extreme moves to either side, and those moves are later corrected through a reversion to the mean. It means that the market tends to swing around its average. This strategy type, a mean reversion, is used to identify if the market is overbought or oversold. It is expected to give traders an entry signal.
A different swing trade strategy is trend following, which is the opposite of the mean reversion type. This strategy suggests following the trend of direction, which is harder to succeed with than the mean reversion type. The breakout strategy is another type of swing strategy that traders use. This strategy is similar to the trend following, and it works with a breakout level. When the currency pair breaks a level and continues above that level, it is a signal that the market is solid enough and will likely continue in the direction of the breakout. This strategy is functioning the same way as the trend-following strategy. Traders do not always buy on a breakout of a certain level. Often, traders try to include other conditions that are important in deciding whether to buy or sell.
Can Swing Traders Make Money In A Bear Market?
Not many traders choose to trade in a bear market because it signals pessimism, and it is hard to know how long it will last. In a bear market, the primary trend is to the downside, and different rules apply. Knowing the bear market trading rules can position traders to benefit from them. That gives light on the pessimism of a bear market. There are many opportunities to make money for traders that know how to use the given signals. Taking a bear short swing trade, also called short-selling, will help you to gain profit using a swing strategy during a bear market. Traders need to do pre-market research, then work up to potential trades before they make an entry position.

day trading forex strategies price action for beginnersIn this video, you will see me analyse my forex watchlists to look for trading opportunities
day trading for forex beginners
day trading forex strategies
forex day trading strategies for beginners
day trading forex strategies price action for beginners

How To Use Higher Time Frames To Swing TradeIf you struggle with what timeframes to analyze longer movements before entering trades, this video is for you.
I personally struggled with multiple timeframe analysis. I thought I had to use every timeframe to enter a trade. It wasn't until I got clear on the type of trader I was and stuck to two timeframes at a time is when the market began to become more clear to me. If you can relate this video is for you.

What Is Swing Trading and what are its advantages ?📊 What Is Swing Trading? 📊
━━━━━━━━━━━━━
Swing trading is a style of trading that attempts to capture short- to medium-term gains in a stock (or any financial instrument) over a period of a few days to several weeks. Swing traders primarily use technical analysis to look for trading opportunities. These traders may utilize fundamental analysis in addition to analyzing price trends and patterns.
━━━━━━━━━━━━━
📊 Advantages of Swing Trading 📊
━━━━━━━━━━━━━
🔴 It allows you to take advantage of the natural ebb and flow of markets. Financial markets never go in one direction forever, and by being able to take advantage of that, you can increase your returns as you in theory are going to be making money when the market rises over the next few days, and then make some when the market pulls back, as it will certainly do sooner or later.
🔴 By being in and out of the markets, you can identify more opportunities. If you look at any financial chart, you can see that there is almost always a definite long-term trend, but the market might not always be at a support or resistance area. By being in and out of the market in a matter of a few days, (typically) you can collect profits, and identify other markets that are setting up for other trades. This allows you to spread the risk around, and ties up a lot less capital instead of constantly having to come up with margin for new positions as you find new trades. By closing your first position, you will not have to deposit more money in your account to cover the second one.
🔴 Stop losses are typically smaller than longer term trades. The stop losses on a swing trade might be 100 pips based upon a 4 hour chart, while a stop loss on a weekly chart that is based upon the overall trend might have to be 400 pips. This allows for you to place larger sized positions instead of extremely low leveraged ones via the longer-term trends.

10 TIPS TO BECOME A PROFITABLE TRADERThe tips that I am about to give you can completely change your results as a trader and it can help you to start becoming a PROFITABLE TRADER or if you already is a profitable trader it can help you to increase your "win rate".
1 - Never blindly trust in the Moving Averages or any other indicator that you have set in your chart, it only takes a big spike on Bitcoin's price, or a lack of attention of your part to a bigger trend for you to be stoped in your trade.
2 - Always check your Moving Averages and other indicators in different time frames (1H, 4H, 1D, 1W), different time frames tell different stories.
3 - Identify the trend (Up, Down, Consolidation). Always look for the bigger picture.
4 - When all the MA in different time frames are giving you the same direction it's a positive sign for you to trade in the direction of that trend (but that's not the only way to use it and you need to take other indicators in consideration).
5 - DON'T EVER get in a trade just because the price went up or down 10% - 100%, first see the bigger picture (1M, 1W, 1D, 4H), then check your other indicators. Not doing it will make you lose a lot of money (constantly).
6 - Don't "FOMO" is your trades, that will make you lose a lot of money, patience is one of the most important attributes to become a profitable trader.
7 - ALWAYS check the Bitcoin chart before getting in a trade, if Bitcoin is close to a strong support and end up not holding on it and the price goes down it's very likely that other pairs of coins will go down as well.
8 - Don't get in trades that you are not sure about it, it's not worth it, sometimes you maybe right, but in the long term you will not be a profitable trader.
9 - You need to know the "Why" you are getting in that trade, and the "When" (exact moment that you will get in or out of the trade).
10 - You don't need to get into every single trade opportunity that you see, it's better to trade less with more quality trades than to trade a lot but making poor trading decisions.
The tips above are simple to understand and to apply and for some can sound really easy and common but unfortunately a lot of Traders are not practicing it or are not aware of it and not following this simple tips can lead you to failure really fast.
You will not necessarily become a profitable trader just by following this tips, but learnings and applying this tips is the beginning to a glorious path!
I'm using ADA/USDT as an example, the intent is not to predict if the price will go up or not, if the price goes 100% up or down tomorrow it doesn't make any difference. The purpose of the post is to open your eyes to see the big picture of things, to see that sometimes some indicators if not used correctly are not very helpful to our trades, to identify a trend despite the spikes of price, to understand that there are several thinks to be taken in consideration before getting in a trade, is for you to understand that patience is a key aspect to our success. My desire is that you understand that you need to be meticulous in all your analysis, trade less, win more.

NZD/CHF Long - 21 May 2021 | Hybrid Move Result: -1.00%Hey All,
The trade initiated from a Daily Counterzone stacked with a clean area of weekly demand as well perfect in my opinion with the main idea to break the daily trend and
continue the higher-timeframe bias to the upside. Overall the setup was pretty complex due to the Counterzone analysis, yet clear enough to find and edge.
The 4hour strategy was executed after price formed a clean star formation and exploded to the upside after some more deceleration. The 4hour started to create a small double bottom formation
with our automatic Hybrid Strategy entry when the 4hour star closed. At the daily time-frame prices reached the downward sloping trendline formation which was never broken to the upside, instead
price moved towards the downside creating a deeper daily lower low and continue the trend.
Good trade, good edge.

ETCUSD 2020 06 14ETCUSD
Wait for a close below 5.971 level before entering for sell. Possible double top pattern.

The reason why trading IS gambling (Why it's important)Hello everybody and welcome,
First of all, thank you for the interest you show.
The goal of this content, is to empower you with the tools you need to shift your psychology and level up your trading.
----------------------------------------------------------------------------------------------------------------------------------------------
Before we start, let me just say that I do not have any product to sell. My content is free and my only goal is to provide valuable information to help traders being more successful and consistent when trading.
------------------------------------------------------------------------------------------------------------------------------------------------
Some explanation regarding the introduction above :
What I want to emphasize through that example, is that often times, when trading, you will face losing streaks . It is inevitable and we can also assume that it is recurrent . It is important to note what happens in the mind of a trader : doubt .
Why ? Because of not accepting the fact that trading is gambling.
I know ... It might be hard to "accept" because people often times think that trading is all about skills, but it is not.
Let me explain :
When you trade, whether you are long or short, you rely on nothing else than other people to make profits. The problem is, you do not know if these people have the same convictions and beliefs as you do regarding what the market is going to do in the future.
So there's randomness involved in trading because every moment is unique, i.e. it involves different people.
But, if you have an edge, meaning a "strategy" that puts the odds in your favor (whatever it might be, trading pullbacks, momentum trading, morning panics, gap strategies, etc...) : YOU ARE THE HOUSE . You win over a LONG period of time no matter the outcome on a trade-to-trade basis.
Now, considering what we just said, should we care about what is going to happens to the trade I highlighted above ? Absolutely not. Why ? Because we have accepted the fact that the distribution between wins and losses is RANDOM in the market . Therefore, whatever the outcome is, we know, that we will be profitable in the long run.
Why does that actually matter ?
Well, it matters, because as I stated above, traders doubt when they encounter a losing streak. They question their edges, their skills, they start questioning their rules and strategies. What is likely to happen ? They blow their account.
Fear, the biggest enemy in trading
Apart from doubt, the trader that just has gone through 4,5,6,7 or more losses in a row, is afraid. He is afraid to put on that next trade, even though that trade could be a homerun and wipe all his losses.
Fear paralyzes us, it reduces our focus and narrows our attention to what we fear the most.
You probably recall the time when you put on a trade and you kept bagholding a loser, you were paralyzed, you just couldn't sell. There's a funny thing that happens everytime when you hold on to a loser, whenever you decide to sell, the market bounces back. This is because you are not alone on that boat and human psychology is universal.
Once you have accepted that, you will be able to focus 100% on your actual trading errors, which are related to your knowledge and your skills. You will never doubt or have a moment of indecision if your edge appear on the chart. You will take the trade and don't care at all what happens next, because you know that trying to figure out if it's going to work or not has no sense.
Thank you for taking the time to read me. I really appreciate that.
Make sure you comment below if you have questions or just wanna add something.
Thanks a lot,
MyTradingJournal

Analysis of Recent Winning 5th Wave Trade on GNRCOn October 15th 2019 we posted a trade idea on our TradingView Profile >>>HERE<<< for a potential 5th wave long swing trading opportunity on GNRC.
This video explains the subsequent bullish move to hit our original 5th wave target and then a further 5th wave swing trading opportunity. This is a great example of our Elliott Wave Indicator suite in action during strong trending moves on Stocks, but is also as effective on Forex,Futures, Commodities and crypto currencies.

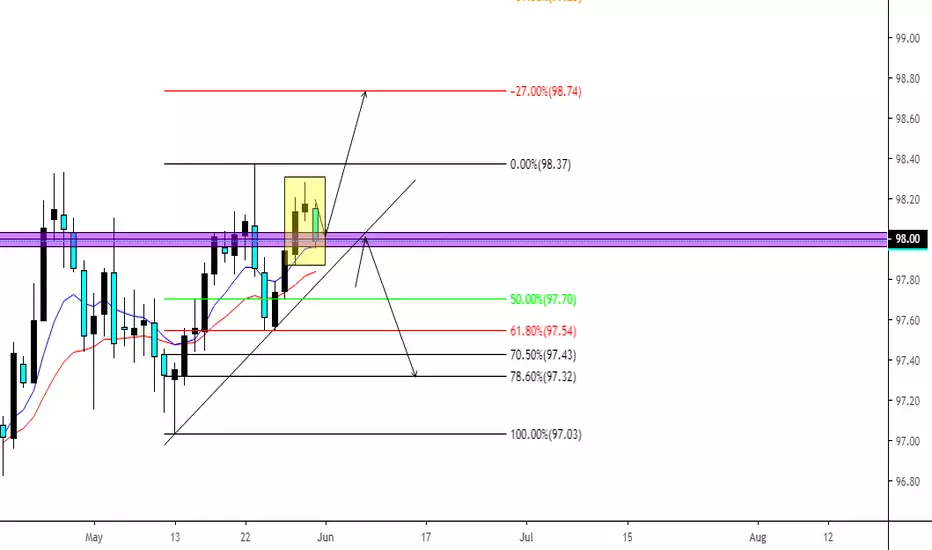
DXY (US DOLLAR INDEX) LONG BIASIf Dollar Index Weakens XXX/USD goes up. If Dollar Index Strengthens XXX/USD does down.
Looking at DXY I can see a Reversal Pattern form inside the box with a Pin Bar, Doji and what looks to be a Bearish Engulfing Candle. However, the market is uptrending & this could easily be a retest on 98.00 for a continuation upwards to fulfill the -0.27% extension.
Plan A:
We have got a fair bit of USD news coming out in 5 hours following this week will be NFP and Client Sentiments show that the vast majority of Retail-Traders are Shorting the USD and Longing XXX/USD, So I choose to observe the masses and do the opposite which is have a long Bias on USD...Also I dislike going against the trend of the market;)
Plan B:
I will not be looking to Short the USD unless there is a clear break of the Counter-Trend line.
Targets at -0.27%
AKAM Position AKAM broke out earlier this week where we entered the trade. SO far it is moving in the direction we want it too. Slow grinder but making money.

BTC - Falling Wedge Possibility - Bear market end?HI Folks,
This is a BTC analysis. We `ve been under an interesting formationg since February started.
Yesterday, We just got back from 0.618 FIBONNACCI Zone.
On my TA, I`ve painted a "Falling Wedge" Formation that could lead us to a great trend reversion if we get sideways until March 11-13.
Now, if We manage to stay on that Falling Wedge Formation that could lead us to 5000+ USD Zone.
Key support Levels: 3800; 3650; 3550.

AKAM: Dark Pools & Pro Traders Patterns Ahead of Earnings TodayAkamai Technologies Inc. reports earnings today with a solid start to a bottoming formation with Dark Pools' and then Pro traders’ footprints. The stock is currently at a completion level for the short term bottom. A Shift of Sentiment™ pattern formed between October and January. AKAM moved lower before finding the final low support from a previous Dark Pool Buy zone while Accumulation/Distribution indicators exposed the positive divergence. The pattern is a setup for a swing trade, not a position trade opportunity yet.

Learn how to do a trend continuation trade, with Benny Manieri!Hello again friends,
Deciding what kind of trader you want to be is important, so you're not bouncing all over the place. Having said that, learning different ways to trade can add an important weapon in your arsenal against the markets. I'm a counter trend trader at my core, but my trading plan has a provision when the maximum profit vs risk presents itself in the form of a trend continuation trade, a specific filter allows me to attack the market in this fashion. What this may look like in your trading plan may be different. Every trading plan is personal. Personal as the Preparation H on my fingertips now sticking the keyboard as I type.
Here, we see that NZDUSD has been in a well-established downtrend on the hourly, my trading time frame. I bounced out to a four hour, my higher time frame, and drew in some thin red horizontal support lines. These are places that price has touched at least 3 times on that higher time frame. We see that we are sitting on a spongy area of support at this time, and it will be important to see how the market behaves heading into the Sunday open. Unfortunately around that time, I will be too intoxicated after Sunday afternoon football to pay attention to this, but have at it guys.
We will look for a retracement from current price action, up into the .382 at least for us to begin to be interested. We see a fib confluence area consisting of fibs from the current and last swings lining up with structure. (Pink zone) Nice nice. One price action does something interesting up there, such as RSI overbought with a lower low lower close candle, kangaroo tail, something to indicate it will reverse, a market buy with two contracts is probable. Stops go at least 1 ATR above the most recent swing high. Target one is back down at previous structure. Once it's hit, stops on the second contract are rolled to break even. The second target is at the 1.27 extension, if you've got the balls to hang onto it.
Benny Manieri
