AAPL, Long above $119, Short under $109! Apple stock has been extremely interesting recently. We saw it reach a $2T market cap, split 4-1, reach new highs day after day and most recently drop 20% from an all-time high. All in less than a month.
So the real question is, where can Apple go from here? There are two scenarios. It's difficult to say Apple will bottom out here or it will for sure keep dropping. It has dropped quite a bit but there is the possibility for an even bigger spill to correct the markets a little better to a more real valuation.
Apple's bear case is a little stronger than the bull. We have the September rebalance to look for. We also have not seen the complete rebalance of the US equity indices. based on technicals we have seen that Apple has managed to close it's downside gap and that typically happens before a slight spill. The real tell of the downside on Apple is the massive consolidation that we saw earlier in the summer between $108 and $115. There is a huge volume block there based on the volume profile. If we manage to hold that out as we have seen very recently, we are most likely going to make a push back to all-time highs.
However if that pivotal level and red box break, we're going to see a downward push most likely into the 200-day moving average and potentially in the prior broken all-time high that was an area of consolidation. The 200-day moving average is first at $108, so that becomes an easy test of a level. The more aggressive bear level is if we break that consolidation period and we tumbled back into the prior broken high at $98-$99. This would be the real pullback and rightfully so an area to stall. There is massive volume there and it was a prior top, so that means there would be a lot of long money interest should that level be tested.
This is for educational purposes, not investment advice. All traders are responsible for their actions in the markets. Trading involves substantial risk, I would recommend being aware of that risk and being well educated on the matters before proceeding.
Aapllong

APPLE INC. LONG📈 NASDAQ:AAPL LONG H4
🛒BUY above = 131.30
🎯Target1 = 134.90
🎯Target2 = 139.40
🛑Stop loss or cancel trade = 126
🙈Risk = (0.5%-1%)
#AAPL #AAPLLONG #AAPLTSLA

A GOLDEN APPLE GREW ON A DEAD ROTTEN TREE|VOODOO ECONOMICS|
So Apple is now worth 2 trillion dollars.
This comes almost as an insult to all of the America and the rest of the world, that is drowning under a mountain of debts and unemployment, current or expected, and a coming wave foreclosures, divorces, suicides and other social unrest, that is to come from the economic despair we are all about to get mired in.
The continued lockdowns and the travel restrictions- the insanity that was imposed upon us, to "save us" from the virus that turned out to be no deadlier than the common flue, have artificially destroyed a booming global economy of 2019, but gave an excuse for the FED to open the taps of the "Unlimited liquidity", to purportedly prevent a chain of defaults, and to stop the deleveraging of the markets. And even though the latter was necessary indeed, the results of centrally planning the monetary policy, just as the results of centrally planning anything else, were, as always, poor at best.
As it is said in the "Princes of the Yen", the central banks are just yet another bureaucratic institution, that has power and no responsibility or accountability, which is a dangerous combination, and just as anyone who has power, the central bankers seek to increase it. The crises are the events that give central bankers power. They create bubbles using this power, and then create the crises after the bubble bursts that requires even more central banking involvement in the economy. Each following bubble/crisis is worse than the one before. And no, this is not a feature of capitalism. Capitalism is the greatest wealth creation system ever designed. Boom and bust, is a feature of centrally planning money supply and interest rates. And while I am in the camp of those, who think that it is an unintended byproduct, ain't it conspicuous that every single time saving the economy ends up in us all saving the rich. Or rather, making them richer. And I haven't even mentioned the federal and state debt burden incurred during the "pandemic" that will plague our children and grandchildren. For those who think that government debts don't matter: go read a book or two on economics and history.
Just to make it clear: we are witnessing the greatest redistribution of wealth in the history of mankind, that shadows all the previous QE programs and subsidies and loans and tax breaks, in scale and speed of the gains. Feast in Time of Plague....Almost literally this time by the way. But while the plague is shallow at best, the feast is rich beyond belief.
On a darker note, I will repeat:
I am convinced that the we have not yet felt the full magnitude of the economic apocalypse that is coming. By the late autumn or the new year lates, we will start counting and feeling the losses. And those will be felt acutely for the next decade to come, at least. Those who are delusional enough to think that shutting off a significant part of the economy for 5 months(so far) won't have a lasting impact on lives and the economy are fooling themselves and will have a harsh awakening. Some of those "intellectuals" , who though they were irreplaceable, and looked down at those unemployed "low-skilled workers" through a glass of cold Chardonnay, will learn the error of their ways by discovering they suddenly lost their incomes too.
And while a phrase:"learn to code" is a standard response to those discovering their job is gone, in the «funny» fields like SJW-journalism, gender studies or liberal arts, the phrase more appropriate on this web-site would be: learn to trade! The markets will stay opened during the harshest of the crises, so if you learn to milk those swing cows, you will never be hungry again. And if the markets get shut down, then you know that the wheels fell off, finally, and you probably need to head to the nuclear bunker, with a gun and a bag of rice big enough to last you through the winter.
Anyhow, thats the end of my rant, thank you for reading! I appreciate all the comments and opinions, so feel free to tell me what you think of my rant below. Also, like and subscribe and have a nice day!

Apple Inc. LONG📈 NASDAQ:AAPL LONG D1
🛒BUY above = 458.45
🎯Target1 = 472.20
🎯Target2 = 480.80
🛑Stop loss or cancel trade = 435.15
🙈Risk = (1%-2%)
#AAPL #AAPLONG #BUYAAPL

AAPL - A Channel Built for a Bull Run.How will the 4/1 split impact options and their delta and theta's? The goal from AAPL is stated to provide expanded access to investing in their company, what do you all project the increase in volume might be?

APPLE|NO SHORTS BEFORE THE SUPPORT BREAKS|BEST CHANNEL EVER|LONGApple is beating all time highs like there is no gravity these days. I do not intend to lament the FED, Voodoo economics etc..
I simply say: The current channel is too perfect not to be embraced completely, and, though a bit late to the party, one might consider going long every time the price touches the support. If the FED is printing money, I suggest you ride that wave.
Join Morgan Stanley and Goldman Sachs who are beating records in their trading desks profits, riding the market recovery wave, and given that Apple has just won 14 billion dollars legal battle against the EU, while also setting precedent for the other US tech giants in Europe, potentially giving a bump to the entire US stock market in general, I say this channel still has some way to go.For example, AAPL rally might go on till SPY recovers into 340 zone.The stock might even go into the full acceleration mode in its final stages, so go long and use trailing stop.
Any potential short will most likely develop in a fashion shown on the chart, so no shorts before the breakout and pullback.
Thank you for reading, like and subscribe and have a nice day!

$AAPL Weekly Option Play | Buy The BreakoutTechnical Analysis of Apple plus this weeks option play...
After we breakout then retest $385, we will look to get in.
The Play:
AAPL $395 Call 7/17 @ $238 per contract
We hit this 3 times in the last few months, this is Easy Loot
DotcomJack
Do not trade this

BULLSEYE - A 10% profits trade.Some trades are easy, some are not. This one here was definitely among the easy ones . If you missed my previous analysis on AAPL, just check it bellow and remember to follow me to keep updated of our trades and analysis. Here’s the link to my previous analysis, on April 22:
When that candle closed, it formed a pattern that those who follow me know I like to trade – a Harami. But there’s more! The pattern was close to 3 main supports: 1 – The 21 ema; 2 – The purple trendline; 3 – The previous top (now bottom). And even better: The green candle closed above all the 3 of them. As I said in my previous analysis, that would be a very good sign. I love when a trade is absolutely obvious, like this one!
But how to trade a Harami? Simple, I usually put a buy order 1 cent (sometimes more) above the previous candle’s high. If I’m afraid that a gap will not let me buy just one cent above, then I buy half of my position near the end of the Harami’s day and wait for the confirmation next day. The confirmation is always the most important thing , because we need to know if the Harami was triggered or not.
Now, AAPL reached our main target after 2 weeks, and now we can sell it and book our profits. Congratulations to those who did catch this trade, that was an easy one! If you missed this trade, now it isn’t time to buy, neither to short. It’s too close to the trendline, and there’s a chance that it will hold the price again, then the risk/reward of a short is not attractive. There’re more interesting trades to do.
Remember to follow me, I’m a trader who uses the classic technical analysis (barely any indicator, just the candles and the volume). Like this idea if it helped.
Thank you very much.
* LIKE this idea and FOLLOW me, because:
- Here, you will see clean charts;
- Trades with clear risk management;
- The best of Dow Theory, Price Action and Candlestick psychology;
- Chart patterns with statistics. *
* My name is Nathan, I'm a trader and portfolio manager and I'm here to LEARN. Leave your COMMENT and FOLLOW me to keep in touch. *

The Big Apple. (AAPL)Great time to be playing apple.
Levels drawn.
Potential breakout, play this price aggressive.
Watch volume.

Apple Buy !Hey Guys please support by follow and like my idea.
Apple is on a bullish trend to reach a resistance of 283$

AAPL : think we start to see Wave (C) upEarlier thought about taking a call credit spread but price never gave me a convincing entry for a day trade. Obviously it would have worked out today but it isn’t about that. Don’t trade just to trade; some of the best trades are no trades! Who knows, I could have done that trade today and the market decides to have a complete opposite event of today, where I would have taken a loss!
I think we start to see wave (C) up here. We easily can fluctuate from here down to 238 area but I am leaning towards to start up.
Started small long today. Will either 1) look to build long on an established 1-2 wave; or 2) watch this demand zone, breaking down and out of this zone will signal a stop loss for me. But again, I think we can see some upward movement.

SPY : building short term longThink we are right around end of wave (B) and start to build up (C). Only building small position. Will wait for wave 2 retrace of 1 within (C) to load more if price sustains!

AAPL : still targeting 240Still targeting 240 level to watch for chance to take a long position. An extended flat A B C has C going beyond the ending point of A. Again, will watch price action in that zone for a position for Wave (C) up!

AAPL : update - seeing an expanded flat for abcSeeing expanded flat playing out for wave c of (B) down. Targeting 240 level to look at entering small long position for upside of Wave (C). Should see a 5 wave sequence down for c of (B)

AAPL Bull run0.98 regression uptrend ! Will the upward momentum continue? or will the formation of this island top lead to a bearish move.

Apple stock continues to rally, $295 is the target! 100% in 2019Over the last 14-weeks, Apple stock has had 2 red weeks, and they've been almost negligible. The stock is up nearly 80% this year alone!! We can see the stock gain 100% by the end of the year if this continues, especially around the holiday season. Since Apple is on all-time highs, the only instrument to help us with the potential upside target is the Fib extension, we've used two different levels to identify levels at which Apple may get attracted to and/or stall.
The first target level is $275 based on the Fib extension from the impulse that brought price up to this high.
The second target is $295 based on the Fib extension from the move that managed to drop price heavily in December 2018.
Where could a trader get in? The logical level is where the last slight pullback happened and the broken high at $240-$250 however that is pretty far from the current price, if the equity market does see a pullback then Apple may be more prone to retrace.
Disclaimer: This trade idea is for educational purposes exclusively, this does not constitute investment or trading advice. TRADEPRO Academy is not responsible for any market activity.

Will Apple begin to Fall?Hello, Traders!
Monfex is at your service and today we overview Apple .
AAPL is forming an ascending wedge which target is the local support zone and 50% Fibonacci with MA200. It also can be a double top pattern inside this wedge .
The local resistance zone ~ $249.6
The local support zone ~ $235
Market Cap
1124.191
Share your thoughts, ideas about the market under the chart.
Watch for our Updates to be the first who gets well-timed signals !
GOOD LUCK AND LOTS OF PROFITS !!
Disclaimer
This report is for information purposes only and should not be considered a solicitation to buy or sell any trading assets. Monfex accepts no responsibility for any consequences resulting from the use of this material. Any person acting on this trade idea does so entirely at their own risk.

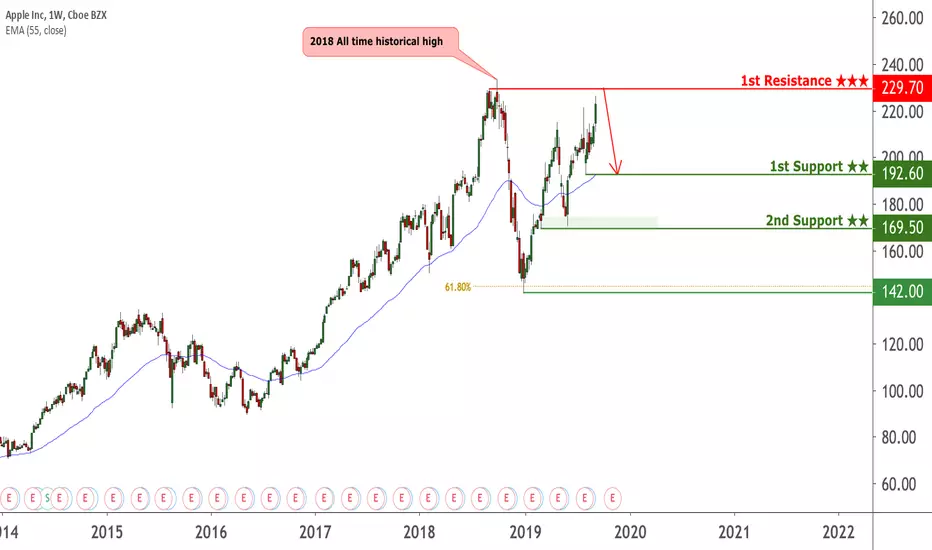
AAPL reversed from resistance, potential drop!
AAPL reversed off its resistance at 229.70 where it could potentially drop further to 192.60.
Trading CFDs on margin carries high risk.
Losses can exceed the initial investment so please ensure you fully
understand the risks.
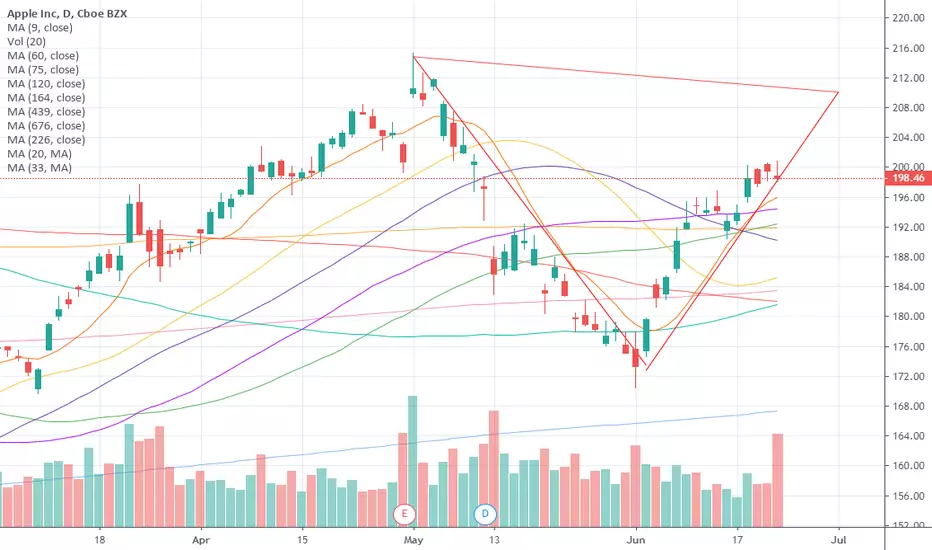
AAPL LONG 1 Day Chart Trades in the clutches of the trendlineHello to all watching my charts
Today i will bring to you something new in my chartbook
Apple AAPL as a stock chart in 1 Day so we look at a longer timeframe
So every red step is 1 day.
As we are able to see, these stock trades very fine
in direction of the trendlines which has been established
SHORT after brake of resistances 212 USD
LONG after shorttrendline broken and new high 158 USD
SHORT after trendline broken and lower low 197 USD
LONG after trendline broken and higher high 181 USD
You could have made some money here.
If you are interested in more Stock charts on day charts
let me know.
If you want to support my work and my charts please like them..
Good trades
Renkotrade

Daily AAPL forecast timing analysis by Supply-Demand strength21-Jun
Stock investing strategies NASDAQ:AAPL
Investing position about Supply-Demand(S&D) strength: In Rising section of high profit & low risk
Supply-Demand(S&D) strength Trend Analysis: About to begin an upward trend as a adjustment trend gradually gives way to increasing limited falls and strong rises.
Today's S&D strength Flow: Supply-Demand(S&D) strength flow appropriate to the current trend.
View a Forecast Candlestick Chart Analysis of 10 days in the future: www.pretiming.com
(You can easily create a trading plan.)
D+1 Candlestick Color forecast: GREEN Candlestick
%D+1 Range forecast: 1.4% (HIGH) ~ -0.1% (LOW), 1.0% (CLOSE)
%AVG in case of rising: 1.8% (HIGH) ~ -0.2% (LOW), 1.3% (CLOSE)
%AVG in case of falling: 0.5% (HIGH) ~ -1.4% (LOW), -0.7% (CLOSE)
Price Forecast Timing Criteria: Price forecast timing is analyzed based on pretiming algorithm of Supply-Demand(S&D) strength.

AAPL Weekly SignalAs you can see in the graph above Apple's share fell nearly 40 percent from its peak And stopped right on Moving Average 200 And since then the price has been rebounding And completed a weekly rise, we add the Fibonacci indicator to give us Take Profit prices
Our Signal: Buy AAPL
Entry Price: 156.5
Take Profit: 166

