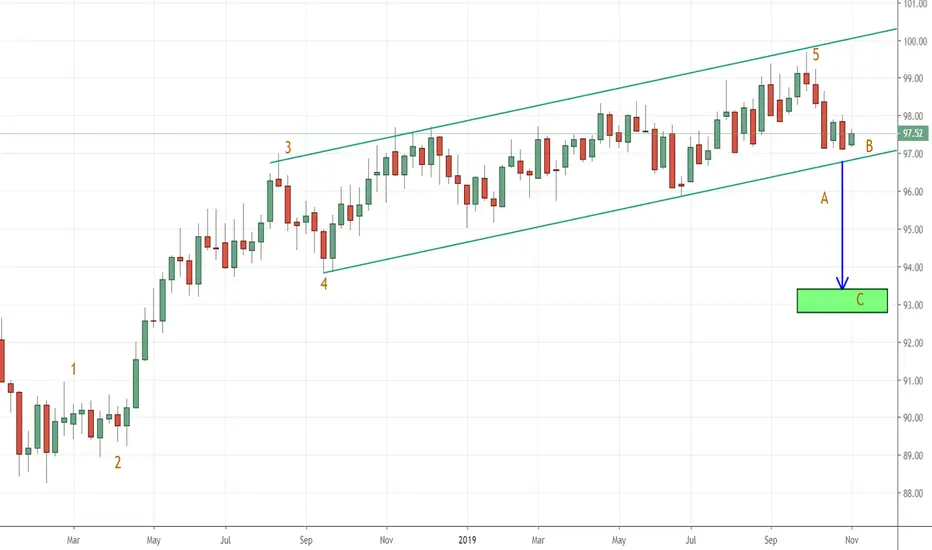
DJIA: B wave reaction rally of ABC minor correction pause to ATHGot a typical reactionary rally after breakdown from rising wedge. Price moves back to kiss TL then rejects into C leg. This is a minor shallow correction of perhaps ~3%; a pause on road to ultimate ATH.
Gaps to fill down to 2949 on SPX will be the best yardstick for pivot. Buy all-in when price fills that gap IMO. Donald will make some deal with China soon as he wants to get elected, and that draws near. Expect some development in mid-Dec as catalyst.
Market knows he will get re-elected, Dems have no competitive candidate in field, their prospects are amusing at best and impeachment is a farce.
This isn't investing advice! Trade at your own risk! GLTA!
Abccorrection

Last leg down for silverLast 5th corrective wave of C down to green box, will end total correction of big wave 4. Wave 5 will start there till new highs at least 20.44

Gold Last leg downWave 4 of XauUsd is incomplete. The ABC correction has to end at green box. Then we can talk about Wave 5.

NZDUSD buy set up. NZDUSD needs to hold this bottom to go long. We will be looking for price action on lower tf. If this bottom breaks down, watch the trendline.

Triangle? B wavei believe BTC needs to come down to the 8500 area to pick up orders to keep this bull market moving. most alts seem to be finishing 5th waves also. maybe we see a be correction across the board?

USD index is correctingWith projected negative interest rate DXY will weaken against all major currencies. For now consider this as an ABC correction. Gold, Silver, and Stock Indices should go up too. Good Luck. Be patient!

SPX in ABC Correction: In 'B' Wave Bear FlagSee related post in the 15 min chart for bear flag; here see it really clearly in 1-hr; it is possible the Gap from Tues could fill before heading lower; or just break down from tip of wedge. Friday should give us a pretty clear signal. Entered some shorts; add if it bounces higher; this is a Butterfly pattern CD leg; it is taking the form of an ABC correction. Target is Index 2740 +/- 20 pips. C is usually a bit longer than A and extends somewhat, but should be at least as long; hence, ~140 - 180 pips from 2900 (target 2720-2760).
The Bull rally after correction could carry index to new ATH above 3100-3150 by EOY at the 1.618 Fib extension!
Trade at your own risk! This is not advice; just an idea; GLTA!


US 30 in ABC Correction? Road to ATH; in Handle of CupVolume lessens on rising prices, increases on downdrafts. RSI divergent. Small caps have reached .50 Fibo retrace off September's lower high.
SP500 and Dow have a gap to fill down to the 0.50 Fibo.
Three-day rally feels like a B wave, chaotic and widely fluctuant. If so, expect C wave down to the gapfill at the breakout point from Cup near 26300/SandP 2942.
A hedged short here is probably a fair R/R as EOM 'window-dressing' is likely to finish what seems to be a modest correction. The ABC is consistent with Intermediate Wave 2 of a Primary wave 3; markets should enter third-in-third wave on completion of the modest correction. A severe tankoff would invalidate this hypothesis!
IMO another major October downdraft is unlikely as these rarely happen two years in a row; but anything is possible in this mad market.
Taking a small short position on indexes with the gap up in AM on 9/27; this gap will very likely fill in day; first week of October is likely to be choppy.
Completing a corrective wave might coincide with positive trade news in Mid-October; if the outcome is disappointing expect a deeper selloff.
Still very chancy. Indicators to watch: RUT strong support at 1500 (IWM 150, now trading near 153); small caps have been a leading signal canary.
I'd close shorts with IWM at 150; DIA at 264; SPY at 294, if and when they get to these prices. An ABC complete wave could well provide launch point for next bullrun.
Longer-term still Bullish going into New Year, I'm not convinced this appearance of H&S in the monthly chart is really going to rollover. We shall see!
This isn't investment advice; just an idea, trade at your own risk; GLTA!

Bitcoin in for a long awaited correction -40% in a month?Hello dear followers,
Bitcoin is getting the blow off top everyone has been waiting for. If this continues and follows the same proportions as in the last bull market, we can expect a 40% drop. Also the price usually comes down to the 20 week MA. I have extrapolated this moving average in the chart. I expect a ABC correction, first down to the bottom of the upwards channel, then up to make a right shoulder and then completing the ABC and for the ‘Head and shoulders fans’ the possible head and shoulders pattern.
This is my own hypothesis and not trading advice. What do you guys think?
PS: You can also take a look at my SOLVEBTC idea and possibly leave a like
Trade safe!

Crowdstrike Possibility...Let Me Get My Crystal Ball Out...CRWD Pretty self-explanatory idea on chart. Levels where I think CRWD can go, eventually ending around 130 area. In my opinion likely to see low 70's and possible gap fill before moving on up, in an effort to complete corrective wave. Obviously tons of things can happen to negate this, horrible or outstanding earnings being just one of them. I do like the stock, and look forward to making money on it, whichever way it goes. Happy hunting and GLTA!!

Be ready!!! - BTC is still on the Bear side! As you can see on the chart, BTC is still on ABC correction and it has completed A and B so far!
STEP 1 - A point:
STEP 2 - B point:
STEP 3 - C point:
C point extended:
If you have any thoughts or suggestions, don't hesitate to leave a comment below. Hit the like button, if you enjoyed this idea!

Time To Change The OilAZO Has the appearance of having completed its leg up, and still has room to move downward toward 888 area in my opinion. Below are multiple timeframe looks at possibilities of this look like. Weekly chart would appear to be presenting AZO in a possible first wave in a longer term view. On the daily, printed a big fat huge bearish engulfing candle last Friday. Sww attached image. Pretty self explanatory after that. Happy hunting and GLTA!! commodity.com

$BUD -50% Next 2 YearsChart pretty self explanatory. Rounded top formation into 5 waves down, retrace A-B-C correction, now ready to take next leg down. BUD could be sub-50 by the end of 2021 at the latest in my opinion. So....maybe this Bud's NOT for you...

Simple A-B-C Correction $BTC will be $7200-$7500 AreaThis is only my opinion :)
Don't take it seriously.
Maybe you have better forecest, so just share it to the comment below :)

Inv H&S or ABC correction? That's how they trick yaWe need a correction
This is NOT new money/retail investors -- Big money is coming and leaving to quick
Volume is corrective and will skidattle at the .786 not to be seen again for awhile
IMHO

Is BTC headed towards a correction?As predicted in the preview idea, BTC topped around 12700.
The next move, in my opinion, will determine whether Bitcoin is headed towards major correction or not.
On the bigger time frame it looks to me that an ABC correction is developing.

BTC USD ABC correction BTC correction (ABC) to retest MA 20 and off we go. Note to self for my journal: stick to your strategy, don't trade when tired, and wait for the retest!

Bitcoin! Quick ABC 35-40% correction this week!All in the charts. That's how I simply see things :) It may take longer though, of course.
Best thing you can do is either HODL or add to your position. July will show a lot of volality but eventually Bitcoin is skyrocketing soon to $20k and beyond.
I'm personally shorting the market from $12.5k - but I wouldn't recommend shorting if you don't know what you're doing; lots of wicks and whale liquidations. Be careful.
Bitcoin still super bullish this year after this correction.
Cheers,
Leb Crypto


SPX in A-B-C Correction; B Wave near completion; lower soon!Chart says it best. Got an A-B-C in progress. Very clear downtrend, A-leg in defined channel, high volume in selling, small volume buying.
Definite 5-wave Elliott impulse forming in the reactionary B wave. Fifth and final wave should push to the 0.786 Fibo at 2905. Then enter C.
This ABC is in turn part of a larger zig-zag correction in progress since Jan 2018, complete with triple top. This is the right shoulder of a peak formation which in turn is the right side of a Grand H&S.
Do not sell puts short now, it will not be free money!
As always, not investing advice, just an idea. Trade at ur own risk; GLTA!

S&P 500 Bears take controlBullish trend is over for this and other stock indexes. ABC correction should start.
