Bulls Drive Cardano (ADA) Price as Crypto Market ReboundsCardano’s TVL has risen by 28.14% over the previous two weeks, to $210 million.
If the price climbs above $0.32 resistance level, then it will likely move towards $0.36 level.
There is a direct correlation between the ecosystem’s total value locked (TVL) and the current spike in Cardano prices. According to the latest figures from DefiLlama, Cardano’s TVL has risen by 28.14% over the previous two weeks, to $210 million.
$97.88 million of this TVL comes from the two major DeFi projects, Minswap and Indigo. The quick growth in TVL is indicative of rising adoption of Cardano and rising trust in the platform. Also, indicative of rising optimism regarding ADA’s upcoming price movements, the number of addresses holding ADA for long-term recently surpassed 2.7 million.
Bulls in Control
CryptoRank’s historical indicators point to a bearish indication, and market patterns suggest that ADA may have a slight drop this month. The median monthly return for ADA throughout the years is -2.5%, but the average monthly return is a whopping 43.5%.
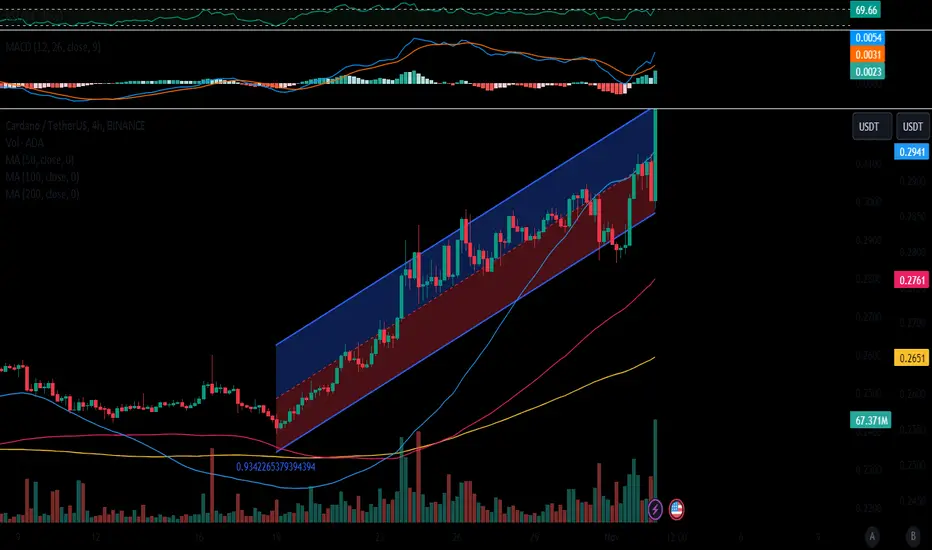
With a price increase of 7.39% in the previous 24 hours, Cardano (ADA) has joined the overall cryptocurrency market rally. At the time of writing, ADA is trading at $0.3089, signifying a 17.83% rise in the last 30 days with a trade volume of over $353 million, as per data from CoinMarketCap.
If the price climbs above $0.32 resistance level, then it will likely move towards $0.36 level. Breaking over this level will likely see price testing $0.38 resistance level. On the other hand, if price goes below $0.29 support level, then it will likely decline further to test the $0.28 level. Further decline will likely see price testing $0.26 support level.
ADAUSDT
🔥CARDANO Breaks Trendline and Now The Way is Open❗️Cardano is breaking above the trendline, so I don't recommend to use all 100% of money to invest now. I prefer to wait for the pullback to the trendline and test it as the support to buy as it shown on chart.
The closest target is a local high at $0.46.
💥$1 is possible if BTC reach $42-46k. The targets is on chart.
like❤️ and follow
Check the links and get a BONUS🎁 from me👇

Cardano (ADA) is about to make a move the will stun people!Cardano not only has incredible utility, but it is massively undervalued at current prices. Most investors don't just hold ADA because of it's mind-blowing price appreciation potential, they hold it because they know that it will play a substantial role in the coming digital revolution. Even a novice can look at the current chart and see that something big is about to happen with this coin. I personally believe that no matter how large your crypto portfolio is that everyone should have at least 5% of their portfolio in Cardano.
Remember tribe, stay diversified and never put all your eggs in one basket!

Cardano technical analysisAs you can see in the one-month chart of Cardano, Cardano then went through a very strong downtrend from $3 to $0.20, due to the deep corrections and the low strength of bearish candles and the strength of bullish candles in A very, very important support area for Cardano.
It seems that this currency is building its floor at the end of the downtrend on an important support level.
But for now, Cardano has not started any upward trend, and it can start an upward trend when it breaks its dynamic and static resistance range, which you can see in the chart, and stabilizes this failure by closing the candle above this range.
Cardano is completely suitable for buying in this range from both technical and fundamental and sentimental points of view, of course, by observing the trading principles, including the loss limit.
SOS FINANCIAL COMPANY

BTC & ADA Face a Threatening Cloudy Forecast ☁️ Time to Sell? 🌦️ The global crypto market still has upside potential according to ATTMO, which forecasts slightly bullish trading conditions in the next 24 hours. Binance Coin bucks this positive trend, facing cloudier ☁️ bearish trading conditions.
Over a one-week horizon, Bitcoin and Cardano, are set to face an imminent market correction. A bullish ☀️ sun will, however, continue to shine over Ethereum, Ripple’s XRP and Avalanche over this longer time horizon. Litecoin, Polygon and Uniswap are set to head lower, as they face slightly bearish ☁️ clouds.
Follow us for more crypto weather reports!

Probably for ADA next move?Nfa. Imho ADA will faces some corrective wave before proceed a bullish momentum for upcoming wave 3

When Do alts really start ExplodingThe top chart is Total2 on Weekly, and the bottom chart shows BTC.D.
We can immediately make an observation based on these charts that Total2, i.e. The market cap of all the alts is rising over time and is moving in an upward parallel channel while BTC.D is moving in a descending triangle, which is a bearish pattern.
This tells us that over time the total alts market cap is growing, and they are stealing market cap from BTC.
How can we use this to our advantage?
Using some trendlines we can see what happens to Total2 when the BTC.D tapped the downward sloping trendline, the total2 went parabolic after that.
Using the same trendlines we can project when BTC.D is going to hit the top downward sloping trendline, the chart shows it falls somewhere around December end and first week of Feb.
The BTC.D read at that time should be somewhere around 57 to 58%, this is also in confluence with target from the BTC.D Wyckoff chart I have shared several times past.
The two ellipses in the chart show how I expect BTC.D to move up in the next couple of months.
Also, as evidence here are charts of some of the alts from the previous two bull runs highlighting what happened to them after BTC.D tapped the top trendline. (Which happened on 17th of March and 21st of December.
ETH
ADA
MATIC
There are many others you can look up yourselves.
All this is contingent upon Continuation of BTC Rally beyond 38K in coming couple of months.


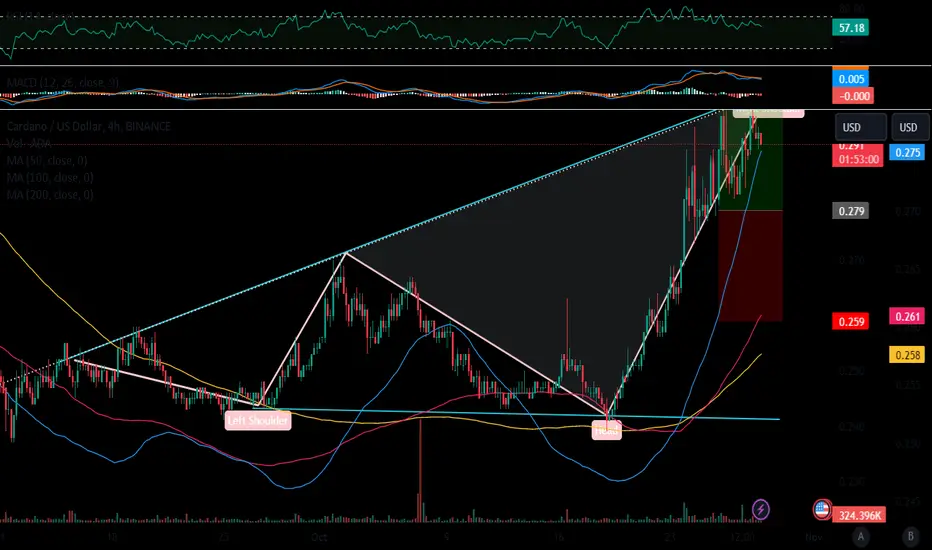
Cardano's ($ADA) Prolific Bullish TrendThe local trend on Cardano's chart is bullish, a trend that seems logical given the positive dynamics of BTC. Currently, ADA is trading between the support zone of $0.2730-$0.2770 and the resistance of $0.2920-$0.2970.
The priority for ADA is to continue this upward movement. Above the current resistance zone, the range of $0.302-$0.308 becomes the next target for buyers. Future highs are expected to be updated as Bitcoin continues its growth.
In the event of a correction, the ADA price may test the support levels at $0.265 and within the range of $0.255-$0.260. All these marks are within the upward trend, which is expected to resume after such a correction.
Supply and Descending Trend Line create a Resistance ZoneOn day chart
Cardano has Supply Zone around 0.3 and also have obstacle by Descending Trend Line that made a strong resistance zone for this time.
So I expect ADA will pull back to 0.268
Wait for next move

ADA is underrated nowBINANCE:ADAUSDT
✅Before we start to discuss, I would be glad if you share your opinion on this post's comment section and hit the like button if you enjoyed it.
Thank you.
Possible Targets and explanation idea
➡️Now we are in 0.27 Zone by Fib since April
➡️Target for this correction is 0.618 level on fib
➡️Perfect signal to buy on TradeON indicator
➡️Signal on Direction indicator. (big investors came in to Cardano)
➡️After 0.618 we will test above downtrend global line since May 2021
Hope you enjoyed the content I created, You can support with your likes and comments this idea so more people can watch!
✅Disclaimer: Please be aware of the risks involved in trading. This idea was made for educational purposes only not for financial Investment Purposes.
* Look at my ideas about interesting altcoins in the related section down below ↓
* For more ideas please hit "Like" and "Follow"!

Cardano (ADA) long before the breakIf ADA retrace to 0.275 (FIB-level 0.38) - I think it's in a good position for a spot trade.
I predict the ADA-bottom is in and we can aspect some big fast move as soon as ADA break the trend-line.
ADA have been tanking for years now and I believe that there are a lot of hungry bulls that will show up to find an entry for a long time hold.
I don't think we will get any good opportunities to buy the retest after a potential trend break.
So my idea here is to front run the potential big move :)

🚧Cardano is bearish now🚧 & many Traders don't see it 👀!!!As you saw in the previous analysis, the price hit the target and now it is time for the price to correct and then grow. PRZ point is a good point to enter.
Previous Analysis
_ _ _ _ _ _ _ _ _ _ _ _ _ _ _ _ _ _ _ _ _ _ _ _ _ _ _ _ _ _ _ _ _
✅Thank you, and for more ideas, hit ❤️Like❤️ and 🌟Follow🌟!

🐳Cardano will Go Up Again🐳 🟡ADA is in an symmetrical triangle which means the price is about to do a good bullish movement. The price can increase as much as the measured price movement ( AB=CD ) .The break out needed for increasing further has not happened but it should happen pretty soon.
_ _ _ _ _ _ _ _ _ _ _ _ _ _ _ _ _ _ _ _ _ _ _ _ _ _ _ _ _ _ _ _ _
✅Thank you, and for more ideas, hit ❤️Like❤️ and 🌟Follow🌟!

FAKE BREAK & BUY TO 0.2792$*-Technical Analysis 📈
FAKE BREAK BY LONG TO 0.2792$ = fake break in trendline by to support in base breakeven and target= 2-leg last movement
*Trade (Buy/Sell) 📊
buy = 0.2557$
*-Stop Loss 🔴
0.2536$
*-Take Profit 🎯
0.2792$
*-Risk Management 🚧
3%
👨🎓 Experience and Education: Our trading team has five years of experience in financial markets, especially cryptocurrencie.

Cardano The GhostI've set every major level on the chart of ADA.
In my opinion, Cardano is a lost project that had since 2017 time to evolve and never showed anything. Competitors are way ahead with new tech and cardanos price is held only by it's believer community.
I'm not buying ADA for now but might look into it under 10 cents if it ever goes there.
The chances it makes high gains in the next cycle are very low but, local bounces and pumps are incoming.
Choose wisely )
