BIDU 1D: triangle breakoutBIDU 1D: triangle breakout + real-world AI deployment boosts bulls
Baidu (BIDU) breaks out of a triangle within a falling channel on the daily chart, with solid volume, reclaim of the 50MA, and approach to the 200MA. $90.09 flips into support. Targets stretch to $105.47 / $113.68 / $124.06 (Fibo levels).
Fundamentally, Car Inc just launched a robo-car rental service powered by Baidu’s Apollo unit. Fully autonomous, bookable for 4 hours to 7 days — this is not future tech, it’s live now. With a $32.6B market cap and low P/E (~12), BIDU looks positioned for revaluation if sentiment shifts.
Tactical setup: entry by market or retest of $90, stop below $82.
When the robot drives customers - you just drive the trade.
Aistocks

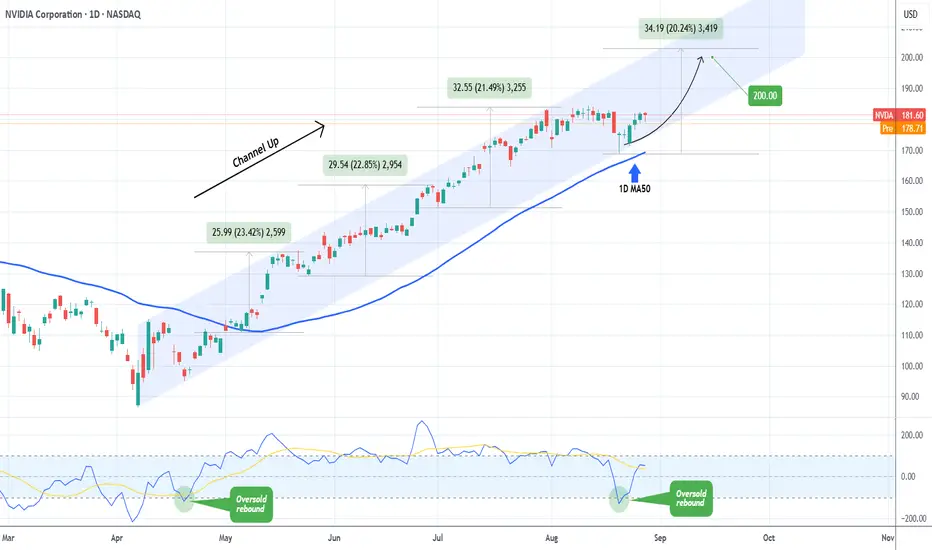
NVIDIA Has it bottomed??NVIDIA Corporation (NVDA) broke last week below its 1D MA50 (blue trend-line) for the first time in 4 months (since May 06). That was perceived as the bullish trend's strongest Support and rightfully so technically.
The next level to watch as a Support is the 1D MA100 (green trend-line), which was the level that held and led the stock to its previous peak during the last strong bullish trend of October 31 2023 to June 20 2024.
As you can see, there was a situation similar to today's where the price again broke below the 1D MA50 during the uptrend but kept the 1D MA100 intact and rebounded. Still, it managed to touch the 0.236 Fibonacci retracement level.
As a result, there might be potential for one more weekly Leg down to $155.00 (Fib 0.236) before recovering but this would also most likely mean breaking below the 1D MA100. This is doubtful but not impossible but still there are higher probabilities of a rebound sooner.
A strong indicator that is in Support of this is the 1D RSI, which just touched its 2-year Support Zone, a level that has always been a 'Buy' whether short or long-term. As far as a Target is concerned, the 2024 Channel Up peaked on the -0.382 Fibonacci extension, which is at $245.00.
-------------------------------------------------------------------------------
** Please LIKE 👍, FOLLOW ✅, SHARE 🙌 and COMMENT ✍ if you enjoy this idea! Also share your ideas and charts in the comments section below! This is best way to keep it relevant, support us, keep the content here free and allow the idea to reach as many people as possible. **
-------------------------------------------------------------------------------
💸💸💸💸💸💸
👇 👇 👇 👇 👇 👇

NASDAQ at Record Highs after US CPI report, but can it last?In today’s video, we break down the major market moves triggered by the July US CPI report. Headline CPI rose 0.2% month-over-month—right in line with expectations and a slowdown from the previous month. Year-over-year, headline inflation came in at 2.7%, just under the 2.8% forecast, while Core CPI rose 0.3% MoM (matching forecasts) but was a bit hotter at 3.1% YoY (vs. 3.0% expected).
These “not as bad as feared” inflation numbers kept hopes alive for a September Fed rate cut, pushing the odds of a cut to 96%. Markets responded strongly: the NASDAQ 100 closed at a record high, just shy of the 24K handle, with broad gains in tech and communication stocks, as traders bet on a more dovish Fed.
We also cover the technical setup for the NASDAQ 100 and key risk factors heading into the second part of August.
This content is not directed to residents of the EU or UK. Any opinions, news, research, analyses, prices or other information contained on this website is provided as general market commentary and does not constitute investment advice. ThinkMarkets will not accept liability for any loss or damage including, without limitation, to any loss of profit which may arise directly or indirectly from use of or reliance on such information.

NVIDIA Is it still a buy after its Earnings release?NVIDIA Corporation (NVDA) delivered stronger-than-expected second-quarter earnings on Wednesday, but its data center revenue came in slightly below forecasts as U.S. restrictions on H20 chip sales to China weighed on results. The result was a 3.1% fall on the company's stock in after-hours trading following the report.
The obvious question is this: Is it still a buy?
The answer can be given by purely looking at the technicals. Based on the bigger picture, the stock's 5-month pattern remains a Channel Up since the April 07 bottom, and in fact the recent dip on August 20 was a Higher Low exactly on the pattern's bottom and almost on the 1D MA50 (blue trend-line), which has been intact since May 06.
Given also the fact that the 1D CCI rebounded with aggression after marginally breaking below its oversold level (-100.00), similar to April 21, we expect NVIDIA to resume the bullish trend and extend this new Bullish Leg.
Since the last three Bullish Legs have all increased by a little more than +20%, we expect the price to easily reach our $200.00 long-term Target, before the next technical correction occurs.
-------------------------------------------------------------------------------
** Please LIKE 👍, FOLLOW ✅, SHARE 🙌 and COMMENT ✍ if you enjoy this idea! Also share your ideas and charts in the comments section below! This is best way to keep it relevant, support us, keep the content here free and allow the idea to reach as many people as possible. **
-------------------------------------------------------------------------------
💸💸💸💸💸💸
👇 👇 👇 👇 👇 👇
PALANTIR is dropping but below the 1D MA50 lies the best BUYLast time we looked at Palantir (PLTR) was almost 4 months ago (May 06, see chart below), giving a buy signal that gradually but surely hit our $185 Target:
This time, the stock has found itself on a short-term pull-back that is about to hits its 1D MA50 (blue trend-line) for the first time since April 21 (4 months). This is far from alarming as the strongest buy signal within its long-term (since February 2023) Channel Up, has been below the 1D MA50.
At the same time, the 3-year RSI Buy Zone (40.00 - 30.00) is also close to being tested, so once it does, we will technically get the most optimal buy confirmation.
Even though another 183% rise from the potential bottom is possible, we will pursue a more modest Target this time, especially as we get close to the end of the year (and potentially the Cycle).
The minimum rise the market has delivered upon a 1D MA50 break has been +58.11%. As a result, our Target will be $220.00.
-------------------------------------------------------------------------------
** Please LIKE 👍, FOLLOW ✅, SHARE 🙌 and COMMENT ✍ if you enjoy this idea! Also share your ideas and charts in the comments section below! This is best way to keep it relevant, support us, keep the content here free and allow the idea to reach as many people as possible. **
-------------------------------------------------------------------------------
💸💸💸💸💸💸
👇 👇 👇 👇 👇 👇

How Ride the AI Wave in 2025 | Top AI Stocks The AI boom is still making waves on Wall Street
Over the past 15 months, investors have injected more than $ 5 billion into tech sector funds. This surge was fueled by three consecutive interest rate cuts by the Federal Reserve in 2024, coupled with Donald Trump's presidential victory, which led investors to pour over $140 billion into the stock market, hoping tax reforms would boost corporate profits. A significant portion of this activity has been driven by the growing interest in artificial intelligence, with AI driven companies leading a remarkable 25% rally in the S&P 500 this year. Nvidia (NVDA), a key player in the AI sector, has soared 149% in the past year, while major tech firms like Microsoft (MSFT) and its collaboration with OpenAI, and Google’s (GOOG) Gemini project, have also contributed to the rise in stock prices.
The AI market is expected to expand from approximately $540 billion last year to over $1.8 trillion by 2030, with a projected compound annual growth rate (CAGR) of 20% through 2032. In the final weeks of his presidency, Joe Biden's administration introduced new regulations to block the export of US-made semiconductors to adversarial nations, including Russia and China. This move is part of the ongoing AI arms race, with the US aiming to maintain its lead in manufacturing the chips essential for powering AI technology.
AI Stocks: The Only ‘Bubble’ You Want to Be In
North America held the largest share of the global AI market in 2023, accounting for nearly 37%. Europe, Asia Pacific (APAC), and Latin America followed with shares of 25.5%, 24%, and 13.6%, respectively.
Whoever controls AI holds the power and the same is true in the corporate world. AI related stocks, such as Palantir Technologies (PLTR) and Nvidia, delivered triple digit returns and led the market in 2024. Growing investor interest has also made it easier to trade AI focused exchange-traded funds (ETFs), which offer exposure to broader industry themes rather than individual companies. However, performance can vary.
For instance, the Defiance Quantum ETF (QTUM) and the Invesco Semiconductors ETF (PSI) have shown comparable results since 2020, consistently outperforming the broader market.
Meanwhile, the iShares Future AI & Tech ETF (ARTY) has underperformed compared to the S&P 500. So, how can you identify the top AI stocks when certain ETFs are lagging? This is where the Quant Rating System comes in. Quant Ratings combine proprietary computer processing technology with "quantamental" analysis, allowing you to filter out the noise and focus on AI stocks with strong fundamentals that are expected to grow earnings at an above average rate.
Leading AI Companies Worldwide
Major tech giants like Amazon (AMZN), Google, Apple (AAPL), Meta (META), Microsoft (MSFT), and IBM (IBM) have invested billions into AI research to secure a dominant position in this highly profitable space. Whether it's backing high-potential startups like MSFT’s $11 billion stake in OpenAI, or supplying crucial AI hardware such as Nvidia's (NVDA) graphic processing units (GPUs), these companies are striving to stay ahead of competitors.
While generative AI tools like ChatGPT are undeniably shaping the global economy, the potential for significant returns from AI stocks is more nuanced. For instance, Palantir Technologies (PLTR) has dropped over 20% from its all-time high in December, receiving a "hold" rating from Seeking Alpha's Quant system and analysts across Wall Street as of January 9, 2025. Even Nvidia, despite a strong performance in 2024, has seen its stock show signs of stagnation. Other AI stocks are showing signs of potential overvaluation. For example, SoundHound AI (SOUN) recently dropped more than 16%, with analysts highlighting concerns over its unsustainable valuation given its weak fundamentals.
2025 Top AI Stocks
The hype in Silicon Valley can make it challenging to distinguish between AI stocks with long-term potential and those that are overhyped
Our data driven Quant system uses advanced computer processing and proprietary algorithms to analyze thousands of stocks in real time across a range of metrics like value, growth, profitability, EPS revisions, and momentum. To find the top performing AI stocks, I analyzed securities from three leading AI focused ETFs Global X Robotics & Artificial Intelligence ETF (BOTZ), Robo Global Robotics and Automation Index ETF (ROBO), and Global X Artificial Intelligence & Technology ETF (AIQ). From this analysis, I selected six top-performing stocks—three largecap and three small-to-medium-cap (SMID)—which represent the diverse opportunities in the AI space. These stocks, both from tech companies providing AI solutions and non-tech firms utilizing AI to enhance productivity, boast an average levered free cash flow margin of about 18.6% and have returned an average of 60% more than the past 12 months.
1. Twilio Inc
Market Capitalization $16.6B
Twilio, a cloud communications company, has returned nearly 51% over the past year and ranks second in the Top Internet Services and Infrastructure sector, just behind Kingsoft Cloud Holdings. The company’s growth has been driven by stronger revenues, reduced losses, increased cash flow, and the completion of a high-profile ETF investor Cathie Wood’s stake sale. Twilio’s strong Q3’24 earnings suggest it’s well-positioned to capitalize on the growing AI trend well into 2025, with its stock more than doubling since May.
Like many cloud computing companies, Twilio, based in San Francisco, gained prominence during the COVID-19 pandemic but initially struggled with high expenses and slow revenue growth. However, the surge in demand for generative AI, particularly through Twilio's CustomerAI platform which leverages large language models (LLMs) and natural language processing (NLP) to analyze customer data has played a key role in its remarkable recovery.
TWLO Revisions, Momentum, and Valuation
Over the past 90 days, Twilio has seen a remarkable 23 upward revisions to its earnings per share (EPS) and 27 revisions to its revenue projections from analysts, signaling a strong financial rebound. This turnaround is reflected in its ‘A’ Momentum Score, with six-month and nine-month price performances of 93.5% and 81.3%, respectively—both figures vastly outperforming the sector medians by over 1000%. As a result, Twilio has nearly doubled the performance of the S&P 500 in recent months.
Twilio also demonstrates solid growth prospects, with a forward EBITDA growth rate of 50.6% (783% higher than the sector median), year-over-year operating cash flow growth of 520.8% (3,348.45% above the sector median), and an impressive levered free cash flow margin of 107% (603% above the sector median). However, its average forward price-to-earnings (P/E) ratio of 30x indicates that Twilio trades at a premium compared to its peers, nearly 20% higher than the sector median.
2. Celestica Inc
Market Capitalization $12B
Celestica has seen a remarkable 255% increase in its stock price over the past year, driven by its strategic pivot toward AI infrastructure manufacturing. The company has carved out a niche in producing networking switches for data centers, and its Connectivity & Cloud Solutions segment, which makes up 67% of total revenue, has grown 42% year-over-year as tech companies invest more in AI-powered data centers. Its Q3 '24 results highlighted a 22% increase in revenue to $2.5 billion and record adjusted EPS of $1.04.
CLS Valuation, Momentum, and Growth
Celestica stands out for its attractive valuation, even with impressive returns in 2024. With a forward price-to-earnings growth (PEG) ratio of 0.87, the stock appears undervalued compared to its peers. It boasts an ‘A+’ Momentum Grade, having received six upward EPS revisions and eight revenue revisions from analysts in the past 90 days. Its Growth Grade has improved significantly, rising from ‘C+’ to ‘B+’ due to forward EPS growth of 49% and year-over-year diluted EPS growth of 88%, both significantly outperforming the sector median.
3. DocuSign
Market Capitalization $18.3B
DocuSign, known for its electronic signature services, has embraced AI in innovative ways, particularly by adding new AI features to streamline contract agreement processes. These AI-driven tools have helped the company’s stock surge more than 21% following its impressive Q3 '24 earnings, and the growth trajectory is expected to continue in 2025 as DocuSign expands into new markets, both domestically and in Europe. As SA Analyst Noah’s Arc Capital Management notes, DocuSign's AI features have proven invaluable for businesses, simplifying the often complex task of reviewing and managing contracts.
DOCU Growth, Valuation, and Profitability
DocuSign has demonstrated exceptional growth, including an ‘A+’ EBIT growth rate of 239.21% (10,710% above the sector median) and year-over-year diluted EPS growth of 1,852.2% (24,971% higher than its peers). While its overall ‘C+’ Growth Score is somewhat tempered by a low forward return on equity growth forecast of -29.58%, the company’s valuation looks compelling. Its trailing and forward P/E GAAP ratios of 18.6 and 17.9 are 38.6% and 41.5% lower than the sector medians, suggesting that DocuSign's shares are undervalued. Furthermore, its ‘A+’-Rated PEG ratio of 0.01, a 99% difference from the sector median, points to a strong value proposition for investors.
4. FARO Technologies
Market Capitalization $478.2M
FARO Technologies, based in Lake Mary, Florida, specializes in 3D measurement technology and has leveraged AI to establish itself as a leader in "smart factories" and "intelligent automation." Its scanning technology has been instrumental in improving productivity and accelerating production timelines. The company has seen nearly 54% growth over the past six months, benefiting from the expanding global 3D scanning market, projected to grow to $11.85 billion by 2032 at a compound annual growth rate (CAGR) of 13.11%.
In Q3, FARO reported $0.21 of nonGAAP EPS, marking its sixth consecutive quarter of exceeding expectations. This success is part of the company’s strategic plan, which includes the launch of a new line of laser scanners.
FARO Growth and Valuation
FARO's growth metrics stand out, with forward EBIT growth of 112.48%, 1,410.71% higher than the sector median, and an astonishing year-over-year levered free cash flow growth of 24,214.19%, 164,037% above the sector median. The company's forward EBITDA growth of 42.76%, 639.9% higher than the sector median, indicates robust growth ahead.
FARO's stock is undervalued according to its metrics. It has an EV/sales ratio of 1.41, 59% lower than the sector median, and a price-to-book ratio of 1.9, 45% below the sector median, making it an attractive investment at its current valuation.
5. Proto Labs
Market Capitalization $897 M
Proto Labs, a Minnesota-based company, specializes in on-demand manufacturing solutions, enabling businesses to avoid the costs associated with stocking large quantities of products. Despite a recent dip of around 16% in share price, Proto Labs remains a promising investment due to its strong profitability and its impressive cash flow of $24.8 million in Q3 2024, the highest since its 2020 acquisition of 3D printing company 3D Hubs.
Proto Labs has also seen five upward revisions to its EPS and five to its revenue over the last 90 days, signaling stronger-than-expected growth prospects. The company is positioned to benefit from the strong sector tailwinds of the global print-on-demand market, which was valued at $6.18 billion in 2022 and is expected to grow at a CAGR of 25.8% through 2030.
PRLB Valuation
Proto Labs boasts an impressive long-term growth rate of 25%, 119% higher than the sector's 11.4%, and a year-over-year capital expenditure (capex) growth of 74.4%, significantly outpacing the sector's 4.3%. This suggests that Proto Labs is reinvesting a large portion of its cash back into its operations to fuel future growth.
The stock is fairly valued with a forward PEG ratio of 0.06, indicating that it is significantly undervalued compared to its peers, at a 49.3% discount from the sector. Its price-to-book ratio of 1.36 is also an attractive metric, 52.83% lower than the sector median. However, its ‘D’-rated forward and trailing P/E ratios of 39.9 and 48.8, respectively, reflect its recent price decline, leading to an overall Valuation Grade of ‘C’.
6. Freshworks
Market Capitalization $4.9 B
Freshworks, a cloud based SaaS company founded in India, is a strong candidate for a "buy the dip" opportunity. After a rough 2024, shares in Freshworks have begun to rebound, thanks to increasing demand for its AI-enabled software solutions. The company serves over 68,000 customers, including global brands like American Express, Shopify, and Airbus. Its Q3’24 financial results were filled with positive indicators:
- 22% YoY revenue growth to $186.6M
- 21% YoY increase in free cash flow
- Raised full year guidance
- Announced a $400M buyback plan
- Maintains a debtfree balance sheet with strong liquidity
Freshworks also announced a 13% reduction in headcount, which is expected to improve margins further, in addition to the impact of its share repurchase program. The company is poised to benefit from the booming AI SaaS market, which is projected to grow at a CAGR of over 30% by 2031.
FRSH Growth, Valuation, and Momentum
Freshworks boasts an impressive A-’ Growth Score, underpinned by its solid revenue growth and forward revenue expansion of 17.8%, a 221.8% difference from the sector median. The company also has a 3-5 year long-term CAGR of 27.5%, significantly outpacing the sector by 824.2%. Its year-over-year capital expenditure growth stands at 83.3%, signaling reinvestment in future growth.
In terms of valuation, Freshworks has a forward PEG of 1.51, suggesting that the stock is available at a slight discount to its peers. Similar to Proto Labs, its higher-than-average P/E ratios are likely due to its recent dip of around 9.3% over the past month. One of the standout features of Freshworks’ stock is its ‘A’ Revisions Score, which reflects 17 EPS upward revisions and 16 revenue upward revisions in the past three months.
As the AI frenzy continues to dominate Wall Street, some of the valuations of major AI driven companies may be edging into overinflated territory. However,so far my Quant System highlights six ‘Strong Buy’ stocks that still exhibit strong fundamentals. These companies have, on average, risen about 60% over the past year, showcasing strong bullish momentum and solid valuations. For investors looking to integrate AI into their portfolios without succumbing to the hype, these stocks present a promising opportunity
Which AI stock are you loading and why?

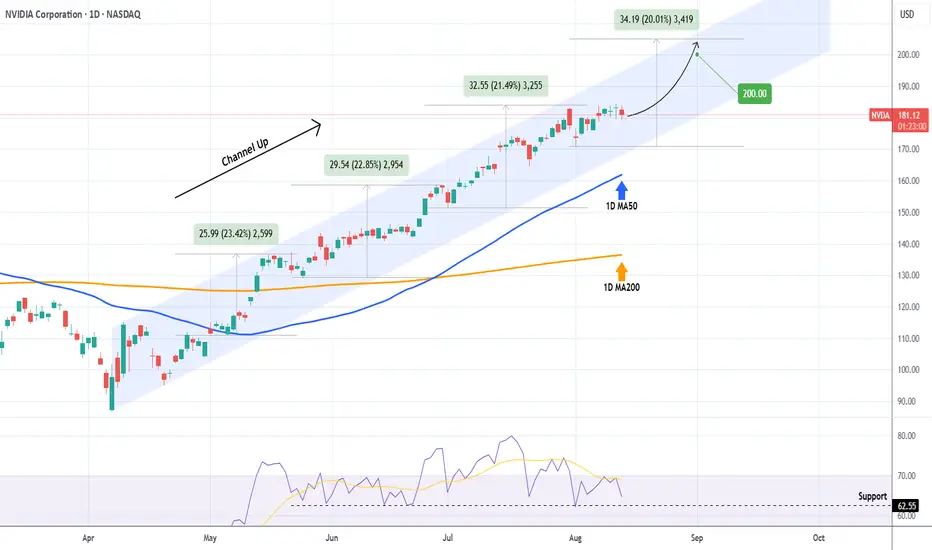
NVIDIA Is the path to $200 that easy?NVIDIA Corporation (NVDA) has been trading within a Channel Up since the April 07 market Low, being so aggressive that it has turned its 1D MA50 (blue trend-line) into Support since May 01.
The last 3 main Bullish Legs all rose by at least +20%. As long as the 1D RSI Support holds, we expect another such Leg, which would be enough for NVIDIA to reach the all important $200 psychological Target.
-------------------------------------------------------------------------------
** Please LIKE 👍, FOLLOW ✅, SHARE 🙌 and COMMENT ✍ if you enjoy this idea! Also share your ideas and charts in the comments section below! This is best way to keep it relevant, support us, keep the content here free and allow the idea to reach as many people as possible. **
-------------------------------------------------------------------------------
💸💸💸💸💸💸
👇 👇 👇 👇 👇 👇
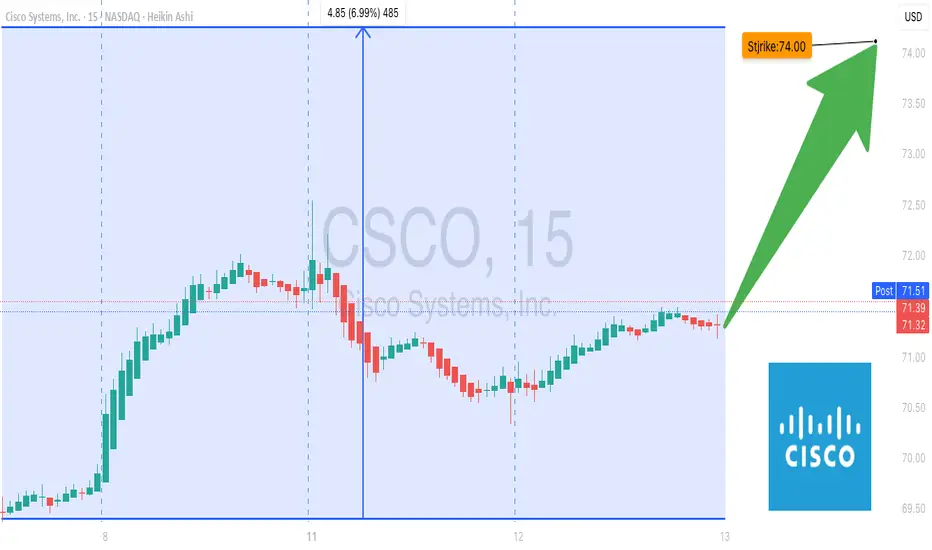
CSCO Earnings Play – Bullish Setup into AI Boom! (2025-08-12)
# 🚀 CSCO Earnings Play – Bullish Setup into AI Boom! (2025-08-12) 🚀
💡 **Cisco Systems (CSCO)** is setting up for a potential post-earnings breakout. Fundamentals, technicals, and sector momentum all align for a **moderate-to-high conviction CALL play**.
---
## 📈 Fundamentals Fueling the Bull Case
* **Revenue Growth:** +11.4% TTM – steady demand from enterprise & AI infrastructure
* **Margins Holding Strong:**
* Gross: **65.2%** 🏆
* Operating: **23.3%**
* Profit: **17.6%**
* **Earnings Consistency:** 8/8 quarters beat, avg. surprise **+5.1%**
* **Guidance Strength:** Forward EPS est. \$3.90 – confidence in profitability
---
## 📊 Options Market Intel
* **Low Volatility:** VIX at 15.52 → calmer market backdrop
* **Call Bias:** Heavy OI in \$73 & \$75 strikes → institutions loading up
* **Put/Call Skew:** Leaning bullish
* **Gamma Setup:** Low vol = reduced whipsaw risk
---
## 🔍 Technical View
* **Trend:** Trading above 20d (\$68.71), 50d (\$67.45), 200d (\$61.68) – clear bullish momentum
* **Resistance:** \$72.55 (52-week high) → breakout trigger zone
* **Support:** \$69.00 – defended by put concentration
* **Pre-Earnings Drift:** Steady climb → accumulation signs
---
## 🌍 Macro Tailwinds
* AI & cybersecurity demand surging
* IT spending cycle favorable for enterprise tech leaders like Cisco
* Sector rotation favoring growth & infrastructure plays
---
## 🎯 Trade Plan – Long Calls for Earnings Pop
**Type:** Buy to Open CALLs
**Strike:** \$74.00
**Entry Price:** \$0.85
**Expiry:** 2025-08-15
**Confidence:** 75%
📈 **Targets:**
* PT: \$2.00 (+135%)
* SL: \$0.42 (-50%)
* Time Exit: Within 2 hrs post-earnings if PT/SL not hit
---
## 🛡 Risk Management
* Max Risk: 1 contract = \$85
* R/R Ratio: \~1 : 2.5 – 4.0
* Avoid overnight hold past expiry
---
### 🧠 TradingView Takeaway
This is a **trend continuation earnings bet**. Strong balance sheet, bullish options flow, and favorable macro backdrop make CSCO a prime candidate for an earnings breakout.
---
💬 **Question:** If CSCO clears \$72.55, do you see a \$75+ close by Friday?
\#CSCO #EarningsPlay #OptionsFlow #BullishSetup #AIStocks #BreakoutWatch #TradingViewSetup #TechnicalAnalysis #LongCalls #EarningsTrade
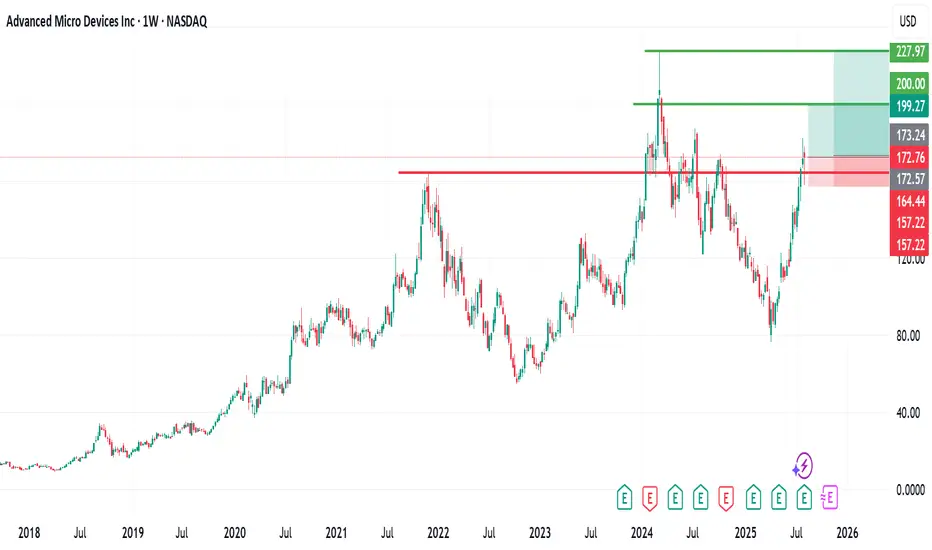
Advanced Micro Devices (AMD) Stock AnalysisAdvanced Micro Devices (AMD) Stock Analysis
AMD, listed on NASDAQ, has generally been on an upward trend. However, last week, the stock experienced a brief flash downturn, dropping to around the $157 level.
Since then, it has recovered and is currently trading at approximately $172 per share.
Outlook:
I remain bullish on AMD and anticipate a potential move toward the $200 level, with a longer-term target around its all-time high near $226.
For my entry strategy, I have added positions at different levels, with an initial entry around $160 and another at the current level.
This gives me a total of three buy entries, positioning for a mid- to long-term hold.
Let’s see how it unfolds! If you have any insights or thoughts, please share them in the comments. I’d love to connect with you. Don’t forget to follow, share, and subscribe. Thank you.
RDDT Earnings Play — July 30 (BMO)
## 🚀 RDDT Earnings Play — July 30 (BMO)
**🎯 Bullish Call Trade | 75% Confidence | High Momentum Setup**
---
### 📈 REDDIT, INC. (RDDT) – EARNINGS SNAPSHOT
🧠 **Revenue Growth**: +61.5% TTM — AI + Ads combo paying off
💸 **Margins**:
• Gross: 90.8% ✅
• Op: 1.0% 🚩
• Profit: 8.1% 👍
🧾 **EPS Surprise Streak**: ✅ 5 for 5 | Avg. +191%
🎯 **Target Price**: \$155.58 (+9.5%)
⚖️ **Forward P/E**: 222.6 — Rich but justified?
**Score: 8/10**
📊 Sector: Comm Services (AI-driven tailwinds)
---
### 💥 OPTIONS FLOW SNAPSHOT
💰 Calls Stack at \$150 & \$160
🛡️ Puts cluster \$140–\$149 = Hedges, not bearish bets
📉 IV High = Juicy premiums
📈 Gamma Bias: Positive Skew
**Score: 7/10**
---
### 🔍 TECHNICAL CHECK
📍 Price: \~\$145.32
🧭 20D MA: \$147.89
📊 RSI: 59.5 (Momentum neutral, room to run)
🔓 Resistance: \$150
🛡️ Support: \$140
**Score: 6/10**
---
### 🌎 MACRO CONTEXT
🧠 Sector tailwinds from AI hype + digital ad rebound
🛑 No major regulatory red flags
**Score: 8/10**
---
## 🔥 THE TRADE SETUP
**📈 Direction**: Bullish
🎯 **RDDT 08/01 \$150C**
💸 **Entry**: \$9.55
🛑 **Stop Loss**: \$4.78
📈 **Target**: \$19.55+
🧮 **Size**: 1 Contract = \$955 Risk
🕒 **Entry Timing**: Pre-earnings close
📆 **Earnings Time**: BMO (Before Market Open)
📊 Expected Move: \~5%
📈 Setup = High risk / High reward, theta-sensitive
---
## ⚡ TRADE PLAN
✅ Take partial profit at 100%, full at 200%
⏳ Exit within 2H post-ER if target unmet
🛑 Cut below \$4.78 to cap drawdown
---
## 🧠 CONVICTION SCORE
🎯 75% Bullish Bias
📊 Based on fundamentals, options, and flow
📉 Risk = Valuation + Thin Op Margin
📈 Reward = Explosive upside w/ surprise history
---
💬 **Watch for \$150 breakout. If cleared post-ER = moonshot to \$160 possible.**
📢 #RDDT #EarningsTrade #RedditStock #CallOptions #AIStocks #TechMomentum #OptionsFlow #IVSurge #TradingViewIdeas #SwingTrade #OptionsStrategy #VolatilityPlays #RDDTstock

META Earnings Trade Setup — July 30 (AMC)
## 🧠 META Earnings Trade Setup — July 30 (AMC)
📈 **META (Meta Platforms Inc.)**
💥 **Confidence**: 85% Bullish
💡 **Play Type**: Pre-earnings call option
📊 **Fundamentals + Flow + Setup = High Conviction Swing**
---
### 📊 FUNDAMENTALS SNAPSHOT
✅ **Revenue Growth**: +16.1% YoY
✅ **Profit Margin**: 39.1%
✅ **Gross Margin**: 81.8%
📈 **8/8 EPS Beats** — Avg Surprise: +13%
🧠 **Digital Ad Rebound + AI Integration = Growth Engine**
🟢 **Score: 9/10**
📌 Bottom line: Elite execution + consistent guidance beats
---
### 🔥 OPTIONS FLOW CHECK
💰 **Call Walls**: \$720 / \$730
📈 **Call/Put Skew**: Bullish tilt
🔎 **IV Rank**: 0.65 — High enough for a move, not extreme
📈 **Market Expectation**: \~6% move
🟢 **Score: 8/10**
📌 Institutional flow leans long — smart money eyes upside
---
### 📉 TECHNICAL SETUP
📍 **Price**: \~\$700
📉 RSI: 34.34 → OVERSOLD
📉 20D MA: \$713.27 (near-term bounce target)
📌 Support: \$692.50 | Resistance: \$720
🟡 **Score: 7/10**
📌 Post-consolidation rebound setup into earnings
---
### 🌎 MACRO CONTEXT
💡 Growth + AI names in focus
📢 Communication Sector → Risk-On Rotation
📌 META riding digital ad/AI secular trends
🟢 **Score: 8/10**
📌 Macro tailwinds match company strengths
---
## 🎯 TRADE IDEA
**META 08/01 \$730 CALL**
💵 Entry: \$10.00
🎯 Target: \$30.00 (300% ROI)
🛑 Stop: \$5.00 (50% loss cap)
⏰ Entry: Pre-close on July 30 (AMC earnings)
📏 Size: 1 Contract (Risk \$1,000 max)
### ⚖️ Risk/Reward
* Max Risk: \$1,000
* Target Profit: \$3,000
* IV Crush Protection: **Exit within 2 hours post-earnings**
---
## 📌 WHY IT WORKS
✅ Meta beats 8 straight quarters
✅ Fundamentals elite
✅ Bullish options stack
✅ Oversold tech setup
⚠️ Risk? Always — but *structured speculation wins* 📐
---
📣 Tag someone who trades earnings like a sniper 🎯
\#META #EarningsPlay #OptionsTrading #IVCrush #CallOptions #TechStocks #AIStocks #TradingView #DigitalAds #SwingTrade #StructuredRisk

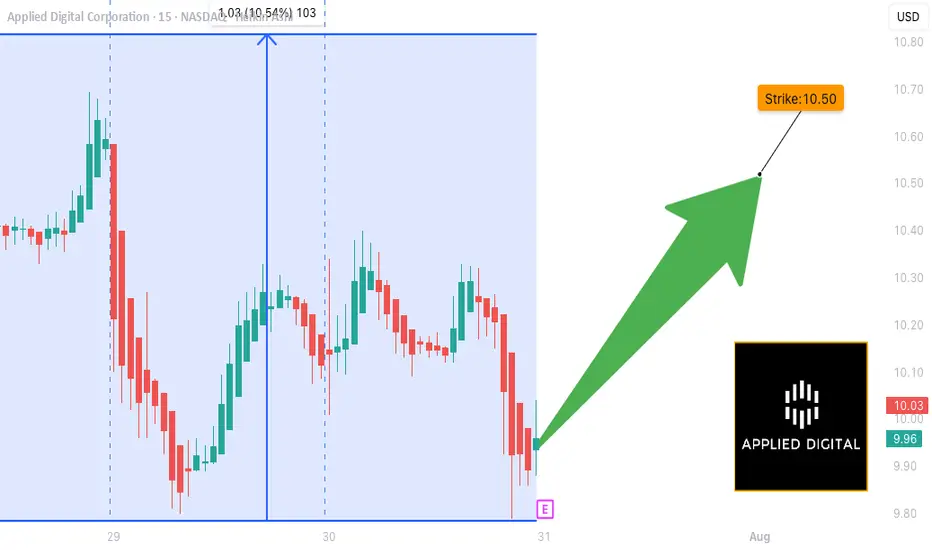
APLD (Applied Digital):EARNINGS TRADE SETUP (2025-07-30)
🚨 **EARNINGS TRADE SETUP: APLD (Applied Digital)**
🗓️ Earnings: **July 31 (AMC)**
💥 Confidence: **65% Moderate Bullish**
🔥 Recent Run: **+94% past 3 months**
🧠 AI Infrastructure Hype + High IV = Opportunity
---
### 📊 FUNDAMENTALS SNAPSHOT
🟢 **Revenue Growth**: +22.1% YoY
🔴 **Profit Margin**: -110.4%
🔴 **Operating Margin**: -34.7%
⚠️ Historical EPS Beat Rate: **12% only**
📈 Analyst Target: **\$14.61** (+42.8% upside)
🔎 **Verdict**: High growth, deep losses — speculative with upside
---
### 🧠 OPTIONS FLOW
💣 **High IV Crush Risk**
🟥 **Put Wall**: \$10.00 (6,700 contracts)
🟩 **Speculative Calls**: \$10.50 & \$11.00 loaded
⚖️ Mixed Sentiment → Tilted Bullish
---
### 📉 TECHNICAL CHECK
💹 Price: **\$10.12**
📉 Below 20D MA (\$10.31)
📌 Support: **\$10.00**
📌 Resistance: **\$10.50**
⚠️ RSI Cooling → Watch for breakout or rejection
---
### 💥 TRADE IDEA
**🎯 Call Option — Strike \$10.50 — Exp 08/01**
💵 Entry: \$0.57
🚀 Profit Target: \$2.28 (200–400% ROI zone)
🛑 Stop Loss: \$0.285
📈 Size: 1 contract (2% of portfolio)
🕓 Exit: 1–2 hours post earnings to avoid IV crush
---
### 🧠 TRADE LOGIC
Risky setup — but technicals + AI narrative + speculative flow = **earnings lotto ticket with strategy.**
💬 *"Speculation with structure beats blind YOLO."*
---
📌 Tag a trader who likes calculated risk 📈
📉 Don’t forget to scale OUT, not just IN.
\#APLD #EarningsPlay #OptionsTrading #TradingView #AIStocks #YOLOWithStops #IVCrushProof #CallOptions #SwingTrade #BullishSetup
Semiconductors & SOXL: A Bull ThesisWhy Semiconductors?
Virtually every single electronic device contains some form of a semiconductor unit within its components. The entire Bull theory on semiconductors as an industry could be reduced to this one sentence. The following, however, will introduce concepts contingent to the understanding of what is shaping the market for semiconductors. The weight of intra-industry, political, macroeconomic, and physical factors discerning an inconceivable upside potential for certain investments carrying maximum exposure to the sector, such as AMEX:SOXL . The last section contains my technical approach to trading SOXL.
We begin with the fundamental, and by fundamental, I refer to the simplest reasons for what is happening in the market up until now; [ Early morning Monday, 7/28 ].
Macroeconomic Context
Like essentially the rest of the market, SOXL hit its 1 year low of 7.23 USD on Monday, 4/7, following the announcement (and soon postponement) of global tariffs at levels not observed since the early 30's. This of course sparked a panic spiral in the entire market, leading to outflows from the S&P 500 of approximately 70 billion USD during the month of April. During this time we also saw a new, but familiar narrative emerge. Asset Managers, Such as J.P. Morgan set historically low price targets on the S&P 500, going as low as 5,200 USD. They reinforced their PTs with publications warning investors across the world that the risk of recession in the United States was raised to 80%, and this message was relayed across all media in parabolic fashion. While it does not seem too outward to assume an increased risk of recession due to tariffs by looking back on what we learned of the consequences from the Smoot-Hawley Tariff Act of 1930. There exists a widely overlooked, fundamental , reason as to why I can claim that the REAL risk of recession at the time that J.P. Morgan assigned an 80% risk of recession, was in actuality, 0% (I assume J.P. Morgan knew this but pushed the narrative anyways in order to acquire massive equity at a discount). If anyone has taken introductory macroeconomics in their lifetime, they may be familiar with the function for calculating GDP via the expenditure approach: GDP = C + I + G - NX. Now, why am I referencing high school/college economics basics, the answer to that lies in how we determine our rate of economic growth in the context of tariffs. The part of this formula that we must focus on is NX or Net Exports, the negative factor to GDP. Tariffs, if implemented would effectively decrease import volume, resulting in a smaller Net Exports, and ultimately a higher GDP calculation. Now, what makes this scenario unique, the tariffs having been postponed shortly after their inception, allowed US retailers to engage in front running, or the accelerated purchasing of foreign goods in advance of tariffs. During the month of April, we saw a 5.4% increase in import volume in US west coast ports. This increase in imports effectively caused the inverse impact on GDP growth that import tariffs themselves would have caused: front-running lead to import uptick, leading to a greater Net Exports, which results in lower (negative) GDP growth. Essentially, tariffs in the short-term increases GDP growth (in the long term deadweight loss, and cost structure distortion comes in to play, but that doesn't matter yet), however , tariffs that are announced but not immediately implemented will result in a lower GDP growth, coupled with uncertainty surrounding the whole situation that translated into a cut in CapEx as companies scrambled to determine if tariffs would f*ck them over or not. This argument is further supported by the trends observed in the foreign exchange market. You may have heard in the news that we are experiencing a period of "Dollar Weakness", and while, yes, you can clearly see that the USD has fared rather poorly against other currencies in most major dollar pairs over the past few months. The agent behind this isn't just that the dollar happens to be weak, it is a combination of factors that generate noise and volatility in the forex market. The two main factors highlighted by the media are 1. The obvious political policy instability, pushing bond yields higher, plus a significant debt ceiling raise as per the BBB and 2. the expectations of interest rate cuts over the next year. The other, less recognized major factor to dollar weakness is exactly what we described above: Increased imports means more dollars flowing out of the economy. When these dollars land abroad, they are converted into the native currency, driving down the demand for the dollar. Notice how none of the reasons described above, actually have anything to do with what truly drives foreign exchange markets. Over time, the strength/weakness of a currency is directly correlated to the strength/weakness of the underlying economy. To say that we can expect dollar weakness due to the aforementioned reasons outright ignores the economic growth potential that exists in our economy at this current time, subsiding the out-of-proportion tariff fears as a proponent to an economic crisis. In an all-encompassing view, what I would describe to be occurring on the macro level is a sort of "slingshot" effect: Trade imbalances and private sector response to policy unclarity results in a pullback in economic growth, one that we are now experiencing as a short-term effect. From a medium-long term perspective, assuming that tariffs aren't persistent in the long term, we would see full fledge economic boom, driven by non other than the growth of our technology sector, which at it's core, lies the almighty semiconductor.
Growth of AI as a driver of Semiconductor demand: Stable trajectory or Bubble Territory?
Having laid the economic framework for picking the general direction our market is heading in, we can now begin to talk about the internal combustion occurring within the world of technology, and the two letter term associated with just about every cool thing in the business world, that is of course AI. Now just to clarify, AI is not new, its been around for at least 20 years and has a well established role in the world prior to the existence of ChatGPT. What changed so drastically in recent years is the breakthrough into a new form of artificial intelligence, known as "Artificial General Intelligence" or AGI. Long story short: AGI's primary difference in the business context is the colossal amount of electrical infrastructure and computing power that is demanded by the development of these mega language models. As a result of the high barrier for entry to this new industry, only 5 AGI companies have arisen to the global stage: OpenAI, Google DeepMind, Anthropic, Microsoft, and DeepSeek. Increasing competition in this space through more players entering the market is unlikely at this time as the cost to create a standalone AGI model is so astronomical. This is a particularly good thing because it tells us that AGI as an industry can result in natural monopolies. The ultra-intensive RnD costs and Data Center infrastructure demands make it more sensical to have a greater number of resources dedicated to producing 1 AGI model, instead of dividing resources to develop multiple less optimized models (similar to how a water company holds a natural monopoly as competition in that industry would result in no foreseeable benefit to it's customers). A further effect from this dynamic lies in how businesses in this industry scale to expand, and its pretty straightforward: the more megawatt computing power a model can access, the more parameters a model can account for, and the more vast the dataset that model can train on, with enhancing speed and efficiency (GPT 4o takes into account >500B parameters in a given query). We see the concept of natural monopoly playing out as the concentration of market capitalization is becoming more extreme where firms like Google, Microsoft, and NVIDIA are absorbing larger share of the market, while trading at ever increasing Price/Earnings multiples. To many, this reflects a trend we saw during the dot com bubble, however what makes the AGI industry different is the nature of the good or service provided. During the dot com boom, companies saw speculative value based on only the fact that their business existed on the .com domain. We know that each of these businesses are unique, providing a good or service across whatever industry they were part of, the only thing having in common was that dot com. The major oversight that took place during the turn of the dot com era was that the success of these businesses wasn't in truth due to them ending in .com, but whether the idea, and execution behind the underlying business is strong or not. Like how Amazon and Facebook saw unparalleled success not just because they were .coms, but because they were pioneering business models that would attract global demand to the services they were providing. The business of AGI has a sort of homogenous property. All AGI companies produce a service that is extremely similar in nature, the only ways they can compete with one another is through Capital Expenditure towards harnessing more computing power. This is the main reason capital is concentrating in a handful of companies trading at high multiples. To me, this is not an indication of a tech bubble but rather a product of how the AGI industry is poised to grow within our economy.
AGI as a Factor of Production
To get even more philosophical, we can think about how AGI itself enhances economic growth. We already see AGI tools applied in various ways, but the most widespread application pertains to the enhancement of human capital. While it is possible to make AGI models complete ongoing tasks completely on their own with zero human input, its far more common to see AGI tools be used, well, as tools. What I mean is that firms are not looking to replace human workers with AI ones (certain exceptions may include the manufacturing industry), instead they want to integrate AGI tools into their workforce as a means of optimizing regular processes, allowing them to access and process information with tremendous efficiency. The most observable economic outcome of this is firms being able to cut costs in human capital requirements, allowing them to achieve the same level of workflow with a smaller number of employees, or outsourcing solutions to business processes by way of automation utilizing AGI. The possibilities are endless and the economic impact of AGI appears to write itself new economic theory to explain how business growth is accelerating in unprecedented ways.
Semiconductor Physical Limitations: Blessing or Burden?
In 1965, Gordon Moore articulated his observation which would come to be known as Moore's Law. He observed that the number of transistors in an integrated circuit doubles approximately every 2 years. Based not so much on law of physics, Moore's law describes an empirical relationship between time and the number of transistors per chip, suggesting that the rate of production advancements would allow for such doubling to occur on a biannual basis. And to Gordon's own surprise, he was right. Transistor count for a given chip roughly doubled every 2 years for the following 50 years. However, Gordon also predicted that Moore's Law would come to an end in 2025, where transistor sizes would reach the physical limit of 2 nanometers (10-15 silicon atoms in width). While it may appear as a bottleneck to the semiconductor and AI industry, not being able to fit anymore transistors on one chip, but in reality, this limitation pressures companies to pursue innovations such as semiconductor packaging, which is NVIDIA's bread and butter. This technique allows for the stacking and integrating of many different chips to perform together as one. This technology has already proven wildly successful and is the backbone to virtually all of NVIDIA's GPU products. Google has invented their own method to getting around the physical limitation of silicon chips, producing AI-specialized integrated circuits known as Tensor Processing Units (TPUs). Catering these innovative solutions to expanding the frontier of AGI is almost a given.
How to play this market: A Technical Approach
If you have made it this far, I commend you. The following describes my approach to analyzing price activity in SOXL:
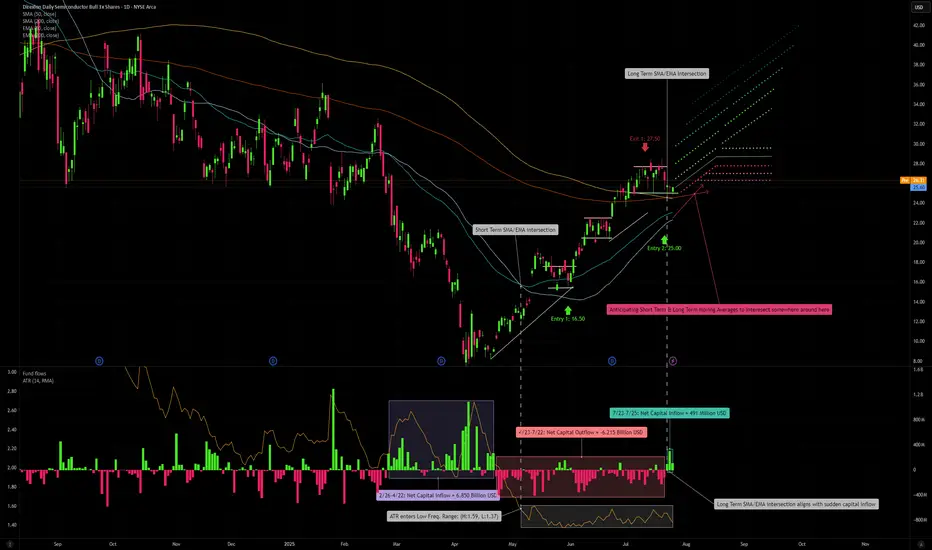
My First entry into SOXL took place on 5/30 with a unit cost of 16.50 USD. Two things can be noted prior to this entry. 1: Fund flows during late February, into March, and through April were extremely high, net inflow of 6.85 Billion USD, however price movement did not reflect the huge inflow until late April/early May where we began to see upward price direction. The beginning of June marked the start of the market bull rally which consolidated into our current price range of 25-28 USD, following contingent earnings releases of NASDAQ:ASML , NYSE:TSM , NASDAQ:NXPI and NASDAQ:INTC . The most recent pullback was a combination of a slightly concerning outlook from ASML, stating that tariffs on the EU would negatively affect projected sales growth for the 2026 fiscal year. As for TSM, there is not one concerning thing that could be said regarding the state of its business growth other than the New Taiwan Dollar gaining considerable strength over the USD amid trade relations between the US and Taiwan, affecting TSM's gross margin by an estimated 6%. NXPI released a sub par earnings and revenue growth outlook, but in my opinion this is not to be too heavily objectified as NXPI produces chips primarily for the Automotive sector, thus making it's sales heavily contingent on supply chain issues being faced by automotive manufacturers in leu of tariffs. NXPI carries a 3.5% market share in semiconductors whereas TSM carries a 68% market share. Lastly, INTC, earnings release I am almost embarrassed to talk about. If it were up to me I'd say they sell their plants in Ohio to TSM and look into opening a fruit stand instead. The most important earnings releases have yet to come though. NASDAQ:MSFT is just around the corner on 7/30, and NASDAQ:NVDA announces on 8/27. These two earnings reports will carry major weight in hinting the overall direction, momentum the market sees in AI demand growth, and the technology sector as a whole. Speculating, I have high expectations that both MSFT and NVDA will top all estimates, pushing the bar higher for 2025 into 2026.
If we look at our short-term 50-day SMA/EMA, you will notice a crossover occur on 5/6, a minor indication of a short term positive trend. Alone this is insignificant, but if we look at our 14-day Average True Range, we can see that this crossover aligns with a fall in ATR that would persist between the values of 1.37 and 1.59. This low ATR value signals that trailing volatility is actually quite low for semiconductors, considering the currently mixed market sentiment. Further along we see that price has crossed above both our long-term, 200-day SMA/EMA and a crossover occurred between the two on 7/23, serving as a small indication of a positive long term trend. Once again, not super significant on its own, but you will notice that the convergence aligns perfectly with a sharp increase in fund inflows, netting 491 Million USD in a matter of 3 trading days. If we see a continuation of net inflows over the several days, we can expect a near future extension of our bull rally, a semi-cyclical wave of inflows that concentrate during consolidation periods (which we have seen take place in the current price range between 25-28 USD following my first exit at 27.50 USD). If we extrapolate both our short-term and long-term SMA/EMA, we can anticipate a crossover to occur in the coming days to weeks. If this occurred, that would further reinforce our expectation for a positive long term trend. I have already locked in my entry 2 with a limit order executed at 25 USD. If all of the above conditions are met, I would confidently predict that we may see SOXL trade at around 42 USD in the coming months.
One more thing I would like to note, if we zoom out to our 5 year historical price progression, we can identify the previous high of 70.08 USD occurring on 7/11/2024. We know that the bull rally which took place in July of last year can be attributed to the first realization of AI as a driver for semiconductor demand, combined with renewed interest in GPU technology for applications in crypto. If we compare AI-related Capital Expenditure in fiscal year 2024 to AI-related Capital Expenditure of the first half of 2025 fiscal year: 246 Billion USD made up AI-related CapEx for all of 2024, vs first 6 months of 2025, adding up to 320 Billion USD. That is a 30% increase in capex, and we still have another 5-6 months to go. Just some food for thought.
Do you believe all of the above has been priced into SOXL, leave your thoughts in the comments!
Disclaimer
You must obviously keep in mind, SOXL is a 3x leveraged ETF, you can expect volatility with such type of investment. However, in capturing a bullish market, a 3x leveraged investment may produce greater than 3x the returns as the underlying (non leveraged) assets, due to the effect of compounding growth of returns over time. However, the same is true for sideways, or bearish markets, losses may be amplified to greater than 3x. If this is an uncertainty you do not wish to be exposed to, I would opt for the non-leveraged Semiconductor ETF ( NASDAQ:SOXX ), or divide your allocation across the top 5-10 equity holdings of SOXL. Please remember to employ your OWN due diligence before making any investment decision, as none of what I am saying shall serve as financial advise to you, the reader.
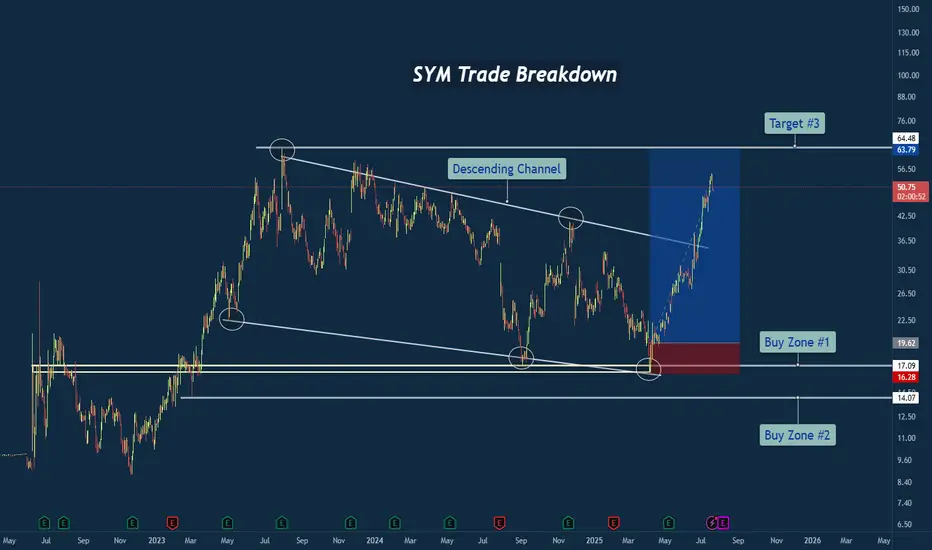
SYM Trade Breakdown – Robotics Meets Smart Technical's🧪 Company: Symbotic Inc. ( NASDAQ:SYM )
🗓️ Entry: April–May 2025
🧠 Trade Type: Swing / Breakout Reversal
🎯 Entry Zone: $16.28–$17.09
⛔ Stop Loss: Below $14.00
🎯 Target Zone: $50–$64+
📈 Status: Strong Rally in Motion
📊 Why This Trade Setup Stood Out
✅ Macro Falling Wedge Reversal
After nearly two years of compression inside a falling wedge, price finally tapped multi-year structural support and fired off with strength. This wasn’t just a bottom — it was a structural inflection point.
✅ Triple Tap at Demand Zone
Symbotic tapped the ~$17 area multiple times, signaling strong accumulation. Volume and momentum picked up with each successive test, showing institutional interest.
✅ Clean Break of Trendline
Price broke through the falling resistance trendline decisively, confirming the bullish reversal and unleashing stored energy from months of sideways structure.
🔍 Company Narrative Backdrop
Symbotic Inc. isn't just any tech stock. It’s at the forefront of automation and AI-powered supply chain solutions, with real-world robotics deployed in major retail warehouses. That kind of secular growth narrative adds rocket fuel to technical setups like this — especially during AI adoption surges.
Founded in 2020, Symbotic has quickly become a rising name in logistics and warehouse automation, serving the U.S. and Canadian markets. With robotics in demand and investors chasing future-ready tech, the price action aligned perfectly with the macro theme.
🧠 Lessons from the Trade
⚡ Compression = Expansion: Wedges like this build pressure. When they break, the moves are violent.
🧱 Structure Never Lies: The $17 zone was no accident — it was respected over and over.
🤖 Tech Narrative Boosts Confidence: Trading is easier when the fundamentals align with the technicals.
💬 What’s Next for SYM?
If price holds above the wedge and clears the $64 resistance, we could be looking at new all-time highs in the next cycle. Watching for consolidation and retests as opportunity zones.
#SYM #Symbotic #Robotics #Automation #AIStocks #BreakoutTrade #FallingWedge #SwingTrade #TechnicalAnalysis #TradingView #TradeRecap #SupplyChainTech
ORACLE Can you foresee it at $2000??Oracle (ORCL) is having perhaps the most dominant recovery from Trump's Tariff lows out of the high cap stocks, trading comfortable on new All Time Highs.
This is no surprise to us, as like we've mentioned countless times on our channel, we are currently at the start of the A.I. Bubble and heavy tech giants are expected to see massive gains until 2032, where we've calculated the end of this Bull Cycle and the start of a strong Bear.
As mentioned, this situation is extremely similar to the Dotcom Bubble of the 1990s. Of course Oracle is nearly impossible to repeat the +38637% gains of that Golden Decade after the 1990 Oil Crisis but in Fibonacci price and time terms, it can technically complete a +3411% rise and hit $2000 in the next 7 years.
If you have a long-term investor mindset like us, this is a must stock to buy and hold.
-------------------------------------------------------------------------------
** Please LIKE 👍, FOLLOW ✅, SHARE 🙌 and COMMENT ✍ if you enjoy this idea! Also share your ideas and charts in the comments section below! This is best way to keep it relevant, support us, keep the content here free and allow the idea to reach as many people as possible. **
-------------------------------------------------------------------------------
💸💸💸💸💸💸
👇 👇 👇 👇 👇 👇

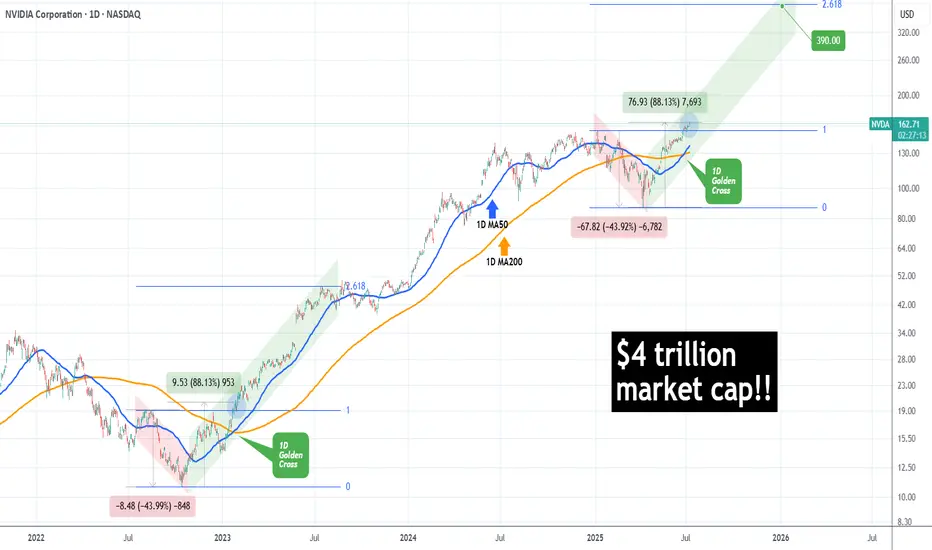
NVIDIA made history! First company with $4 trillion market cap!NVIDIA Corporation (NVDA) became today the first company in history to surpass a $4 trillion market value, as A.I. bulls extended the recent rally and pushed the price past the approximate $163.93 level needed to reach this market capitalization threshold.
The long-term trend on the 1D time-frame couldn't look more bullish. Coming off a 1D Golden Cross less than 2 weeks ago, the price has turned the 1D MA50 (blue trend-line) into Support and sits at +88.13% from the April 07 2025 Low.
This is the exact set-up that the market had when it was coming off the 2022 Inflation Crisis bottom (October 13 2022). As you can see, both fractals started with a -44% decline, bottomed and when they recovered by +88.13%, there were just past a 1D Golden Cross. In fact that Golden Cross (January 24 2023) was the last one before the current.
NVIDIA entered a Channel Up (green) on its recovery and for as long as the 1D MA50 was supporting, it peaked on the 2.618 Fibonacci extension before it pulled back below it.
If history repeats this pattern, we are looking at a potential peak around $390, which may indeed seem incredibly high at the moment, but as we pointed out on previous analyses, the market is in the early stages of the A.I. Bubble, similar to the Internet Bubble of the 1990s.
-------------------------------------------------------------------------------
** Please LIKE 👍, FOLLOW ✅, SHARE 🙌 and COMMENT ✍ if you enjoy this idea! Also share your ideas and charts in the comments section below! This is best way to keep it relevant, support us, keep the content here free and allow the idea to reach as many people as possible. **
-------------------------------------------------------------------------------
💸💸💸💸💸💸
👇 👇 👇 👇 👇 👇
AMD Stable Channel Up targets $168.Advanced Micro Devices (AMD) has been trading within a Channel Up since the April 08 market bottom. With the 4H MA50 (blue trend-line) as its Support since April 30, the pattern has shown incredible consistency, with the past two pull-backs almost touching the 0.382 Fibonacci retracement level.
As a result, given also the fact that the 4H RSI is supported by the Higher Lows trend-line, we view the current bounce as a solid buy opportunity for the short-term. We are targeting $168, which is the -0.5 Fibonacci extension, the level that the previous Higher High reached.
-------------------------------------------------------------------------------
** Please LIKE 👍, FOLLOW ✅, SHARE 🙌 and COMMENT ✍ if you enjoy this idea! Also share your ideas and charts in the comments section below! This is best way to keep it relevant, support us, keep the content here free and allow the idea to reach as many people as possible. **
-------------------------------------------------------------------------------
💸💸💸💸💸💸
👇 👇 👇 👇 👇 👇

AMD Major Lower Highs/ 1W MA50 break-out.It was only 9 days ago (June 16, see chart below) when we called for a potential bullish break-out on Advanced Micro Devices (AMD) above the 1W MA50 (blue trend-line):
The break-out did happen, this 1W candle is already considerably above its 1W MA50 and based also on the level the 1W RSI is at right now, it may resemble more the March 13 2023 1W candle instead of the January 30 2023 as previously thought.
The reason is the major break-out of the All Time High (ATH) Lower Highs trend-line that came along with the 1W MA50. As you can see, it was on the March 13 2023 1W candle that AMD broke above that trend-line with the 1W RSI being on the same level (66.00) as today.
This candle formed a short-term Top, with the price initiating a 1.5 month pull-back that re-tested the 1W MA50 as Support and then moved on to complete the +143.12% Bullish Leg from the Channel Up bottom.
As a result, we can't rule out the first wave of short-term profit taking by next week. But a potential 1W MA50 test, will be another long-term buy entry in our view. Our $185.00 Target remains intact.
-------------------------------------------------------------------------------
** Please LIKE 👍, FOLLOW ✅, SHARE 🙌 and COMMENT ✍ if you enjoy this idea! Also share your ideas and charts in the comments section below! This is best way to keep it relevant, support us, keep the content here free and allow the idea to reach as many people as possible. **
-------------------------------------------------------------------------------
💸💸💸💸💸💸
👇 👇 👇 👇 👇 👇

AMD First touch of 1W MA50 after 8 months!Advanced Micro Devices (AMD) hit today its 1W MA50 (blue trend-line) for the first time in almost 8 months (since October 28 2024). This is a crucial test as the las time this level broke as a Resistance following a Channel Up bottom rebound was on the week of January 30 2023.
When that happened, the Bullish Leg extended the upside to complete a +143.12% rise, before the next 1W MA50 pull-back.
As a result, if we close the week above the 1W MA50, we expect to see $185 before the end of the year.
-------------------------------------------------------------------------------
** Please LIKE 👍, FOLLOW ✅, SHARE 🙌 and COMMENT ✍ if you enjoy this idea! Also share your ideas and charts in the comments section below! This is best way to keep it relevant, support us, keep the content here free and allow the idea to reach as many people as possible. **
-------------------------------------------------------------------------------
💸💸💸💸💸💸
👇 👇 👇 👇 👇 👇

$SMCI "Buy The Dip" Value AreaSMCI (Super Micro Computer) has weathered the storm from all the negative press and I believe it is poised to go on a big run. This $26-$47 area is the BEST value you are going to get on it. This is probably the last discount before takeoff. We may not see this level again. As NVDA continues to fly, so will SMCI. Always do your own DD.

$GTLB: AI SaaS Software stock for tactical and long-term tradeIn this blog space we focus a lot on the AI trade. Be it semiconductors, AI powered Cybersecurity, AI Powered Fintech or just the industry itself, but we have not quietly focused on the AI Software stocks. The second and third derivatives of the AI trade will be more on the software space than Semiconductors where most of the future value will be accrued. Now within the AI Software space we have discussed NASDAQ:CRWD strike as one of our favorites, but can there be other names which can give us a lot of Alpha in the near and long term?
In my opinion NASDAQ:GTLB is one such stock. Gitlab provides software developers productivity tools to develop software faster, better and securely. Coming back to the technical below we can see that lately the stock is stuck within the upward sloping channel on the weekly chart since the bear market lows of 2023. If we plot the Fib retracement level from the all-time highs to the all-time lows, we can see that on the weekly chart it is stuck below the 0.236 Fib level with an oversold RSI. But the recent price action indicates that even if we touched the lower bound of the price we saw after April 4 Lib Day lows, we are still holding an RSI of 41 indicating seller exhaustion. So, the next levels in the chart are 52 $ then 67 $ and then 80 $ in the medium term, which is well within the parallel channel.
Verdict: NASDAQ:GTLB target prices are 52 $ then 67 $ and then 80 $. Can be held for long term returns.

AI Chip Stocks NVDA and AMD Showing 5 Wave RiseNASDAQ:NVDA and NASDAQ:AMD are both showing 5 wave rise in weekly chart after a correction in WXY. I haven't checked but other AI related stocks also might be doing something similar.
Once the 5 waves are over, we can expect some correction but the 5-wave rise post a correction typically signals fresh uptrend so it might be worth keeping an eye on these stocks. Waiting till retracement/correction of this rise is complete.

META Formed 1st 4H Golden Cross since Jan 2023!Meta Platforms (META) just completed yesterday its first 4H Golden in almost 2.5 years (since January 24 2023), flashing the strongest bullish signal it could at the moment!
Practically that Golden Cross was formed directly after the November 2022 bottom of the Inflation Crisis. The 4H RSI patterns between the two time periods are identical, so it is highly likely to see the market repeat that price action.
That suggests that the immediate Target on what seems to be an Inverse Head and Shoulders pattern is the 1.1 Fibonacci extension at $770.00, as META did on February 03 2023.
On the long-term and assuming a favorable macro environment (Trade Deals, Rate Cuts) it could reach the 1.786 Fibonacci extension a little over $1000, before the next major market correction.
-------------------------------------------------------------------------------
** Please LIKE 👍, FOLLOW ✅, SHARE 🙌 and COMMENT ✍ if you enjoy this idea! Also share your ideas and charts in the comments section below! This is best way to keep it relevant, support us, keep the content here free and allow the idea to reach as many people as possible. **
-------------------------------------------------------------------------------
💸💸💸💸💸💸
👇 👇 👇 👇 👇 👇
