New Setup: CLSCLS: I have a green setup signal(dot Indictor). It has an good risk-to-reward ratio(RR:). I'm looking to enter long near the close of the day if the stock can manage to CLOSE above the last candle highs(white line). If triggered, I will then place a stop-loss below(SL) and a price target above it(TP
Next report date
—
Report period
—
EPS estimate
—
Revenue estimate
—
3.19USD
249.09 MUSD
8.11 BUSD
116.09 M
About CELESTICA INC
Sector
Industry
CEO
Robert A. Mionis
Website
Headquarters
Toronto
Founded
1994
FIGI
BBG000BPS2C3
Celestica, Inc. engages in the provision of supply chain solutions globally to equipment manufacturers and service providers. It operates through the following segments: Advanced Technology Solutions (ATS), and Connectivity and Cloud Solutions (CCS). The Advanced Technology Solutions (ATS) segment includes aerospace and defense, industrial, smart energy, health tech, and capital equipment businesses. The Connectivity and Cloud Solutions (CCS) segment consists of enterprise communications, telecommunications, servers, and storage businesses. The company was founded in 1994 and is headquartered in Toronto, Canada.

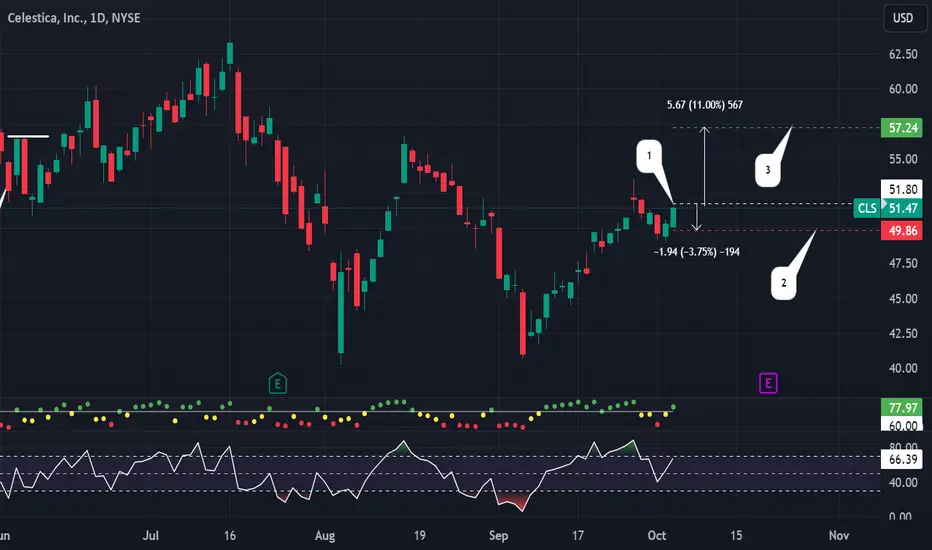
MY WATCHLIST: CLSCLS, an IBD50 stock now has a setup signal. Has an excellent risk-to-reward ratio. I'm looking to enter long near the close of the day if the stock can manage to CLOSE above the last candle highs(1). If triggered, I will then place a stop-loss below(2) and a price target above it(3).
CLS Holding at the 50 Fib Pivot Bullish CLS has shown rapid expansion and was well extended past a cup with handle formation and is now forming a base right at the 50 fib pivot level. We saw a pretty healthy retracement and now it is back on track to hit 60’s within the next few weeks. Strong fundamentals and earnings support the idea. Ec


CLS stock in upward trend Stock : CLS ( Celestica Inc )
Date : 27 Mar 2024
Main Trend : Up
preferred Transaction : Buy ( 45.50 $ )
Reasons : The stock is reversed from the support level ( upward trend line again ).
Technical Analysis success at level : 54 $
Technical Analysis fail at level : 39.50 $

🚀 Celestica ($CLS)🌐🔧 Tech Advancements Unveiled! 🔧🌐
🚀 Celestica ( NYSE:CLS ) introduces DS5000 800GbE switch, geared for data center and enterprise access demands. Positioned to thrive in the booming $2.37B digital transformation market (CAGR 18.6% by 2030).
💹 Strategic advantage in a falling Dollar attracts global

CLS is up 135.87% YTD and has lot of upside potentialIt broke through 20.36 which served as major trendline in the past.
Using Fibonacci, 50% lvl is sitting at 44.79 which serves as a critical level.
The supply zone is just above the 50%lvl so my estimate is that will hit the 50% lvl and enter the supply zone. What it does at that point, only time w

CLS: Bullish flag, Confirmed (51,12%)(33/1000)(33/1000)
Bullish Flag pattern for CLS. Confirmed
51,12% possible gains.
CLS is part of the S&P Technology sector which is currently showing an upward channel, reinforcing the bullish flag of CLS.
Pros:
1- PPS above 50MA and 200MA
2- RS above 0 and climbing
3- R/R ratio above 5
4- 250RSI above 5

CLS Working on macro recoveryCLS Providing epic retracement to .382 fib. confirmation would be needed to close on current 3m chart on the .236 fib level, failing to do so could prolong return.

$CLS July 31, 2023 Game Plan! NYSE:CLS - On Friday, July 28th, 2023, Celestica Inc's stock price rose by 15.05%, from $18.01 to $20.72, with fluctuations between $19.32 and $21.40.
The stock has risen in 8 of the last 10 days and is up by 30.81% over the past 2 weeks. Volume has increased along with the price, which is conside

See all ideas
An aggregate view of professional's ratings.
Displays a symbol's price movements over previous years to identify recurring trends.
Frequently Asked Questions
The current price of CLS is 68.40 USD — it has decreased by −3.35% in the past 24 hours. Watch Celestica, Inc. stock price performance more closely on the chart.
Depending on the exchange, the stock ticker may vary. For instance, on NYSE exchange Celestica, Inc. stocks are traded under the ticker CLS.
CLS stock has risen by 7.56% compared to the previous week, the month change is a 32.39% rise, over the last year Celestica, Inc. has showed a 191.56% increase.
We've gathered analysts' opinions on Celestica, Inc. future price: according to them, CLS price has a max estimate of 79.95 USD and a min estimate of 67.96 USD. Watch CLS chart and read a more detailed Celestica, Inc. stock forecast: see what analysts think of Celestica, Inc. and suggest that you do with its stocks.
CLS stock is 3.68% volatile and has beta coefficient of 2.27. Track Celestica, Inc. stock price on the chart and check out the list of the most volatile stocks — is Celestica, Inc. there?
Today Celestica, Inc. has the market capitalization of 8.11 B, it has increased by 2.79% over the last week.
Yes, you can track Celestica, Inc. financials in yearly and quarterly reports right on TradingView.
Celestica, Inc. is going to release the next earnings report on Jan 29, 2025. Keep track of upcoming events with our Earnings Calendar.
CLS earnings for the last quarter are 1.06 USD per share, whereas the estimation was 0.95 USD resulting in a 11.93% surprise. The estimated earnings for the next quarter are 1.03 USD per share. See more details about Celestica, Inc. earnings.
Celestica, Inc. revenue for the last quarter amounts to 2.56 B USD, despite the estimated figure of 2.46 B USD. In the next quarter, revenue is expected to reach 2.50 B USD.
CLS net income for the last quarter is 92.44 M USD, while the quarter before that showed 99.58 M USD of net income which accounts for −7.17% change. Track more Celestica, Inc. financial stats to get the full picture.
No, CLS doesn't pay any dividends to its shareholders. But don't worry, we've prepared a list of high-dividend stocks for you.
As of Oct 31, 2024, the company has 26.55 K employees. See our rating of the largest employees — is Celestica, Inc. on this list?
EBITDA measures a company's operating performance, its growth signifies an improvement in the efficiency of a company. Celestica, Inc. EBITDA is 724.11 M USD, and current EBITDA margin is 7.02%. See more stats in Celestica, Inc. financial statements.
Like other stocks, CLS shares are traded on stock exchanges, e.g. Nasdaq, Nyse, Euronext, and the easiest way to buy them is through an online stock broker. To do this, you need to open an account and follow a broker's procedures, then start trading. You can trade Celestica, Inc. stock right from TradingView charts — choose your broker and connect to your account.
Investing in stocks requires a comprehensive research: you should carefully study all the available data, e.g. company's financials, related news, and its technical analysis. So Celestica, Inc. technincal analysis shows the buy rating today, and its 1 week rating is buy. Since market conditions are prone to changes, it's worth looking a bit further into the future — according to the 1 month rating Celestica, Inc. stock shows the strong buy signal. See more of Celestica, Inc. technicals for a more comprehensive analysis.
If you're still not sure, try looking for inspiration in our curated watchlists.
If you're still not sure, try looking for inspiration in our curated watchlists.