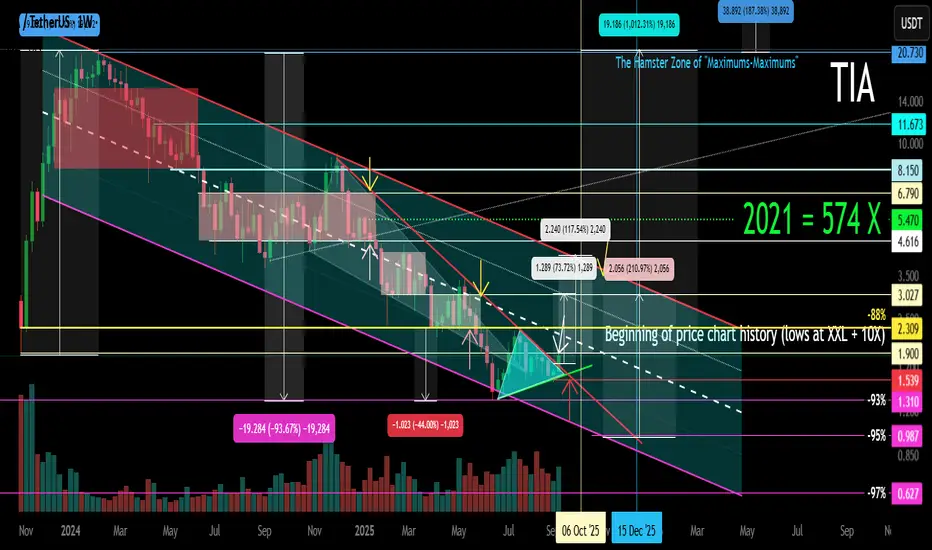
TIA (Celestia) XXL Main Trend Channel. Now +10X 13 09 25The price entered the 10X profit zone of crypto funds on 09 2025.
🟣 Locally , a symmetrical triangle formed under the downward trend.
🟢 Breakthrough — a trend break and movement to the resistance of the downward channel.
🔴Not a breakthrough — further immersion, after all, now the price is in the 10X zone , but already at least not 574 X ) When working with such hype, remember what a crazy profit the asset is at the "bottoms".
On the one hand, the asset will move with the market as a whole , and not by itself. In order to continue selling the hyped crypto wrapper, large market participants (swindlers and exchanges) will have to create hype again and redirect the traffic of "inexperienced" market participants. That is, make "dump waves ". You can use this, but with due regard to money management, and do not climb into margin and futures on such assets (inadequate profit on the other side). Work with local, down-to-earth goals (channel logic, in case of its breakthrough - the bowl), and not with maximum hypothetical ones.
ALT
WLD Main trend. Super pump +1118 and decline -95. 09 05 2025Logarithm. Main trend. Time frame 3 days.
Super pump +1118.42% and decline -95.16%.
Smart and stupid money. The legend of the project is quite interesting, it is quite possible that there will be attempts to implement it, but always in the first place in such projects is: "money from nothing". The chart confirms this. After the pump +1118.42%, a huge distribution zone, which formed the upper part of the pattern of one of the varieties of "head and shoulders" at an angle. Which makes it clear that the profit is huge. Even now, with a price decrease below the listing prices, from the peak of the pump by -95.16%, which is normal for assets of such liquidity, the profit of some "investors" is +25 X !! Think about what profit was when pumping +1118% (it is impossible to implement, the pump is done just for the chart, to raise the price, for "false goals" and hype, so that on rollbacks "cheap", in the distribution zone they were not afraid to buy on the conditional hype "whales bought". Although now it is unlikely that they will pour. In order to constantly sell at excess profit "at any prices", you need to make interest, both for traders and for investors, that is, volatility waves. They will pump under the market.
Local trend . Local impulse from the minimum prices. Locally, the price rested against the median, in case of its breakthrough - the implementation of the ascending pennant.

XTZ Secondary Trend. Channel. Wedge. Capitulation Zone. 07 05 20Logarithm. Time frame 1 week (less is not necessary).
The secondary trend has formed a horizontal channel for several years, with repeating wedge-shaped formations, the third time we entered under the support of this channel not by squeezes to collect long stop-loss, but by full candles and the structure of a descending wedge. It looks more vertical. The corrective movement to this semi-vertical wedge, quite possibly, will similarly have an aggressive character. The wedge is almost in the final phase of its formation. I showed percentages for clarity to the key reversal zones, for orientation for your money management and setting the first medium-term, and possibly local targets.
The main trend of this previously hyped cryptocurrency since 2017
XTZ/USD Main Trend. Descending Channel 01 2023

UNI - LONG SET-UP BINANCE:UNIUSDT
UNI Long Set-up 📈
Looking good to Long Between 7.9 - 8.4 🔼
SL Below 7.2 or as per your risk capacity 🔽

1INCH - LONG SET-UP BINANCE:1INCHUSDT
1INCH Long Set-up 📈
Looking good to long between 0.2130 - 0.2241 🔼
SL Below 0.20 or as per your risk capacity 🔽

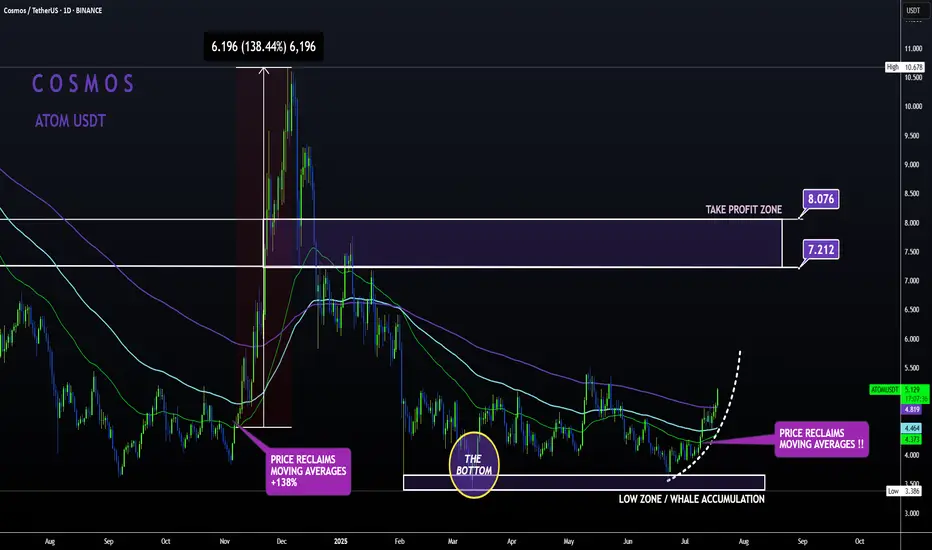
ATOM Sleeping GIANT ALT | Moving Averages BULLISH like NOV24'ATOM is slowly but surely making a turn up towards the first Take Profit point.
From the bottom, Cosmos has already increased a whopping 52% , with even more room to grow:
In my previous update, the 4 was still bearish when looking at trend lines and moving averages.
However, this has flipped to bullish from the 4h upward, with the price trading high above the moving averages in the 4h and in the daily timeframe:
4H:
Daily:
Note how previously, the big increases started as soon as the price regained the moving averages as support.
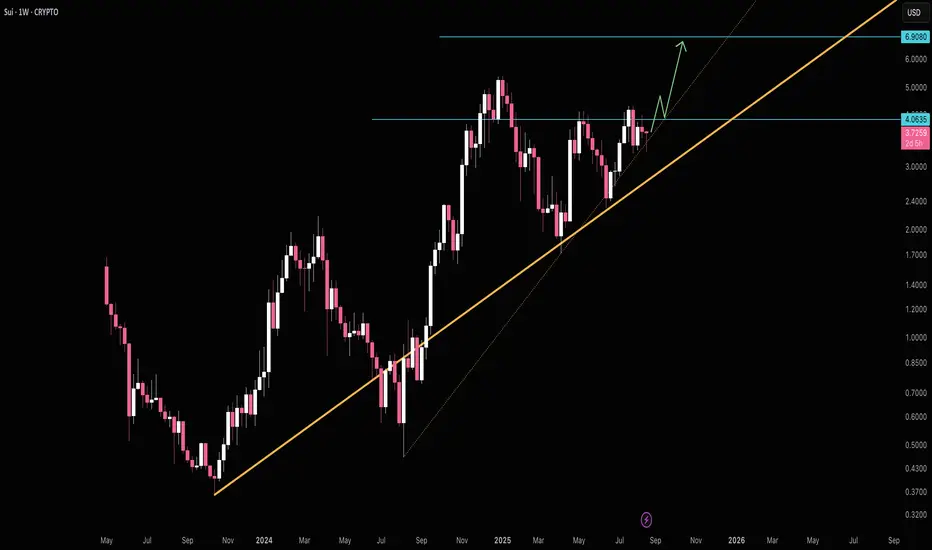
SUI Wave (4) Still Underway?Its unclear weather CRYPTOCAP:SUI wave 4 is complete or still underway as a larger triangle of flat correction, in a ending diagonal wave 4 (defined by wave 4 falling to wave 1 at the 0.5 Fib).
Price terminated 3 waves up at the High Volume Node resistance and is now finding support at the weekly pivot, 0.236 Fibonacci retracement. Further decline brings up the the 0.382 High Volume Node support.
Weekly RSI is at the EQ.
Safe trading

$ETH Did The Poke Above All Time High!As I said in my last update it would be unusual to complete the Elliot wave motif wave without a poke above all time high first and we got that this week adding confluence to an expected retracement ahead in wave 2. Poke above all time high shows long term strength.
Weekly RSI has bearish divergence from the wave 3 top in overbought territory.
Initial target is the (4) bottom and weekly pivot point at $3200 followed by $2800 High Volume Node and then the weekly 200EMA, S1 pivot and High Volume Node support at $2250. I will look out for longs in these areas.
Analysis is invalidated if proceed into price discovery.
Safe trading

BNB Retracement Ahead?CRYPTOCAP:BNB wave 5 looks complete at the weekly R1 pivot. RSI continues to print weekly bearish divergence from the wave 3 high.
Wave IV was a difficult count but appears to be a triangle which is a final pattern before the terminal move. Wave 2 retracement target usually ends at the bottom of wave 4 so $90 in this case which also finds confluence with 0.382 Fibonacci retracement and a swing below the weekly pivot, a good long signal.
Analysis is invalidated if we continue into price discovery.
Safe trading

CATI Memcoin. Main (essentially secondary) trend. Channel. 25 05Logarithm. Time frame 3 days (less is not necessary). Decline from the maximum -94%. As a rule, altcoins (ticker name, legend, imitation of usefulness does not matter) of such liquidity decline in their secondary trend until its reversal by -95-98%.
But, at the moment, there is a significant increase in volume, this is a good sign, if the price goes beyond the resistance of the descending channel, then a trend expanding triangle will form, or as it is also called the Livermore cylinder (dynamic zones of support / resistance of the "participation" phase).
In order not to miss the reversal, if you are afraid to gain a position now, then work with orders for a breakthrough, that is, a trend break.
🟣For 2 months now, a sideways trend with a 100% step, the price is being pulled to the resistance of the descending channel.
Breakthrough of it — trend reversal.
Not a breakthrough , decline to the next "shelf".
Everything is quite simple and logical. All levels and zones of potential minimums and maximums are shown. Remember, the average price of the set and reset is important. The key resistance zone after the reversal, where you will need to dump most of the position, or everything, is highlighted in gray.

Dogecoin (DOGE) Market Update & Catalysts: Ready for 50 cents?🚀 Dogecoin (DOGE) Market Update & Catalysts
🐋 Whale Accumulation & Trading Activity
Large players (“whales”) have been steadily absorbing DOGE, fueling upward momentum. Recent market structure shows that bulls defended the $0.22 zone, while primary support and reload range sits at $0.15–$0.16 — the bottom of the accumulation range. A breakout above $0.25 could spark a run toward $0.40, especially if short positions get squeezed.
🏦 ETF Prospects & Institutional Tailwinds
Optimism is building around a potential Dogecoin Spot ETF, with growing speculation that approval could arrive in the next cycle. An ETF would open the doors for institutional capital, mirroring what happened with Bitcoin’s rally.
🔗 Expanding Utility (DogeOS & DeFi)
The development of DogeOS, which allows DOGE to interact with Ethereum DeFi ecosystems, could give the coin a major utility boost beyond its meme status. This evolution may help sustain higher valuations long-term.
📈 Technical Signals & Price Forecasts
Chart patterns are turning favorable:
Golden cross (50-day MA crossing the 200-day) shows momentum strength.
Oversold RSI signals suggest a potential reversal upward.
If support at $0.15–$0.16 holds and bulls reclaim $0.25, upside targets expand to $0.34–$0.40.
🔮 Bullish Scenarios & Analyst Sentiment
Mid-term projections highlight possible price zones:
Conservative path: $0.30–$0.33 into 2025.
Aggressive path: Retesting all-time highs near $1 if institutional demand + ETF + DeFi traction align.
🌟 Key Positive Catalysts
🔑 Catalyst 🚀 Impact
🐋 Whale absorption & accumulation Strengthens base; short squeezes possible.
🏦 Spot ETF approval potential Brings institutional demand.
📊 Technical bullish patterns Golden cross + RSI suggest uptrend.
🔗 DogeOS & DeFi integration Expands DOGE’s real-world use cases.
💬 Strong community + hype Keeps DOGE in the spotlight.
✅ Summary
Dogecoin is holding its accumulation base at $0.15–$0.16, with strong whale support and growing catalysts like ETFs and DeFi integration. If bulls can reclaim the $0.25–$0.26 zone, momentum could build toward $0.40 in the mid-term — with long-term upside scenarios eyeing $1+ if institutional and utility drivers align.

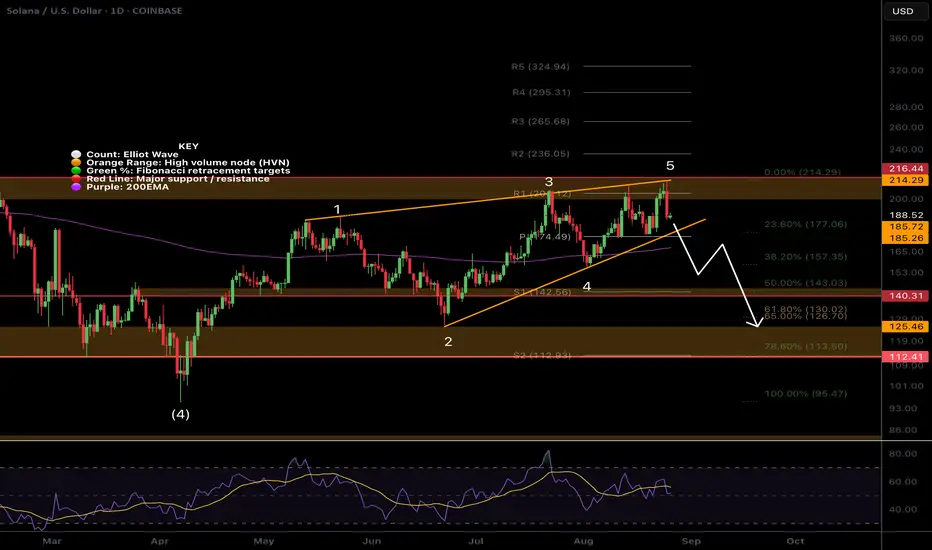
SOL Elliot Wave Count ChangedCRYPTOCAP:SOL Solana appears to have completed an Elliot wave diagonal pattern with a series of ABCs.
Falling below the trend line and 200EMA would confirm this and bring up a first target of $140 at the High Volume Node and 0.5 Fibonacci retracement.
Daily RSI has had bearish divergence for a while. The 'alt-coin golden pocket' 0.786 sits at the wave 2 bottom around $119 which would be a buy for me if price gets down that far.
Safe trading.
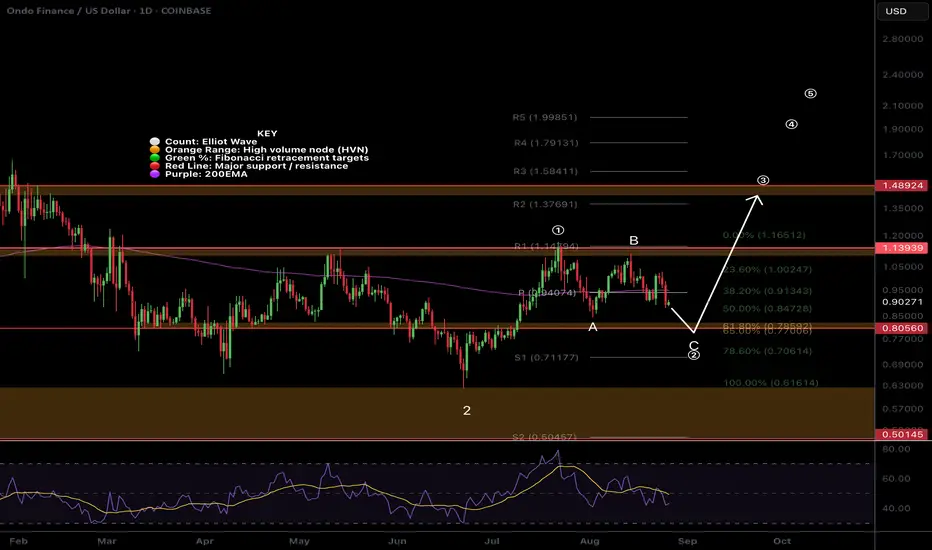
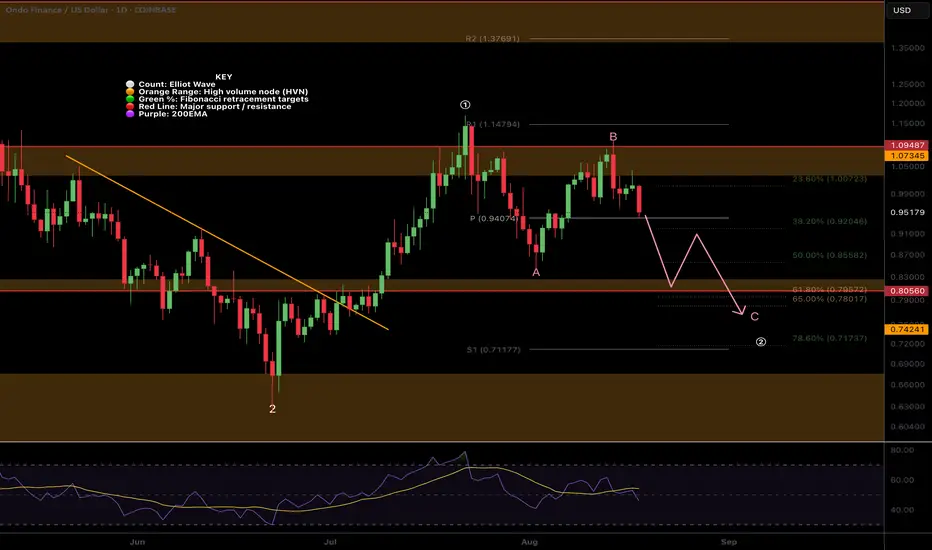
ONDO Wave C of 2 underway?LSE:ONDO appears to be printing wave C of 2 with a target of the High Volume Node and Fibonacci retracement golden pocket.
RSI has room to fall into oversold, price has lost the daily pivot and 200EMA.
Wave (3) has an initial target of $1.48
Safe trading
FET Wave 2 Underway, Triangle InvalidatedWave C of 2 appears to be underway for $FET. With the 1:1 extension target from wave A lines up with the golden pocket retracement and S2 daily pivot so is definitely an area to watch.
RSI has room to fall into oversold.
Price failed 2 tests of the descending daily 200EMA, we expect price to break through on the 4th.
Safe trading

AAVE Ending Diagonal?We have some more clarity with the local AAVE pattern and it does appear to be an Elliot wave ending diagonal. After a strong wave 3 ending diagonals form as a terminal pattern with a thrust above the trend line threshold and drop back down to complete a higher degree motif wave 1.
The following retracement has a high probability of terminating at the wave 4 bottom which in this case is at the High Volume Node support and 0.5 Fibonacci retracement at $210.
RSI has printed a series of bearish divergence from overbought but this took a long time to play out!
Analysis is invalidated if price breaks above $400.
Safe trading

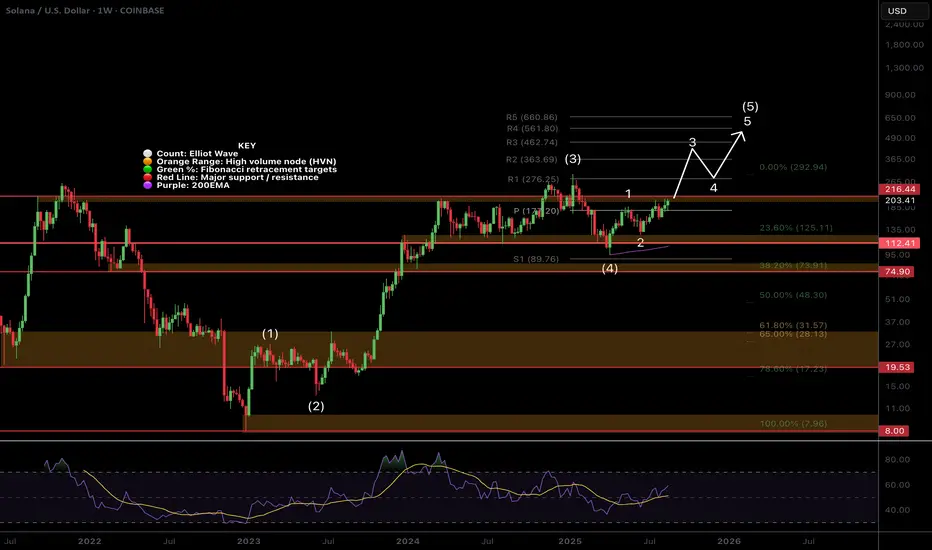
$SOL Ready for Price Discovery?CRYPTOCAP:SOL wave 3 of (5) appears to be underway but has to get through the major resistance High Volume Node at $216 and previous high first for an impulsive move.
Weekly pivot point was tested successfully as support and RSI has plenty of room to continue upwards.
Analysis is invalidated below $130.
Safe trading
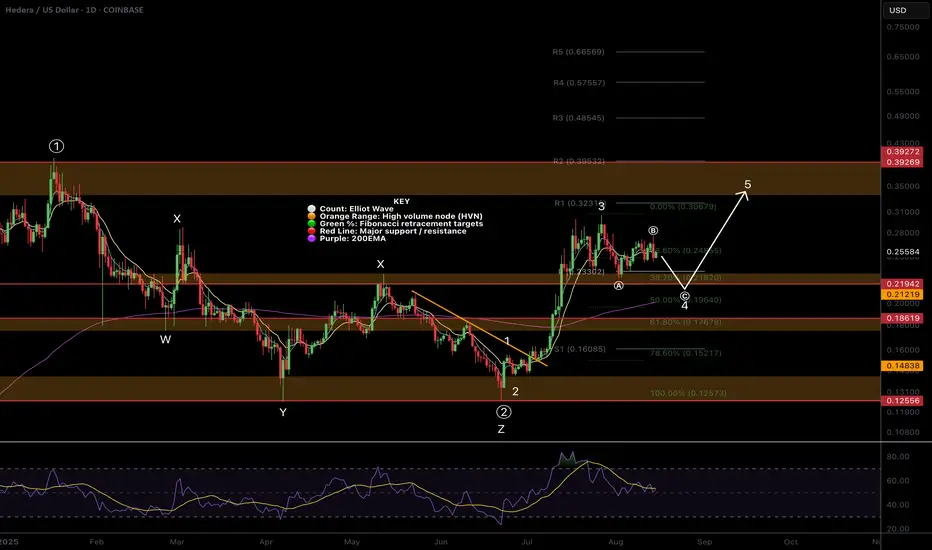
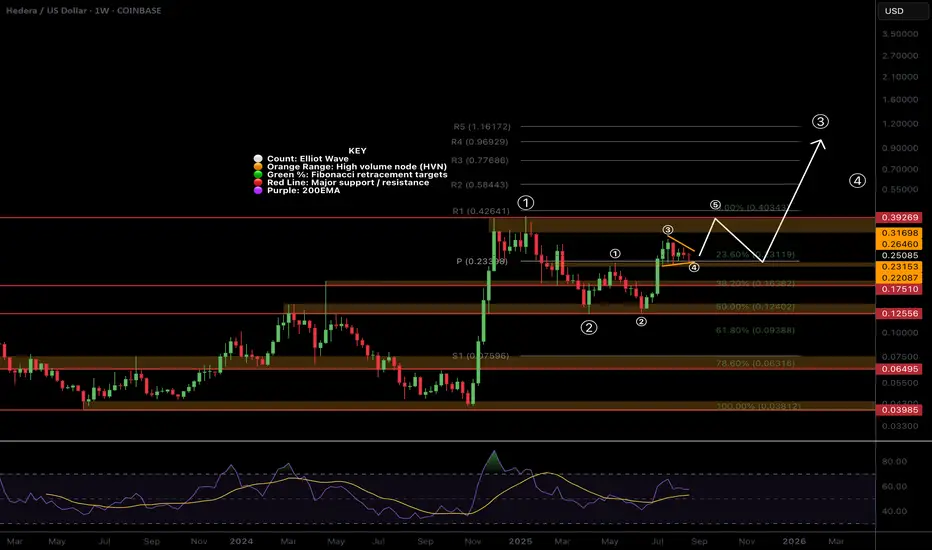
$HBAR Macro Chart - Ready for wave 5 of (1) of 3 up?CRYPTOCAP:HBAR appears to be printing a wave 4 triangle above the weekly pivot point. This implies the next move would be a terminal wave (5) of 1 of (3) likely completing with a poke above all time high to trap FOMO novice investor / traders. Classic Elliot Wave.
Wave 2 of (3) has a high probability of ending at the wave 4 triangle base which is the weekly pivot and 0.236 Fibonacci retracement adding confluence. This fib level support would indicating continued trend strength.
If it is a wave 1 of (3) is completing then we can expect the long term target to overextend the weekly R5 pivot point of $1.16, possibly reaching $3.
Weekly RSI remains at the EQ so plenty of room to grow.
Analysis is invalidated below the weekly pivot.
Safe trading
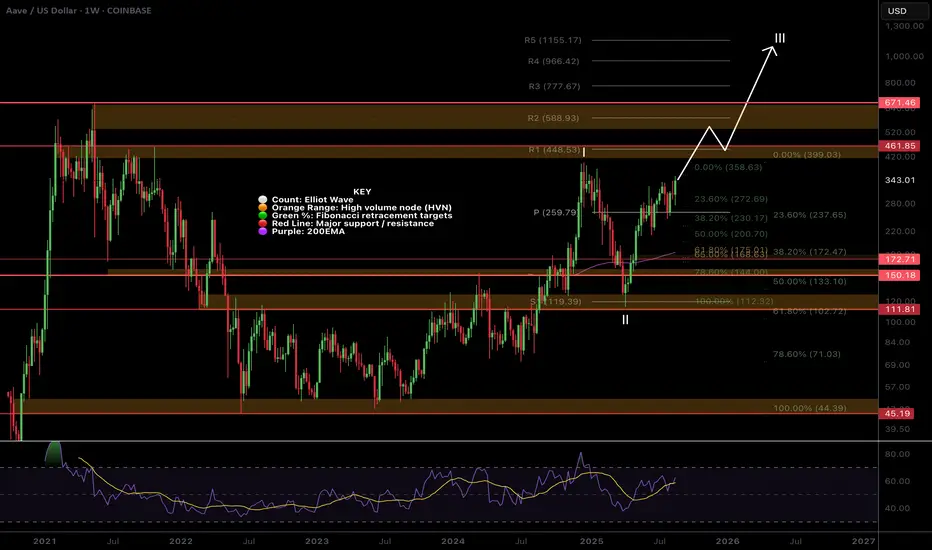
$AAVE Set for all time high?AAVE tested the weekly pivot as support and after a secondary pullback to the 0.236 Fibonacci retracement, sky rocketed alongside BTC and crypto yesterday to a new local high.
Wave III looks truly underway with this kind of price action and the target remains the R5 weekly pivot at $1155. High Volume Node resistance at $460 and $670 are the next targets.
Weekly RSI has plenty of room to grow to get to overbought.
Analysis is invalidated below $111 so plenty of room to breathe!
Safe trading
SUI to $6.9SUI's riding the uptrend up to breaking $4 resistance. $6.90 is next major resistance.
Good luck!
$ONDO ABC Correction in Wave 2?LSE:ONDO wave (c) of 2 appears to be underway after the failure to reach a new local high. However there is strong support just below of the daily pivot and 200EMA.
Failure to hold this level brings up the High Volume Node support and golden pocket at $0.79. RSI has room to fall and the alt-coin golden pocket, Fibonacci 0.786 sits at the S1 daily pivot.
Analysis is invalidated above wave B.
Safe trading
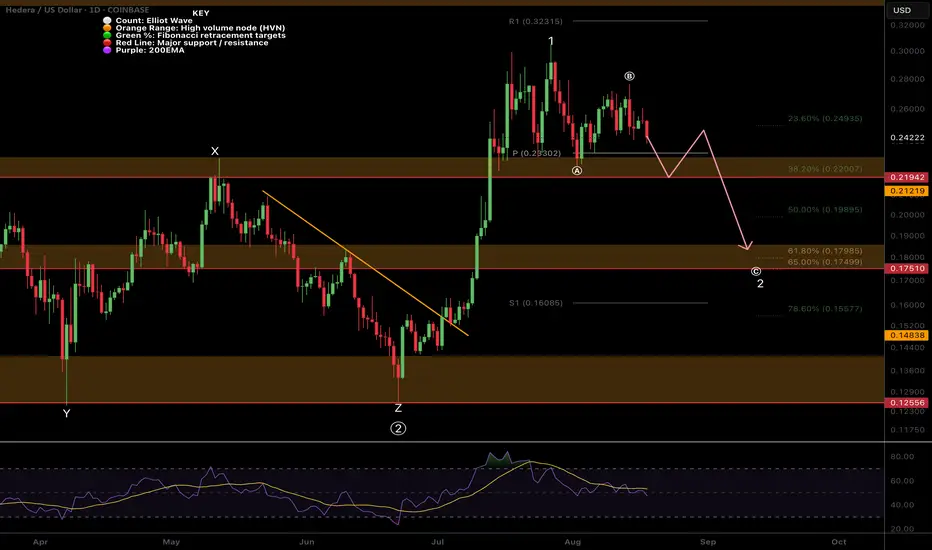
A Local look at the $HBAR retracementWave (c) appears to be underway with a target of the golden pocket and major support High Volume Node at $0.175.
There may resistance at the daily 200EMA along the way but it just seems to floating between supply and demand zones right now.
Daily RSI has room to fall.
Safe trading
$ETH Topping Without All Time High?Has the most anticipated all time high of the year been cancelled? The crowd does not get what it wants! Everyone from CNBC to my grandmas goldfish have been bullish on ETH for the past few months so what a fitting psychological mess it would be if we significantly pulled back here!
Firstly it may just be a temporary set back to the High Volume Node support at $3900 before a move to all time high. Even then I am expecting a deeper pullback to set us up for all time high in Q4. Losing this support bring up the ascending daily 200EMA right at the Fibonacci golden pocket, which you can see is the wave 3 high!
The next target, which is my next buy level, is the larger degree Fibonacci golden pocket, major support High Volume Node and wave 4 bottom at $2100. This would be a capitulation area for many!
RSI has printed confirmed bearish divergence with plenty of room to fall.
Safe trading

$HBAR Printing an ABC in wave 4?Wave C of an ABC correction in wave 4 appears to be underway in CRYPTOCAP:HBAR
This would see price have a quick drop below the daily pivot testing the major support High Volume Node and rising daily 200EMA as support before continuing up in wave 5. This is also the .382-.5 Fibonacci retracement a typical area for wave 4 to end per Elliot wave rules. Lots of confluence in this area.
RSI is still making its way down from overbought. Investor psychology is still irrationally bullish giving opportunity for professional traders to make some volatility bucks.
Analysis is invalidated if price breaks $0.273 upgrading the count to wave 4 completing at the current wave (a) bottom.
Safe trading