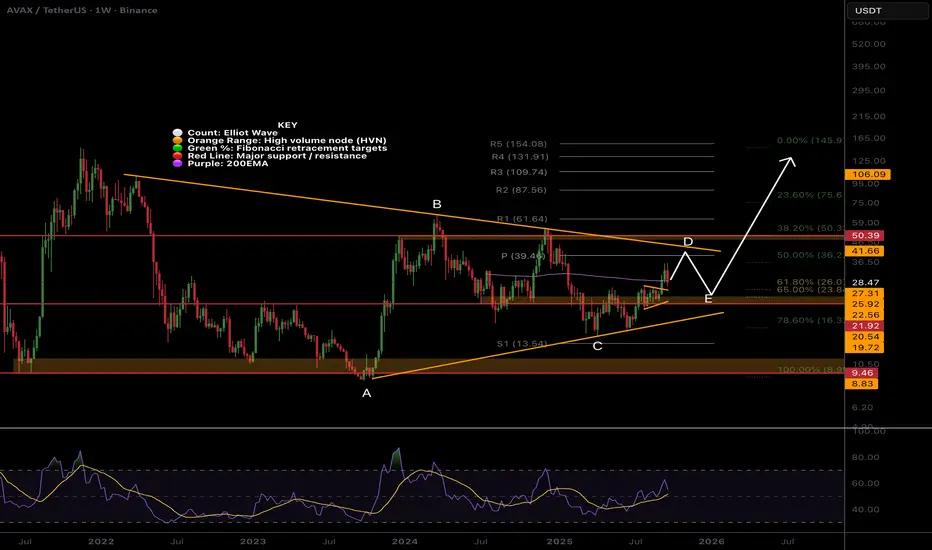
AVAX Macro Triangle?CRYPTOCAP:AVAX is printing a macro triangle similar to CRYPTOCAP:XRP did before it moved x10 in late 2024. The series of ABCs and Fibonacci depths gives this away.
Wave D could be complete but has not reached the resistance line and weekly pivot so I may have one more push up to go.
Wave E is expected to end at the weekly 200EMA to the High Volume Node as it doesn't test the support diagonal line by its characteristics.
This would also have triangle correction complete at the golden pocket adding confluence to the area.
Triangle pattern target is high and we could see a move to the R5 weekly pivot at $150 to test the all time high one more time.
Weekly RSI has bullish divergence from wave C.
Safe trading
Altcoin
XRP Still consolidating below all time highCRYPTOCAP:XRP continues to consolidate below all time high with no significant drop yet on the macro.
I expect this drop to come to complete wave 2 but with a shallow correction to the weekly pivot at $1.7 between the 0.236 and 0.382 Fibonacci retracement.
My previous analysis still stands about this being a terminal move due to the macro triangle (an Elliot wave pattern that comes before a final thrust) that would see price long term returning to the triangle bottom during a prolonged bear market $0.3-0.5.
For now the trend is up! Have an exit plan! I will be looking for long a those key levels.
Safe trading

HBAR Bull Pennant or deeper correction?HBAR wave (2) appears to be completed at $0.122 the 0.5 Fibonacci retracement and High Volume Node support.
However, price does appear to have completed an ABC corrective wave up keeping the the wave (2) alive with a target of the S1 pivot, 'alt-coin golden pocket' 78.6 Fib retracement and High Volume Node support. The high probability terminal target area if we continue lower.
Bulls want to see the local downside action complete as a bull pennant and continue to the upside negating the ABC corrective wave.
Currently price is a below the weekly pivot, RSI is crossed bearishly at the EQ.
Upside targets remain $0.77 - $1.16 at the R3-R5 weekly pivots.
Safe trading

FET Macro Outlook, Why Hasn't it moved?NYSE:FET macro still appears to be in an expanding megaphone pattern with an expected terminal target of the R2 pivot at $4.73 almost a 10x from here.
After being one of the best performers late 2024 FET drew a lot of attention and trapped a lot of new investors and traders. This attracts whales, who pray on the assets sentiment and hope. They apply continued downside pressure every time it pumps as new traders will get excited about that big profits happening again and this wont stop until everyone capitulates and leaves the asset.
Wave 2 of V appears to be underway with a target of the ascending orange support line.
Analysis is invalidated if we drop below wave IV and head to the High Volume Node support at $0.3 keeping wave IV alive but highly likely terminating there and starting a new uptrend with power.
Price is below the weekly 200EMA and weekly RSI is in bottoming zone but and may print bullish divergence.
I plan to execute longs at the key areas to capture at least a bounce profit if not the bottom.
Safe trading

ETH Macro Picture, Pullback then $10k?CRYPTOCAP:ETH had a massive rally from the wave (II) bottom with a poke above all time high followed by extremely greedy sentiment on social and mainstream media of which I was warning should mark a local top and trap new investors.
Price has now pulled back to the first High Volume Node support target. I am expectinga deeper pullback over the next few weeks to complete wave (2) with an initial terminal target of the weekly pivot $3179 which is also the 0.382 Fibonacci retracement. That would be shallow for wave 2 which is expected in a wave III. However, the 0.5 Fibonacci retracement sits at the next major High Volume Node support where it is expected to meet the weekly 200EMA adding a lot of confluence to this are as the next bottom, $2660.
Any further downside bring up the S1 weekly pivot, golden pocket and high volume node, $2250.
There is weekly bearish divergence from the early 2024 highs.
I will play this trading plan point by point and look for longs at key levels to at least secure some bounce profits if not find a bottom.
Safe trading

BNB Swing Long Idea - TTKZ Model📊 Market Sentiment
FED has resumed its rate-cutting cycle, starting with a 0.25% cut in September, with two more 0.25% cuts expected in the coming months. Additionally, institutional liquidity inflows have accelerated as the U.S. officially adopts crypto as part of its reserves. While inflation remains elevated, the weakening labor market is forcing the FED to ease, driving more capital into risk-on assets.
📈 Technical Analysis
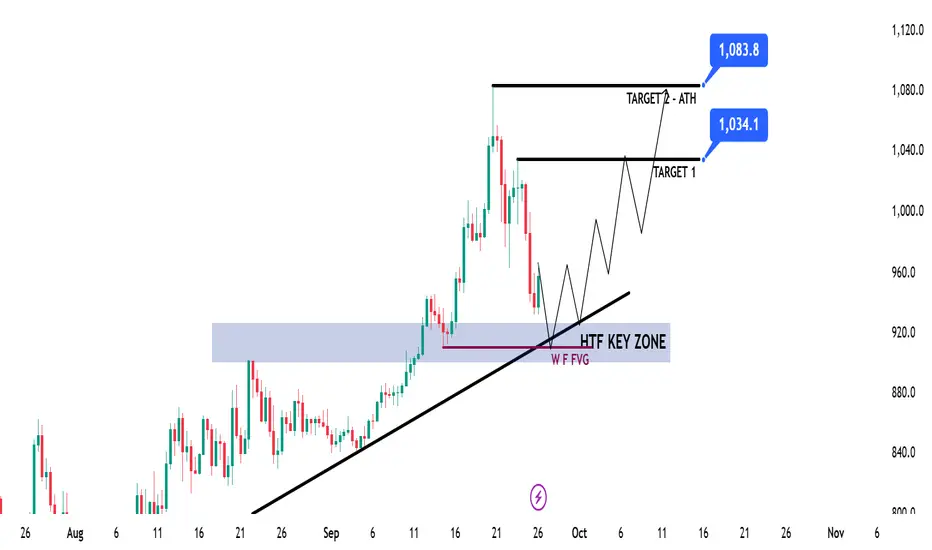
Price is making new all-time highs continuously. The HTF Weekly–Daily structure remains bullish, so my bias is only long.
Currently, price is retracing toward the HTF bullish trendline and a HTF Key Zone, both of which I assume are strong levels for a potential bounce and continuation higher.
📘 Model to be used – Trendline Test w HTF Key Zone (TTKZ)
In this model, I look for a clear HTF trendline that continuously supports price. When price comes back to test that line, I check if there’s also a HTF Key Zone aligned for confluence. Strong overlapping zones create higher probability bounce areas for long setups.
📌 Game Plan
1-Wait for a test of the HTF trendline
2-Confirm test of the HTF Key Zone
🎯 Setup Trigger
I will be waiting for a 4H break of structure before entering the trade.
📋 Trade Management
Stoploss: Below the 4H swing low that creates the break of structure
Targets: TP1: 1034$ | TP2: 1083$
Once TP1 is reached, stoploss will be moved to breakeven.
💬 Like, follow, and comment if this breakdown supports your trading! More setups and market insights coming soon — stay connected!
⚠️ Disclaimer: This content is for informational and educational purposes only and does not constitute financial, investment, or trading advice. Always DYOR before making any financial decisions.
WOD Market Update📊 WOD Market Update
WOD is in a downtrend 📉
What’s next? If you want to enter or accumulate more, ⚠️ don’t enter now.
We have 2 key zone levels — if the price drops to these zones, there’s a possibility to enter long with confirmation ✅
Always trade smart, not blind — or you will lose money.

God Candle on SQD Entering Its Next Era
After a massive breakout from sub-$0.10 levels, $SQD has rallied over 100% in 24h, fueled by growing adoption news and upcoming staking/rewards utility.
Chart Setup
Strong parabolic move with volume confirming trend.
Local top printed around $0.28 before sharp rejection → healthy cooling phase now around $0.20 support zone.
Key support: $0.20 psychological + breakout retest.
Resistance: $0.25–$0.28 range (previous rejection zone).
Scenarios
Holding above $0.20 could set up a higher low → continuation toward $0.30+.
Failure to hold $0.20 may trigger a deeper retrace into $0.16–$0.18 accumulation zone before the next leg.
Narrative Catalyst
SubSquid isn’t just hype – it’s solving blockchain data infra across Solana, Ethereum, Polkadot & more. With 100M+ daily API calls, 70+ projects, and staking about to go live, token demand could accelerate alongside ecosystem adoption.
📌 Outlook
Near term → consolidation after vertical run.
Mid term → continuation likely as adoption narrative + staking kick in.
Long term → if SubSquid becomes the “AWS of Web3 data,” today’s moves may just be the beginning.

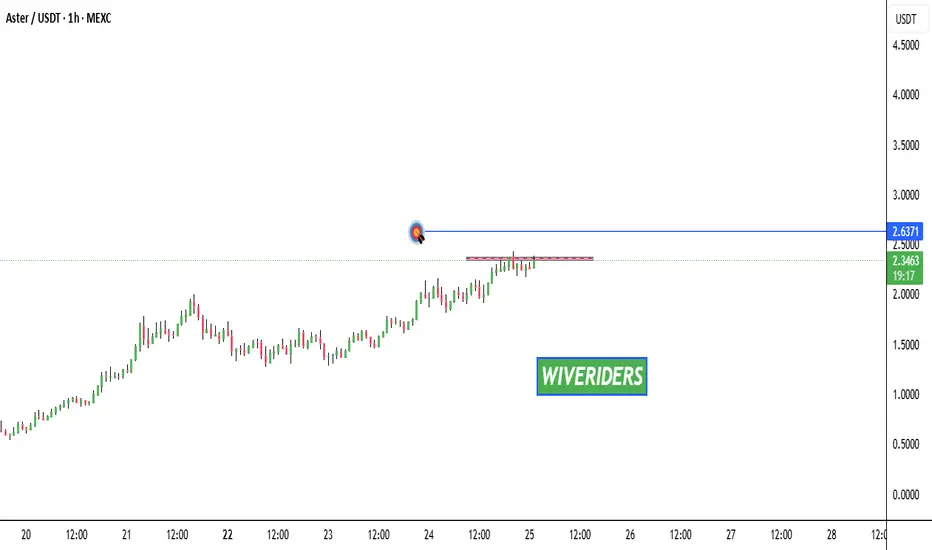
ASTER Market Update📊 ASTER Market Update
ASTER is testing the red resistance zone 🔴
If it breaks out with confirmation, the first target will be the blue line level 🎯

Bitcoin dominance VS. Altcoins run phaseBTC dominance has broken below its major uptrend, and we may see very positive movements in altcoins in the coming period.

POL - Confluence at Demand: Longs on the Trendline?POL BINANCE:POLUSDT has been overall bullish on the daily, moving inside a rising channel. Price is sliding toward the demand zone at $0.19–$0.21, right where the channel’s lower trendline comes in, clean confluence for dip buyers.
This zone is key 🔑. If bulls defend it, I’ll look for a rotation toward $0.25, then $0.29–$0.31 near the channel mid/upper bounds 🚀.
If $0.19 fails on a daily close, I’ll step aside and reassess lower before looking for fresh confirmation.
What’s your move => bid the confluence at $0.19–$0.21, or wait for strength back above $0.25 first? 🤔
⚠️ Disclaimer: This is not financial advice. Always do your own research and manage risk properly.
📚 Stick to your trading plan regarding entries, risk, and management.
Good luck! 🍀
All Strategies Are Good; If Managed Properly!
~Richard Nasr

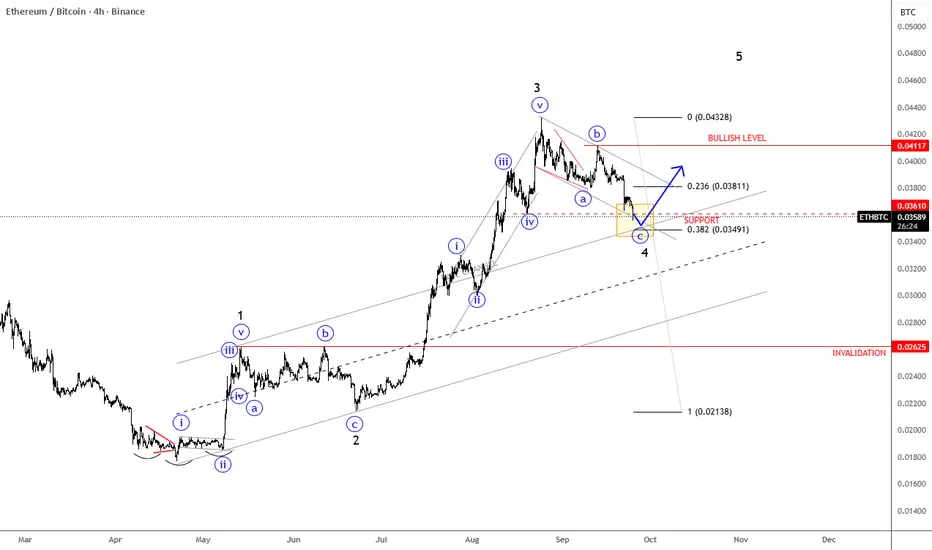
ETHBTC Has A TextBook Bullish PatternETHBTC Has A TextBook Bullish Pattern, as we see an ongoing five-wave bullish impulse by Elliott Wave model
ETHBTC pair is slowed down after a massive extension higher into wave 3, and it's right now testing important 0.035 - 0.034 support zone within an abc correction for wave 4. It's also trading at an important 38,2% Fibonacci retracement and base channel upper line, which can act as a strong support. So soon watch out for a bullish continuation within wave 5, especially if we see a rebound and recovery back above channel resistance line near 0.038 level. Bullish confirmation is above 0.041 level, while the invalidation level is at 0.026.
Don’t Underestimate Dogecoin!Dogecoin is one of my favorite setups. I’m loving this market cycle — it looks exactly like Bitcoin before 2017 happened. I believe it’s setting up for a huge parabolic run that could make people very rich. I’m extremely excited about this setup.
As always, stay profitable.
— Dalin Anderson

QNT Market Update📊 GETTEX:QNT Market Update
GETTEX:QNT is testing the red resistance zone 🔴
If it breaks out with confirmation, the first target will be the green line level 🎯

MNT Market Update📊 TSX:MNT Market Update
TSX:MNT is testing the blue support level 🔵
If it breaks out to the downside with confirmation, there’s potential for a short setup with the target at the green line level 🎯📉

ASTER is testing the red resistance zone📊 $ASTER Market Update
$ASTER is testing the red resistance zone 🔴
If it breaks out with confirmation, the first target will be the green line level 🎯
Can Pi Network(PI) Bounce +15% From PRZ?In recent days, Pi Network ( OKX:PIUSDT ) has dropped more than -40% , raising the big question: Is Pi still a project we can rely on, or is momentum fading away?
Main Reasons Behind the Drop:
1-Mass token unlocks in September → Huge increase in supply created heavy selling pressure.
2-Rising exchange reserves → More than 420M now sitting on CEX wallets, a sign of potential sell waves.
3-Fast-track KYC & protocol upgrades → Gave many users access to their tokens, fueling more selling activity.
4-Low liquidity + whale sell-offs → A few large orders accelerated the decline.
The Pi community remains strong, but current supply shocks are outweighing demand. Until the project reaches full exchange listings and sustainable utility, traders should stay cautious and manage risk carefully.
---------------------------------------------------------------
Now let’s take a look at the PI Token chart on the 15-minute time frame .
The PI Token has formed a descending channel over the past day.
From the perspective of Elliott Wave theory , it looks like PI Token is completing a Double Three Correction(WXY) in the descending channel .
I expect PI Token to start rising as it enters or touches the Potential Reversal Zone(PRZ) again and rise to $0.289(+15%) . In general, a break of the upper line of the descending channel is a good sign for the PI token to rise .
Please respect each other's ideas and express them politely if you agree or disagree.
Pi Network Analysis (PIUSDT), 15-minute time frame.
Be sure to follow the updated ideas.
Do not forget to put a Stop loss for your positions (For every position you want to open).
Please follow your strategy and updates; this is just my Idea, and I will gladly see your ideas in this post.
Please do not forget the ✅' like '✅ button 🙏😊 & Share it with your friends; thanks, and Trade safe.

SHIB Swing Long Idea - MemecoinSHIB Swing Long Idea
📊 Market Sentiment
Market sentiment remains strongly bullish as the FED is expected to deliver a 0.25% rate cut, with speculation building for a possible 0.5% cut in September. Monetary policy shifts are being driven by both inflation trends and weakening labor market data. The latest August and September job reports were soft, signaling that the economy is cooling rapidly. This environment continues to fuel expectations for a major bullish run in the weeks ahead.
📈 Technical Analysis
Price ran the HTF liquidity and got rejection from there.
Price created the Daily Demand after the run which confirms the price wants to seek higher liquidity.
Price made its first retest to Daily Demand and got rejection there, indicating that Daily Demand is valid and likely to send price higher.
Price is also supported by the Weekly Demand zone.
📌 Game Plan
1. Price to come back and retest the Weekly Demand zone at 0.0125$
2. Price to come back and retest the Daily Demand zone at 0.0117$
3. Price to run Equal Lows (purple line – 0.0117$) and close back above
4. Price to hit the 0.75 most discounted range level
🎯 Setup Trigger
I will be looking for a 4H break of structure before entering any position.
📋 Trade Management
Stoploss: Below the 4H swing low responsible for BOS
Targets:
• TP1: 0.0149$
• TP2: 0.016$
• TP3: 0.0175$
💬 Like, follow, and comment if you find this setup valuable!
⚠️ Disclaimer: This content is for informational and educational purposes only and does not constitute financial, investment, or trading advice. Always do your own research before making any financial decisions.

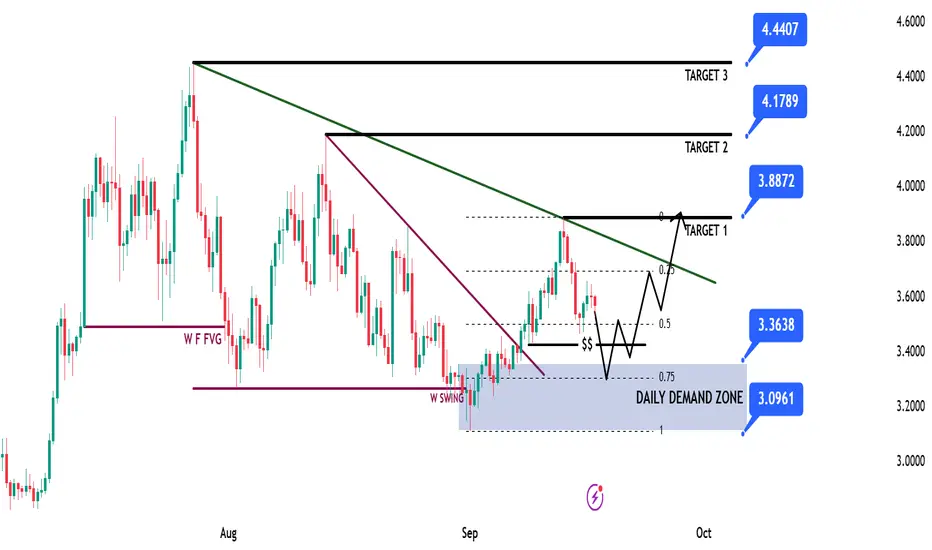
SUI Game Plan - Suinetwork📊 Market Sentiment
Market sentiment remains strongly bullish as the FED is expected to deliver a 0.25% rate cut, with speculation building for a possible 0.5% cut in September. Monetary policy shifts are being driven by both inflation trends and weakening labor market data. The latest August and September job reports were soft, signaling that the economy is cooling rapidly. This environment continues to fuel expectations for a major bullish run in the weeks ahead.
📈 Technical Analysis
Price is on HTF bullish trend so we will be looking only long setups.
Price ran HTF liquidity and closed above then broke the market on daily-weekly timeframe, creating the Daily Demand Zone.
Moreover, price broke the bearish trendline and closed above, giving strong upward momentum. Now price is retracing back into the Daily Demand Zone.
📌 Game Plan
1-Price to hit back to Daily Demand Zone
2-Price to hit possibly 0.75 max discount range zone. If not, I’ll still enter with LTF confirmation.
🎯 Setup Trigger
4H break of structure after hitting 3.36$ level. I won’t enter unless I see the 4H BOS.
📋 Trade Management
Stoploss: Below 4H swing low responsible for BOS
Targets:
TP1: 3.88$
TP2: 4.17$
TP3: 4.44$
💬 Like, follow, and comment if you find this setup valuable!
⚠️ Disclaimer: This content is for informational and educational purposes only and does not constitute financial, investment, or trading advice. Always DYOR before making any financial decisions.
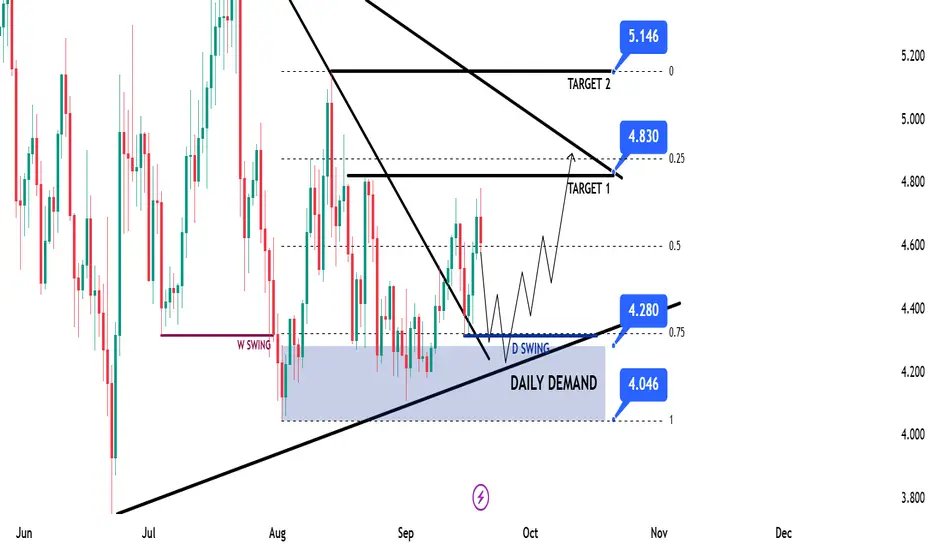
APT Swing Long IdeaAPT Swing Long Idea
📊 Market Sentiment
FED has resumed its rate-cutting cycle, starting with a 0.25% cut in September, with two more 0.25% cuts expected in the coming months. Additionally, institutional liquidity inflows have accelerated as the U.S. officially adopts crypto as part of its reserves. While inflation remains elevated, the weakening labor market is forcing the FED to ease, driving more capital into risk-on assets.
📈 Technical Analysis
Price ran HTF liquidity and got rejected, creating a strong Daily Demand Zone.
This zone is further supported by the HTF bullish trendline, so I will only look for longs as long as the HTF bullish structure holds.
📌 Game Plan
1-Price to revisit and reprice the Daily Demand Zone at $4.28
2-Price to run and close above $4.30 daily swing liquidity (engineered liquidity for expansion higher)
3-Price to reprice into the 0.75 max discount of the range
4-Possible retest of the HTF bullish trendline
🎯 Setup Trigger
I’ll be looking for a 12H break of structure before entering long.
📋 Trade Management
Stoploss: 12H swing low that breaks the market
Targets:
• TP1: $4.83
• TP2: $5.14
💬 Like, follow, and comment if you find this setup valuable!
⚠️ Disclaimer: This content is for informational and educational purposes only and does not constitute financial, investment, or trading advice. Always DYOR before making any financial decisions.
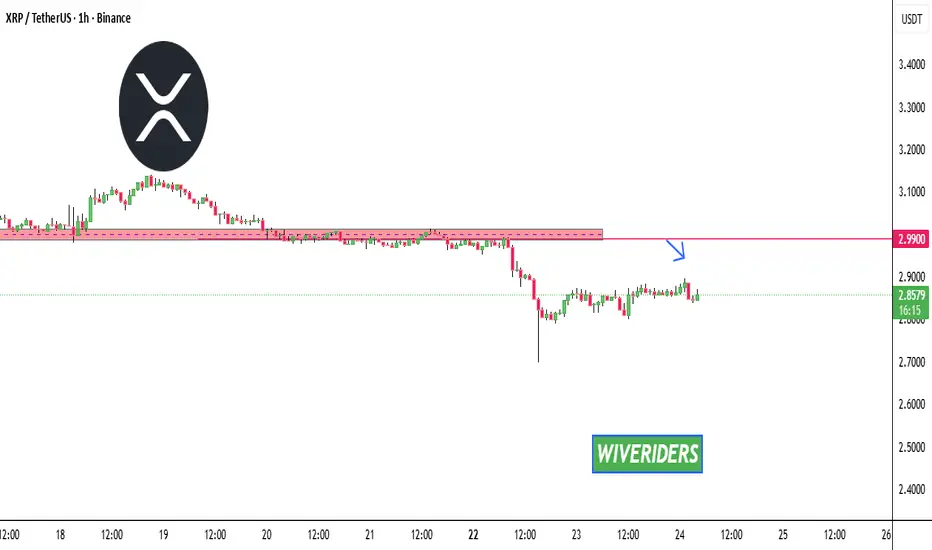
XRP Market Update📊 CRYPTOCAP:XRP Market Update
If CRYPTOCAP:XRP reaches the red resistance zone 🔴, wait for confirmation before entering a short position ⚠️
This is the level where sellers are still active and could push the price down again 📉
ZEC Market Update📊 SEED_DONKEYDAN_MARKET_CAP:ZEC Market Update
SEED_DONKEYDAN_MARKET_CAP:ZEC has successfully broken out of the red resistance zone 🔴✅
It is now approaching the first target at the blue line level 🎯

SUILocal Analysis / Targets / Elliot Wave
Sui attempted to breakout into all time high and was rejected as expected for a wave (1). Wave (2) is underway with an expected first target of the High Volume Node and S1 daily pivot at $2.9, also the 0.382 Fibonacci retracement. Price must get through the daily 200EMA first. Secondary targets is the golden pocket and High Volume Node support at $2.3.
RSI is just below the EQ and crossed bearishly.
Standard Deviation Band Analysis
Price is below the fair value regression line and another thrust lower will see it reach the green opportunity buy zone where it has tested the threshold twice a support. Price was rejected twice when also attempting to breakout above fair value showing supply ready to drop.
Safe trading
