SANDBOX: Since Strong Bullish Bounce This Formation is Decisive!Hello Community,
welcome to my new analysis about SANDBOX. In recent times, this crypto has formed a substantial bullish bounce on the local. Now I have spotted the huge formation it is forming, which could have a massive impact in the upcoming times. Therefore, I have identified all the important underlying factors necessary to consider right now.
When looking at my chart, we can see how SANDBOX is forming this gigantic descending triangle formation. Within this formation, it has already com
Altcoinmarket
LISK: Massive Descending-Wedge, Breakout Incoming!Hello Community,
welcome to my new analysis of LISK on the global timeframe perspective. In the recent times, I have spotted interesting altcoin setups that have the potential to turn into profitable trading opportunities on the long side in the next times. With one of them being LISK, I detected all of the major factors to consider now.
When looking at my chart, we can see how LISK is forming this gigantic descending wedge formation. Such a descending wedge formation is, in most cases, a for
COIN: The Stock Surges and Builds a Bullish Formation.Hello Community,
welcome to my new analysis of COIN on the 4-hour timeframe perspective. As the cryptocurrency market bounced bullishly to the upside, there are also interesting crypto stock candidates that bounced and show further worthwhile signs. I have identified all the important factors regarding this bullish setup with COIN.
When looking at my chart, we can see how COIN recently bounced to the upside from the ascending support line. It also managed to use the EMAs as support and now pe
ARB: 100% Upward Surge Wedge Setup, Next Uptrend!Hello Community,
welcome to my new analysis about ARB. This coin has surged massively to the upside and developed major bullish uptrend momentum. Now, I have detected important signs which are indicating a huge bullish continuation is very likely. Therefore, I have identified all the factors we need to consider now.
When looking at my chart, we can see how ARB is forming this gigantic descending wedge formation. Within the wedge formation, ARB has already completed the wave count and accelera
ZCASH: Huge Descending Triangle, Continuation Potential!Hello Community,
welcome to my new analysis of ZCASH on the broader timeframe perspective. ZCASH has formed significant bullish developments in the recent times, aiming for higher levels. Now, I have detected further signs and prospects to consider with ZCASH.
ZCASH has now completed this huge descending triangle formation with a swift and strong bullish breakout. It is settling above the EMAs and is confirming above them with this major bull-flag formation. In the upcoming times, a breakout
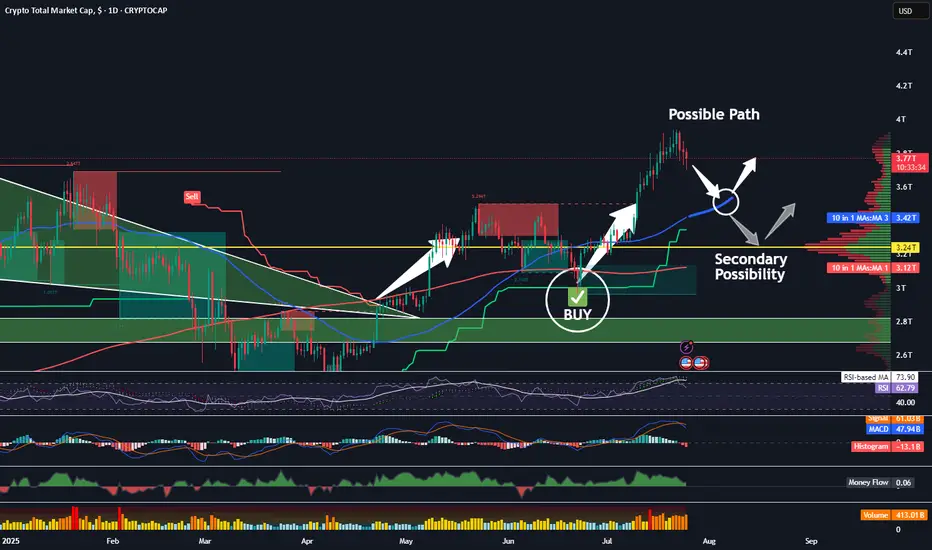
TOTAL Crypto Cap: Bull-Flag-Formation, Setup for Higher Zones!Hello Community,
welcome to my new analysis of the TOTAL cryptocurrency market cap price developments. The very recent uptrend, which brought the price of TOTAL above the $2.65T mark, was a great opportunity to secure solid profits on the long side, trading the various altcoins which moved to the upside simultaneously with TOTAL. Now, I detected the underlying formational structures which will determine the next steps for TOTAL.
When looking at my chart, we can see how TOTAL is forming this m
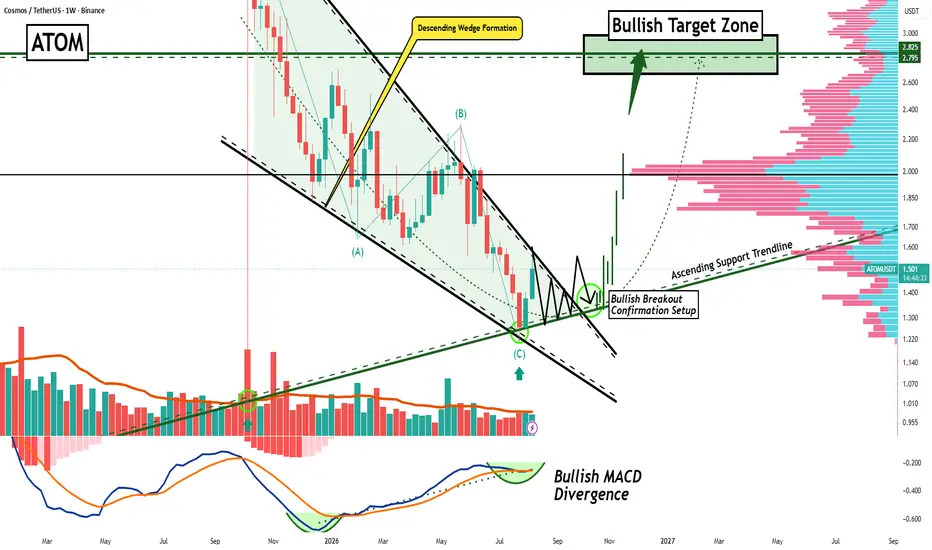
ATOM: Massive Descending Wedge Formation, These Levels to Watch!Hello Community,
welcome to my new analysis of ATOM from a weekly timeframe perspective. In the past times I have detected really interesting setups in the market to make a profit from trading them. The cryptocurrency market offers strong cryptocurrency gems in any market phase, which could turn into profitable trading opportunities along the way. One of them is ATOM. In this cryptocurrency, I detected interesting signs that could lead to major bullish expansions in the upcoming times.
When l
BANK: Massive Inverse Head-Shoulder-Formation, Level to Watch!Hello Community,
welcome to my new analysis of BANK from a 2-hour timeframe perspective. In recent times, there have been many interesting setups in the cryptocurrency having the potential to realize worthwhile surplus returns above the average market. In this case, I have detected BANK with a strong setup and incentives to form a breakout and acceleration towards the upside next.
When looking at my chart, we can see how BANK is forming this major inverse head-shoulder formation. Within this
ETHUSD: Major Channel to Determine Next Formation!Hello Community,
welcome to my new analysis of ETHUSD from a weekly timeframe perspective. ETHUSD is the second-largest cryptocurrency, and throughout the past cycles, with many ups and downs, it has held its value substantially. Nonetheless, there are important factors that are necessary to watch out for when considering the upcoming price developments. I have spotted the pivotal signs and underlying factors.
When looking at my chart, we can see how ETHUSD is trading within this historical a
GOOG: Broadening Wedge Formation, Breakout Incoming!Hello Community,
welcome to this new analysis about the TOTAL CRYPTOCURRENCY MARKET CAP from a weekly timeframe perspective. I have spotted the underlying patterns that drive the cryptocurrency market. Some patterns keep repeating on and on again. The pattern forming for the cryptocurrency total market cap again could be particularly worthwhile for upcoming trading conditions.
When looking at my chart, we can watch how TOTAL moves in this prolonged trend direction. The most pivotal source of
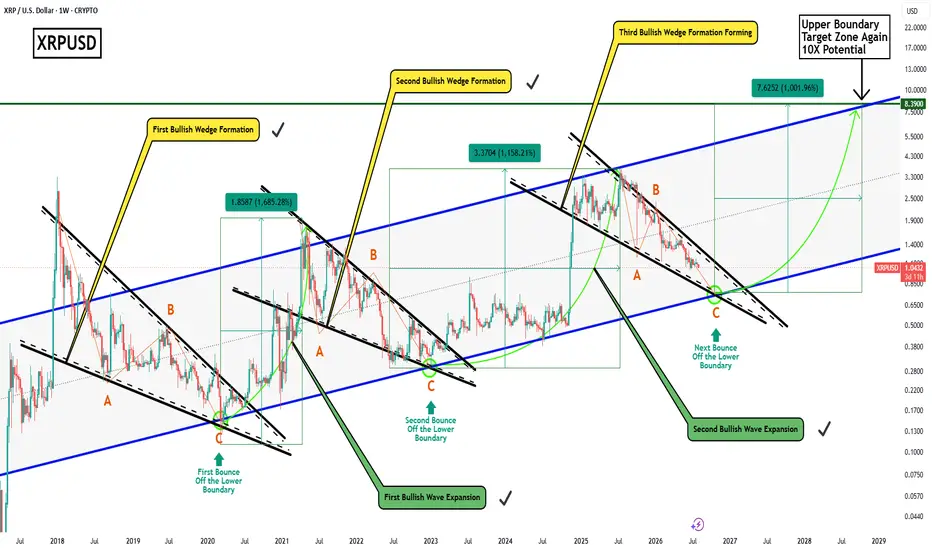
XRP Still Has HUGE Long-Term Potential With THIS Pattern!Hello There,
welcome to my new analysis of XRP from a weekly timeframe perspective. In the current cryptocurrency market, there are still coins that have long-term potential despite smart money influence on bear-market prices. In recent times, I spotted the underlying gems with strong potential to expand bullishly in the upcoming times. One of them is XRP this coin is forming an underlying pattern with huge potential.
When looking at my chart, we can see how XRP trades within this gigantic lo
PUMP: Huge Descending Wedge Formation, Bullish Continuation!Hello There,
welcome to my new analysis of PUMP from a 2-day timeframe perspective. In the current cryptocurrency market, some coins still show potential despite mixed signals in the medium and long term. Such altcoins have the potential to realize solid trading opportunities in the current market phase. With one of them being PUMP, I spotted bullish signs which should not be underestimated at the moment.
When looking at my chart now, we can see how PUMP recently completed this gigantic desce
HYPE: Huge Inverse Head-Shoulder-Formation, Targets Activated!Hello There,
welcome to my new analysis about HYPE on the weekly timeframe perspective. In recent times, I have detected interesting altcoin setups that are likely to convert into profitable trading opportunities. One of them being HYPE, the coin recently emerged with strong bullish signals.
As when looking at my chart, we can watch there how HYPE is trading within this gigantic ascending channel formation. The lower boundary already served several times as a strong support, with subsequent b
NEAR: Second BULLISH Descending Wedge Appoints BULL TARGETS!Hello There,
welcome to my new analysis about NEAR from a weekly timeframe perspective. As I detected interesting setups in the whole cryptocurrency market that are likely to turn out to be profitable trades with surplus profits, NEAR is one of them. As I am currently following a diversified trading approach in which I also trade other assets in the market, altcoins provide a solid opportunity to profit from high volatility movements.
As when looking at my chart now, we can watch there how NE
XRPUSD: Inverse Head-Shoulder-Formation, Targets Active!Hello There,
welcome to my new analysis about XRPUSD on the 30-minute timeframe perspective. In recent times I have detected interesting signs with XRPUSD, which are leading to a strong opportunity setup to consider on the long side. Especially as the bullish volume and momentum increased, this is a solid situation to consider further trading opportunities. In the current cryptocurrency market, not every altcoin shows strong setups, therefore, I only pick the worthwhile setups to move forward
ETHEREUM: Historical and Huge Triangle, +300% Breakout Incoming!Hello There,
welcome to my new analysis about Ethereum from a broader timeframe perspective. Although there are still crucial bearish signs on the local timeframe, which should not be underestimated, the longer-term perspective is rather differentiated. Before moving into this dynamic, it should be said that Ethereum did not break its established trend since 2020. The price action of Ethereum managed to form several higher highs within the structure. Now, there is a major underlying formation t
#ALTCOIN MARKETCAP UPDATE, LOOKS GOOD, HERE'S WHY!!While BTC may move toward $106k and potentially end up as a technical trap, as mentioned in my previous Bitcoin chart, I’m open to being wrong unless proven otherwise.
That said, capital is likely to rotate into altcoins. Based on the chart above, we could see a short-lived rally in altcoins. The GC Indicator is also close to turning green, which has historically been a reliable tool for fractal analysis.
Of course, nothing is guaranteed in the market, but this setup looks constructive. There’
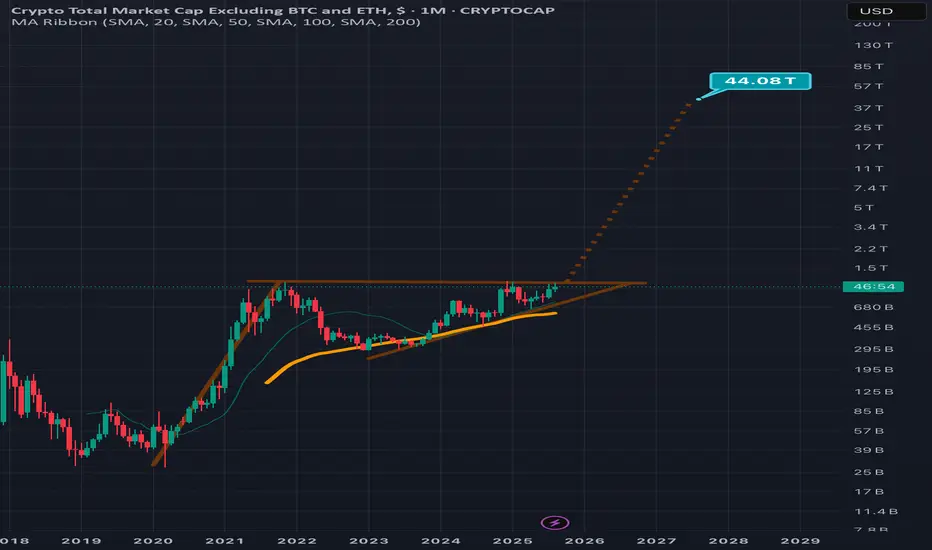
Monthly logarithmic chart on total3 suggests it could 44x!On the total3 chart we can see the majority of altcoins (excluding ethereum) have been consolidating for quite a long time in this ascending triangle which s also a bullish pennant. These patterns break to the upside far more than they break to the downside and this current one is nearing its apex. If we clued the pole of the pennant to calculate the Bullish breakout target/measured move, we can see that the target is 44 x higher than the current price. Of course this beng a logarithmic scale pa
Now We WaitTrading Fam,
In my last video, I mentioned how I had been learning to trade more patiently, giving myself those high-quality, high-probability winning trades. This is a perfect time to illustrate that strategy.
With our altcoin market overheated, I am expecting more rest, accumulation, and pullback in many of our alts. The selection of even decent entries is very slim. It's time for us to sit back, wait, and let the trades come to us again.
The TOTAL chart shows us more clearly what may occu
ALTCOINS: Market bottomed and about to surge.The Altcoin market is almost oversold on its 1W technical outlook (RSI = 30.160, MACD = -0.160, ADX = 18.210) but this very same 1W RSI pattern has emerged numerous times before an altcoin market surge (Altseason). How high it can go depends on whether the Fed will cut on its next meeting or not. Nevertheless, this level is an excellent opportunity to start investing in altcoins.
## If you like our free content follow our profile to get more daily ideas. ##
## Comments and likes are greatly
ALTS may be starting an explosive rally.This chart shows the Crypto Total Market Cap (excluding top 10) dominance trading inside a Megaphone pattern that just bottomed. The bearish wave is identical to the first that made a double bottom LL on August 5th and kickstarted an altcoin surge that peaked on December 7th 2024. The first target of this setup is 9.20%.
## If you like our free content follow our profile to get more daily ideas. ##
## Comments and likes are greatly appreciated. ##
Is there any chance for an ALTSEASON now??Just some chart fun. Do you think the pattern will be completed and the current altcoin Bull Cycle will follow the previous two? Do you think there will be a new Altseason amidst the tariff chaos?
Whatever happens, the 1W MA100 (green trend-line) has to hold (close 1W candles above it) if that would be the case and it just got breached.
-------------------------------------------------------------------------------
** Please LIKE 👍, FOLLOW ✅, SHARE 🙌 and COMMENT ✍ if you enjoy this idea! Als
ALTSEASON Merry Christmas with the biggest Buy Signal out there!First let's start this post by wishing Merry Christmas to the whole community!
It's yet again the total crypto market cap (excluding the top 10 tokens) that we are looking at as this time we have the strongest possible buy signal on the 1M chart! The 1M MA20 (blue trend-line) has completed a cross above the 1M MA50 (orange trend-line). The last time this happened was during the previous Bull Cycle on the most symmetric time possible, December 2020. In the meantime, the 1M CCI was almost at the
ALTCOINS Relentless alt season started after Christmas.This is the crypto total market cap excluding the top 10 of crypto and the 3 charts show the price action around the Christmas day of the last three Cycles. This is best to be kept simple. The months leading to Christmas are normally either correction or accumulation phases. What followed straight after Christmas in 2020 and 2016 was a relentless rally. Given that the altcoin market just tested the 1D MA50 and is rebounding, historically we can see a similarly aggressive rally as soon as January