ADANIPORTS 2Hour Time frameADANIPORTS 2-Hour Snapshot
Current Price: ₹1,388.90
Previous Close: ₹1,380.90
Day Range: ₹1,385.00 – ₹1,404.90
52-Week Range: ₹995.65 – ₹1,494.00
Volume: 2,553,605
VWAP: ₹1,392.82
Market Cap: ₹300,065 Cr
🔎 Technical Indicators
Relative Strength Index (RSI): Neutral
Moving Averages:
50-period: ₹1,385.28 — Negative
100-period: ₹1,368.32 — Negative
200-period: ₹1,260.96 — Positive
Moving Average Convergence Divergence (MACD): -14.67 — Negative
Stochastic Oscillator: 39.95 — Neutral
📈 Market Sentiment
Pivot Points:
Resistance: ₹1,327.20
Support: ₹1,305.85
📅 Outlook
Bullish Scenario: A breakout above ₹1,327.20 could signal a move toward ₹1,350.00.
Bearish Scenario: A drop below ₹1,305.85 may lead to further downside.
Overall Bias: Neutral, with mixed signals from moving averages and momentum indicators.
Amazon

BTCUSDT 2Hour Time frameBTC/USDT 2-Hour Snapshot
Current Price: $112,349.00
Change: -0.29% from the previous close
Intraday High: $112,891.00
Intraday Low: $110,812.00
🔎 Technical Indicators
Relative Strength Index (RSI): Neutral
Moving Averages:
7-period MA: $112,376 (short-term support)
25-period MA: $111,484 (medium-term support)
99-period MA: $113,049 (short-term resistance)
📈 Market Sentiment
Pivot Points:
Resistance: $113,650
Support: $108,666
📅 Outlook
Bullish Scenario: A breakout above $113,650 could signal a move toward $120,000.
Bearish Scenario: A drop below $108,666 may lead to further downside.
Overall Bias: Neutral, with mixed signals from moving averages and momentum indicators.

USDJPY 2Hour Time frameUSD/JPY 2-Hour Snapshot
Current Price: 147.46 JPY
Change: +0.05% from the previous close
Market Cap: Not applicable
P/E Ratio: Not applicable
EPS: Not applicable
Intraday High: 147.59 JPY
Intraday Low: 147.27 JPY
🔎 Technical Indicators
RSI (14): Neutral
MACD: Neutral
Moving Averages:
5-period SMA: Not available
10-period SMA: Not available
20-period SMA: Not available
50-period SMA: Not available
📈 Market Sentiment
Pivot Points:
R1: Not available
R2: Not available
R3: Not available
S1: Not available
S2: Not available
S3: Not available
📅 Outlook
Bullish Scenario: A breakout above the current price could lead to further gains.
Bearish Scenario: A drop below the current price may test support levels.
Overall Bias: Neutral, with mixed signals from moving averages and momentum indicators.

MSFT 45Minutes Time frameMSFT 45-Minute Snapshot
Metric Value
Current Price $498.41 USD
Change +0.05% from previous close
Market Cap $2.79 Trillion
P/E Ratio 28.88
EPS $12.93
🔎 Technical Indicators
RSI (14): 40.92 — Neutral
MACD: -2.70 — Bearish momentum
Moving Averages:
5-period SMA: $502.33 — Sell signal
10-period SMA: $504.10 — Sell signal
20-period SMA: $509.62 — Sell signal
50-period SMA: $509.09 — Sell signal
📈 Market Sentiment
Pivot Points:
R1: $507.19
R2: $519.38
R3: $526.79
S1: $487.59
S2: $480.18
S3: $467.99
📅 Outlook
Bullish Scenario: A breakout above $507.19 could lead to a push toward $519.38 and higher.
Bearish Scenario: A drop below $487.59 may test support around $480.18.
Overall Bias: Neutral to slightly bearish, with mixed signals from moving averages and momentum indicators.

TSLA 45Minutes Time frameTSLA 45-Minute Snapshot
Current Price: $346.97 USD
Change: +0.18% from the previous close
Intraday Range: Not available
🔎 Technical Indicators
RSI (14): 53.64 — Neutral
MACD: 1.78 — Buy signal
Moving Averages:
5-period SMA: $347.01 — Sell signal
10-period SMA: $346.78 — Buy signal
20-period SMA: $347.82 — Sell signal
50-period SMA: $340.53 — Buy signal
📈 Market Sentiment
Pivot Points:
R1: $347.52
R2: $348.18
R3: $348.95
S1: $345.32
S2: $344.65
S3: $343.99
📅 Outlook
Bullish Scenario: A breakout above $347.52 could lead to a push toward $348.18 and higher.
Bearish Scenario: A drop below $345.32 may test support around $344.65.
Overall Bias: Neutral to slightly bullish, with mixed signals from moving averages.

BANKNIFTY 45Minutes Time frameBANKNIFTY 45-Minute Snapshot (Updated)
Current Price: 54,533 INR
Change: +0.77% (approx) from previous close
Day's Range: 54,200 – 54,600 INR (intraday estimate)
52-Week Range: 45,000 – 60,000 INR
🔎 Technical Indicators
RSI (14): ~65 — Slightly overbought, watch for pullbacks
MACD: Positive, bullish momentum
Moving Averages:
5-period SMA: 54,300 — Price above SMA → Buy signal
10-period SMA: 54,100 — Price above SMA → Buy signal
20-period SMA: 53,800 — Price above SMA → Buy signal
50-period SMA: 53,200 — Price above SMA → Buy signal
🔑 Key Levels
Resistance:
R1: 54,600 — Immediate resistance
R2: 55,000 — Psychological/round number resistance
Support:
S1: 54,300 — Near-term support
S2: 54,000 — Stronger support
📅 Outlook
Bullish Scenario: Price holds above 54,500 and breaks 54,600 → upward move toward 55,000.
Bearish Scenario: Price falls below 54,300 → pullback to 54,000 possible.
Overall Bias: Moderately bullish with strong upward momentum, but near-term resistance around 54,600.

SPX 3Hour Time frameSPX 3-Hour Snapshot
Current Price: 6,512.62 USD
Change: +0.21% from the previous close
Recent High: 6,508.23 USD (August 28, 2025)
Recent Low: 5,500.00 USD (March 13, 2025)
🔎 Technical Indicators
RSI (14): Neutral
MACD: Bullish momentum
Moving Averages:
5-period SMA: Buy signal
10-period SMA: Buy signal
20-period SMA: Buy signal
50-period SMA: Buy signal
📈 Market Sentiment
Golden Cross: The S&P 500 recently formed a "golden cross," where the 50-day moving average crossed above the 200-day moving average, indicating a bullish trend.
Business Insider
Analyst Outlook: Barclays raised its 2025 year-end S&P 500 target to 6,450, citing stronger-than-expected corporate earnings and optimism around artificial intelligence.
Reuters
📅 Outlook
Bullish Scenario: A breakout above 6,508.23 USD could lead to a push toward 6,600 USD and higher.
Bearish Scenario: A drop below 6,400 USD may test support around 6,200 USD.
Overall Bias: Moderately bullish, with positive momentum but facing near-term resistance.

HOOD 3Hour Time frameHOOD 3-Hour Snapshot
Current Price: $118.50
Change: +1.21% from the previous close
Market Cap: $82.63 billion
P/E Ratio: 46.21
EPS (TTM): $1.96
🔎 Key Levels
Resistance:
R1: $120.00 (recent high)
R2: $125.00 (next resistance zone)
Support:
S1: $115.00 (immediate support)
S2: $110.00 (next support level)
📈 Technical Indicators
RSI (14): 43.40 — Neutral
MACD: 0.69 — Bullish momentum
Moving Averages:
5-period SMA: $116.00 — Buy signal
10-period SMA: $113.00 — Buy signal
20-period SMA: $110.00 — Buy signal
50-period SMA: $105.00 — Buy signal
📌 Market Sentiment
S&P 500 Inclusion: Robinhood is set to join the S&P 500 index on September 22, 2025, replacing Caesars Entertainment. This milestone reflects the company's growth and stability in the financial technology sector.
Reuters
Recent Performance: The stock has gained approximately 496% over the past 12 months, driven by strong financial performance and increased user engagement.
Barron's
Analyst Outlook: Analysts maintain a positive outlook on HOOD, with a consensus rating of "Buy" and a 12-month price target suggesting potential upside.
TipRanks
📅 Outlook
Bullish Scenario: A breakout above $120.00 could lead to a push toward $125.00 and higher.
Bearish Scenario: A drop below $115.00 may test support around $110.00.
Overall Bias: Moderately bullish, with positive momentum but facing near-term resistance.

BABA 3Hour Time frameBABA 3-Hour Snapshot
Current Price: $147.10
Change: +4.18% from the previous close
Market Cap: $347.34 billion
P/E Ratio: 16.47
EPS (TTM): $8.84
Beta: 0.54
Dividend Yield: 0.73%
🔎 Key Levels
Resistance:
R1: $148.50 (prior high and Fibonacci cluster)
R2: $157.80 (Fibonacci 0.382 retracement)
Support:
S1: $135.00 (recent breakout level)
S2: $130.00 (next support level)
📈 Technical Indicators
RSI (14): 62.82 — Neutral
MACD: 4.08 — Bullish momentum
Moving Averages:
5-period SMA: $135.30 — Buy signal
10-period SMA: $128.98 — Buy signal
20-period SMA: $125.03 — Buy signal
50-period SMA: $119.26 — Buy signal
📌 Market Sentiment
Catalyst: Shares surged ~13% following a favorable court ruling, marking the highest close since March 2025.
Sector Performance: Positive momentum in the Chinese tech sector, with Alibaba leading gains.
Analyst Outlook: Average 12-month price target of $167.17, indicating a 13.64% upside from current levels.
StockAnalysis
📅 Outlook
Bullish Scenario: A breakout above $148.50 could lead to a push toward $157.80 and higher.
Bearish Scenario: A drop below $135.00 may test support around $130.00.
Overall Bias: Moderately bullish, with positive momentum but facing near-term resistance.

BTCUSDT 1D Time frame 📊 BTC/USDT Daily Snapshot
Current Price: $112,493
Change: −0.37% from the previous close
Intraday Range: $110,812 – $113,029
Market Cap: Approximately $2.2 trillion
P/E Ratio: Not applicable (Bitcoin is not a stock)
Beta: Not applicable (Bitcoin is not a stock)
🔎 Key Levels
Resistance:
R1: $113,000 (recent high)
R2: $116,000 (next resistance zone)
Support:
S1: $110,800 (immediate support)
S2: $107,000 (next support level)
S3: $102,000 (longer-term support)
📈 Technical Indicators
RSI (14): 43 — Neutral, indicating balanced buying and selling pressure
MACD: Bullish crossover observed, suggesting upward momentum
Moving Averages:
5-day SMA: $111,500 — Buy signal
50-day SMA: $112,830 — Resistance level
200-day SMA: $101,000 — Long-term support
Stochastic Oscillator: Oversold, indicating potential for a bounce
📌 Market Sentiment
Catalysts: Positive momentum following recent gains and analyst upgrades.
Sector Performance: Cryptocurrency market showing strength, with Bitcoin leading gains among peers.
Options Activity: Significant trading in call options at $113,000 strike price, indicating bullish sentiment.
📅 Outlook
Bullish Scenario: A breakout above $113,000 could lead to a push toward $116,000 and higher.
Bearish Scenario: A drop below $110,800 may test support around $107,000.
Overall Bias: Moderately bullish, with positive momentum but facing near-term resistance.

PLTR 1D Time frame📊 Palantir (PLTR) Daily Snapshot
Current Price: $162.36
Change: +4.01% from the previous close
Intraday Range: $156.37 – $162.75
Volume: 59,300,483 shares traded
🔎 Key Levels
Resistance:
R1: $162.75 (recent high)
R2: $165.00 (psychological level)
R3: $170.00 (next resistance zone)
Support:
S1: $156.37 (recent low)
S2: $150.00 (psychological support)
S3: $145.00 (next support zone)
📈 Technical Indicators
RSI (14): 67.41 — Neutral to slightly bullish
MACD: 1.51 — Positive momentum
Moving Averages:
5-day SMA: $157.25 — Buy signal
50-day SMA: $145.00 — Buy signal
200-day SMA: $130.00 — Buy signal
Stochastic Oscillator: 77.32 — Overbought
ADX (14): 44.32 — Strong trend strength
📌 Market Sentiment
Catalysts: Positive momentum following recent gains and analyst upgrades.
Sector Performance: AI and data analytics sectors showing strength, with Palantir leading gains among peers.
📅 Outlook
Bullish Scenario: A breakout above $162.75 could lead to a push toward $170.00.
Bearish Scenario: A drop below $156.37 may test support around $150.00.
Overall Bias: Moderately bullish, with positive momentum but facing near-term resistance.

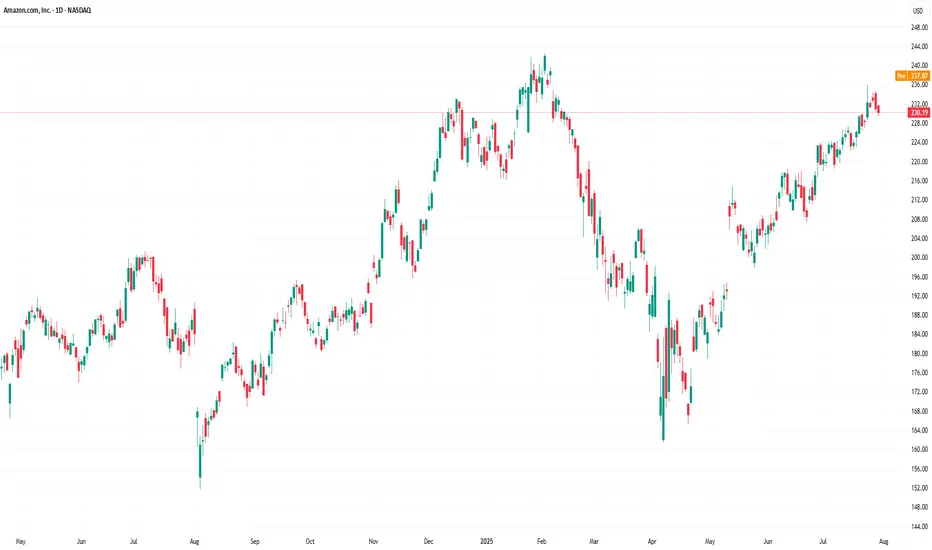
AMZN 1D Time frame📊 Amazon (AMZN) Daily Snapshot
Current Price: $238.24
Change: +1.02% from the previous close
Intraday Range: $235.08 – $238.85
Volume: 27,033,778 shares traded
🔎 Key Levels
Resistance:
R1: $238.85 – $239.50 (short-term resistance zone)
R2: $242.52 (52-week high)
Support:
S1: $235.08 – $235.84 (short-term support zone)
S2: $230.00 (psychological support)
📈 Technical Indicators
RSI (14): 60.03 — Neutral to slightly bullish
MACD: 2.30 — Positive momentum
Moving Averages:
5-day SMA: $233.62 — Buy signal
50-day SMA: $226.19 — Buy signal
200-day SMA: $213.56 — Buy signal
📌 Market Sentiment
Catalysts: Positive market sentiment, with AMZN outperforming key competitors in recent sessions.
Sector Performance: Tech sector showing strength, with AMZN leading gains among peers.
📅 Outlook
Bullish Scenario: A breakout above $238.85 could lead to a push toward $242.52 (52-week high).
Bearish Scenario: A drop below $235.08 may test support around $230.00.
Overall Bias: Moderately bullish, with positive momentum but facing near-term resistance.

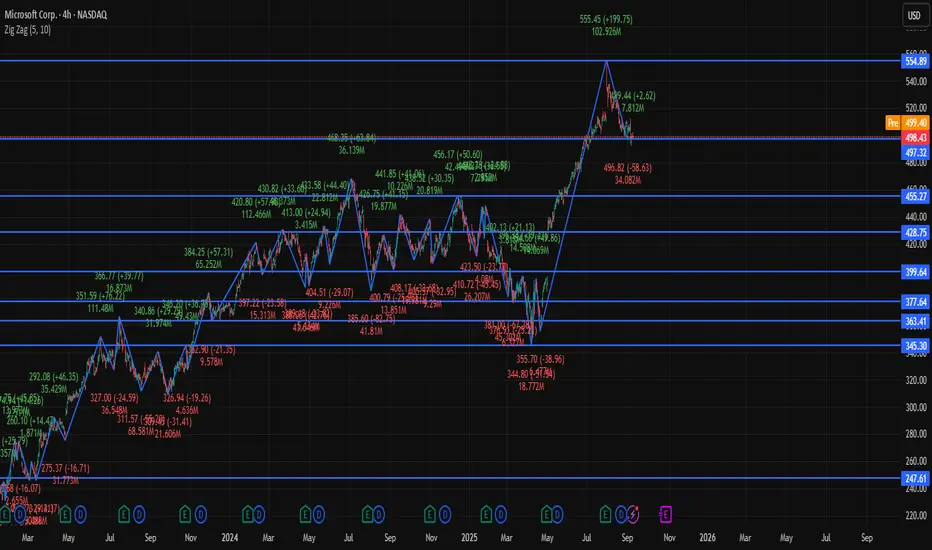
MSFT 4Hour Time frameMSFT Snapshot (as of latest session)
Current Price: Around $498.40
Day Range: $497.0 – $502.2
Open: ~$501.4
Market Cap: ~$2.79 Trillion
P/E Ratio: ~28.9
EPS: ~12.93
Pivot Levels (Daily basis, useful for 4-Hour analysis)
Pivot Point: ~$498.9
Resistance Levels:
R1: ~$499.5
R2: ~$500.0
R3: ~$500.6
Support Levels:
S1: ~$498.4
S2: ~$497.8
S3: ~$497.3
Technical View (4-Hour Frame)
Momentum: Price is consolidating near the pivot (~$498–499).
Indicators:
RSI around 45 → neutral to slightly bearish.
MACD negative → bearish bias.
Moving Averages (short and long) → leaning bearish.
Bias:
A breakout above $500 may open short-term upside toward ~$500.6 or higher.
If MSFT falls below $498, pullback risk increases toward $497.8 → $497.3.
✅ Conclusion: On the 4-hour timeframe, MSFT is in a neutral-to-bearish phase, stuck around its pivot. Buyers need a clear move above $500 to regain strength; otherwise, it risks drifting lower toward support.
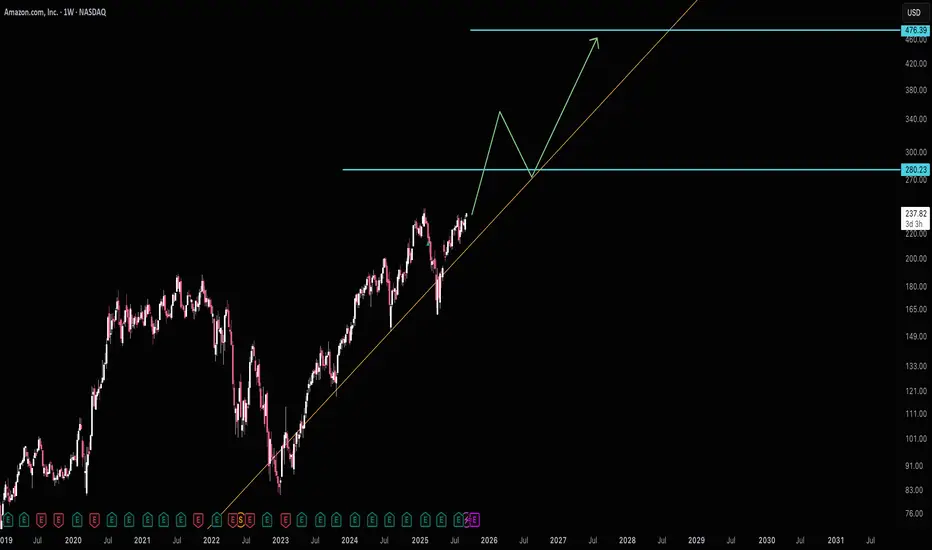
Amazon making it's way to next support $280Amazon seems to be overlooked at the moment, but it should start making bigger moves as it approaches $280 resistance (next support).
I see a lot of things that lead me to believe next year will have a big pullback in tech. Until then AMZN looks to have really good risk reward as it's still so close to it's long term trend line with revenue growth steadily increasing.
Good luck!
AMAZON PULLBACK AHEAD|SHORT|
✅AMAZON has retested a key
Resistance level of 236.60$
And as the pair is already
Making a bearish pullback
A move down to retest the
Demand level below at 230.00$
Is likely on Monday
SHORT🔥
✅Like and subscribe to never miss a new idea!✅

Amazon (AMZN) Shares Jump Over 4%Amazon (AMZN) Shares Jump Over 4%
Amazon (AMZN) shares were among the top gainers in the equity markets yesterday, rising more than 4% and closing above $235 for the first time since February 2025.
The rally was fuelled by reports that Kuiper – Amazon’s project aimed at providing internet access via a network of low-Earth orbit satellites – has signed a partnership agreement with JetBlue. From 2027, this will allow free Wi-Fi to be offered on board selected aircraft. As a result, Amazon’s project is emerging as a new competitor to Elon Musk’s Starlink.
Technical Analysis of Amazon (AMZN) Chart
Since August, AMZN’s price fluctuations have been forming a bullish structure of higher highs and higher lows (0-A-B-C-D-E-F).
These and other key turning points provide the basis for constructing an upward channel (shown in blue), with the following implications:
→ in the near term, the price could surpass the previous high at point E, extending the bullish structure;
→ the channel median has proved to be an important support level – it held the price during the early August decline and continued to play this role throughout the month.
It is worth noting that AMZN’s upward momentum within the channel is unfolding step by step, making it possible to draw intermediate resistance lines R0, R1, and R2. In this context:
→ they can be viewed as examples of a bullish flag chart pattern;
→ yesterday’s rally with a bullish gap may signal the start of a new growth phase towards the next resistance at R3.
However, on this path, hurdles could come from:
→ the upper boundary of the blue channel;
→ the $230 level, around which a bearish head and shoulders pattern formed in February, marking this year’s high;
→ the psychological level of $250.
This article represents the opinion of the Companies operating under the FXOpen brand only. It is not to be construed as an offer, solicitation, or recommendation with respect to products and services provided by the Companies operating under the FXOpen brand, nor is it to be considered financial advice.

Don’t Miss: AMZN Call Opportunity at $242.50! 🚀 AMZN Swing Alert – 2025-08-15 🚀
**Sentiment:** Moderate Bullish
**Setup:** Call Option Trade
---
## 📈 Market Snapshot
* **Daily RSI:** 61.5 → Strong bullish momentum
* **5 & 10-Day Trend:** +3.68% / +7.52% → Confirmed upside
* **Volume:** Avg (1.0x) → Lacks strong institutional confirmation
* **Call/Put Ratio:** 1.00 → Neutral sentiment
* **VIX:** 14.84 → Low volatility, ideal for controlled swings
---
## ⚖️ Consensus & Conflicts
**Agreement:**
* Bullish momentum recognized across multiple models
* Favorable market conditions for swings
* Weak volume highlighted as a risk
**Disagreement:**
* Some models (Claude/Anthropic) advise caution, suggesting no immediate trade
* Confidence varies: DeepSeek favors a stronger bullish call, others remain cautious
---
## 🎯 Trade Setup – AMZN CALL
**Entry Condition:** At market open
**Strike:** \$242.50
**Expiration:** 2025-08-29
**Entry Price:** \$0.85
**Confidence:** 75%
**Profit Target:** \$2.13 (150% gain)
**Stop Loss:** \$0.50 (30% of premium)
**Key Risks:**
* Weak volume may reduce momentum sustainability
* Market shifts require active monitoring
---
## 📝 TRADE DETAILS (JSON)
```json
{
"instrument": "AMZN",
"direction": "call",
"strike": 242.5,
"expiry": "2025-08-29",
"confidence": 0.75,
"profit_target": 2.13,
"stop_loss": 0.50,
"size": 1,
"entry_price": 0.85,
"entry_timing": "open",
"signal_publish_time": "2025-08-15 11:56:23 UTC-04:00"
}
```
---
## 📊 Quick Reference – TradingView Ready
🎯 **Instrument:** AMZN
🔀 **Direction:** CALL (Long)
💵 **Entry Price:** \$0.85
📈 **Profit Target:** \$2.13
🛑 **Stop Loss:** \$0.50
📅 **Expiry:** 2025-08-29
📏 **Size:** 1 contract
⏰ **Entry Timing:** Market Open
🕒 **Signal Time:** 2025-08-15 11:56 EDT
---
### Suggested Viral Title & Tags:
**🔥 AMZN Swing Alert: Call Setup Ready – Strike \$242.50 🚀**
\#AMZN #SwingTrade #OptionsTrading #Bullish #CallOption #Momentum #TradeSetup #TechnicalAnalysis #StockAlerts #Finance #TradingSignals #MarketWatch #LongTrade

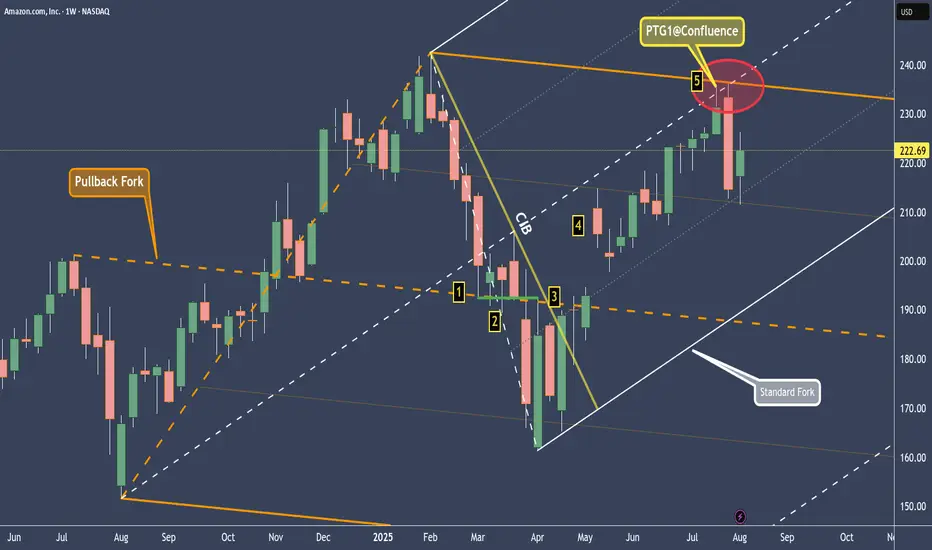
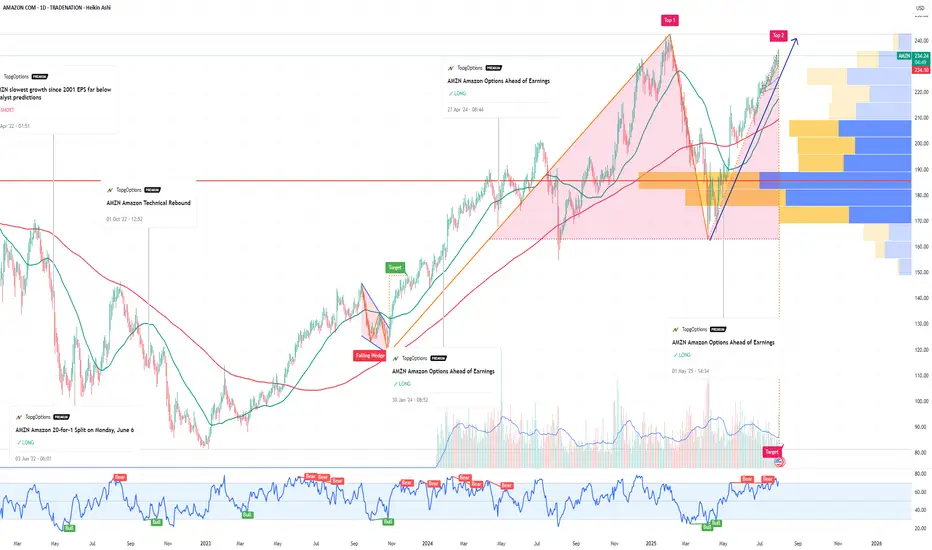
AMZN - Amazon Hit The 80% profit Target. Trend change ahead?On this chart we have 2 forks.
Orange: the pullback fork
It shows us where the equilibrium is — at the centerline, which the market respected to the tick (1).
After that, there were several bars that formed support (2).
When the CIB line was broken (3), the market gapped above the orange centerline and made its way up to the white centerline (5), the target that we can expect in around 80% of all cases.
Note the confluence point where the centerline of the white fork and the upper median line parallel (U-MLH) of the orange fork meet.
A day later, we saw a sharp sell-off within just one bar! Is this now another trend reversal?
No, clearly not.
For a trend reversal to occur, the market would have to break the white L-MLH (lower median line parallel). As long as the market is trading within the white fork, we remain long.
I’ll make a YT video soon, covering the details.
Wishing you all a successful new trading week.
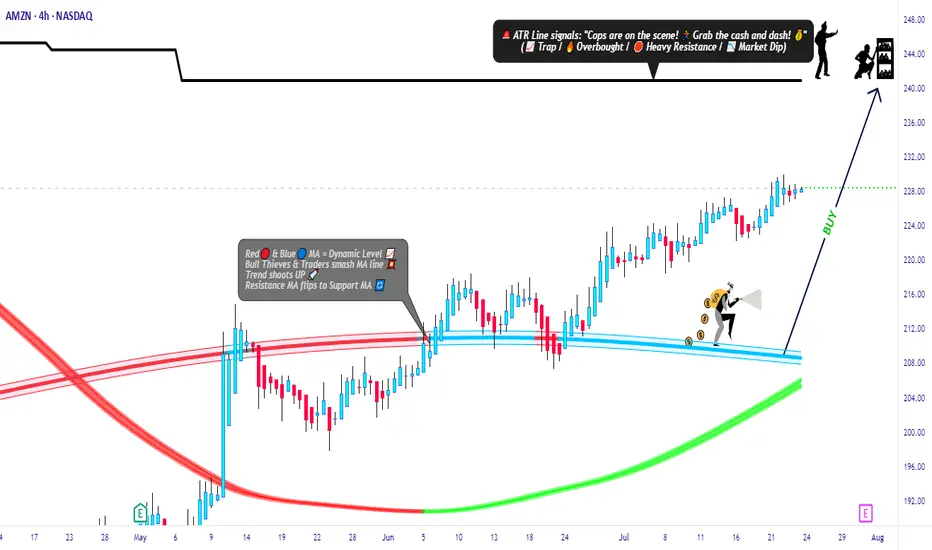
Amazon Market Robbery Blueprint – Swing/Scalp Long Setup🟨💣 “AMZN Market Heist Blueprint – Bullish Robbery in Progress 🚨💼💸” 💣🟨
By Thief Trader – Rob the Market with Precision
🌍 Hello World! Hi, Hola, Ola, Bonjour, Hallo, Marhaba!
🤑💰 Calling all Money Makers & Market Robbers – get ready to execute the next bullish heist on AMAZON.COM, INC (NASDAQ: AMZN), powered by our signature Thief Trading Style™ – where technical precision meets psychological warfare.
🔥 Plan Summary:
Based on our fundamental & technical intel, we’re eyeing a long entry into AMZN. The target? 💥The High-Risk ATR Police Barricade Zone – a zone flooded with liquidity, overbought conditions, fakeouts, and bear traps. It's where most traders get caught – but we walk in with a blueprint.
🟩 Entry Zone – “The Vault Is Wide Open!” 💼📈
🕰 Entry timeframe: 15min / 30min (preferably after confirmation or rejection wick)
💵 Buy Limit Orders: Place multiple layered entries (DCA-style) near recent swing lows/highs. Wait for breakout confirmation; no blind orders before breakout!
Thief Note: This isn’t spray-and-pray – this is sniper-mode. Scope, place, execute.🎯
🛑 Stop Loss – “SL is the Escape Route!”
📍 SL below recent 4H candle wick swing low (around 219.00 – adjust based on your risk/margin size).
Important: Only place SL after breakout; not before. Risk per order must match your lot strategy.
🎯 Target – “Grab the Bag or Escape Before the Alarms!”
💸 Target Zone: 240.00
🧠 Smart robbers know when to bail early – use a trailing SL to lock gains. Exit before reversal or heavy volume shift.
👀 Scalper Alert – “Only One Way – LONG!”
If you’re a quick thief with a fat bag, hit-and-run with a Long scalp. If you’re running lean, swing with the crew. Watch the PA and news timing. Trailing SL = insurance policy.
📊 Why Bullish? Here’s the Background:
🔍 Macro Drivers
💼 COT Report
🌍 Geo-political Influences
🧠 Sentiment Score
📈 Index Correlation
🔮 Intermarket Signals
💹 Institutional Positioning
All lights flashing green for short-to-midterm bullishness, but keep checking real-time updates.
⚠️ Risk Alert – News Triggers Can Blow Your Cover 🚨
🗞 Avoid trading near major news releases – they cause volatility spikes.
🧲 Always protect gains with trailing stops and don’t over-leverage your ammo.
💖 Support the Robbery – Hit BOOST 🔥
Smash that 💥BOOST💥 button if you ride with the Thief Trading Crew!
Let’s build this into the #1 robbery squad on TradingView.
Make money. Protect profits. Trade like a bandit – with a plan. 💼📈🏆
🔔 Stay Tuned for the Next Robbery Mission 🔔
Another heist plan dropping soon. Until then, rob smart, rob safe, and rob rich.
– Thief Trader™ | Rob The Market. Not Your Wallet.
AMZN Amazon Options Ahead of EarningsIf you ahven`t bought the recent dip on AMZN:
Now analyzing the options chain and the chart patterns of AMZN Amazon prior to the earnings report this week,
I would consider purchasing the 245usd strike price Calls with
an expiration date of 2025-9-19,
for a premium of approximately $7.02.
If these options prove to be profitable prior to the earnings release, I would sell at least half of them.
Disclosure: I am part of Trade Nation's Influencer program and receive a monthly fee for using their TradingView charts in my analysis.
Amazon (AMZN) Shares Rise Ahead of Earnings ReportAmazon (AMZN) Shares Rise Ahead of Earnings Report
Today, 31 July, Amazon is set to release its quarterly earnings after the close of the regular trading session. Available data show that Amazon (AMZN) shares are exhibiting bullish momentum, reflecting positive market expectations:
→ In July, AMZN shares have outperformed the S&P 500 index (US SPX 500 mini on FXOpen);
→ Yesterday, following the end of the regular session, AMZN shares surged by approximately 3% in after-hours trading.
The rise in AMZN comes amid strong earnings reports from other tech giants, such as Microsoft (MSFT) and Meta Platforms (META). For example, MSFT shares rose by more than 8% in post-market trading. Their success has likely fuelled optimism that Amazon’s upcoming report will also impress.
All of this has brought noticeable changes to the technical outlook for the AMZN stock price.
Technical Analysis of the Amazon (AMZN) Chart
Following the release of the previous earnings report, price movements have formed an upward channel, as indicated by the Regression Trend tool. However, in recent days, a series of bearish signals emerged:
→ On Thursday, AMZN broke above the $230 level (marked by an upward arrow), but the session closed well below the highs – a sign of selling pressure;
→ Friday and Monday’s sessions produced candles with small bodies, indicating market indecision;
→ On Tuesday, bears took the lead (marked by a downward arrow), with a relatively long candle closing near the session low.
Thus, the chart gave reason to assume that optimistic sentiments were waning. However, today’s session is likely to open near the $237.30 level, effectively negating the bearish interpretation of the previous five candles and shifting momentum back in favour of the bulls.
In this context:
→ Support could be provided by the $230 level as well as the median of the Regression Trend channel;
→ Key resistance could be found at the previous high of $242.23 and the psychological level of $250.
Whether AMZN can surge to a new all-time high will largely depend on the company’s performance in AI – a theme that remains highly relevant in 2025.
This article represents the opinion of the Companies operating under the FXOpen brand only. It is not to be construed as an offer, solicitation, or recommendation with respect to products and services provided by the Companies operating under the FXOpen brand, nor is it to be considered financial advice.
Wall Street takes off: 5 secret growth engines for #S&P500 Record closes for the indices on July 21 came from a powerful combo: a surge in #Google , a strong start to the earnings season, gains in #Apple (+0.6%), #Amazon (+1.4%), plus #Microsoft, #Meta Platforms, and #Nvidia . This momentum, coupled with market bets on imminent Fed rate cuts and hopes for a softening US-EU tariff conflict, pushed #S&P500 and #NQ100 to new all-time highs.
5 mega drivers that could keep #S&P500 and #NQ100 on the runway through 2025:
• AI capex and monetization: Top cloud providers are ramping up spending in computing clusters and generative AI solutions. The growing lineup of paid AI products (Google Gemini, Microsoft Copilot+ Apps, Amazon Bedrock) is starting to generate significant revenue, boosting profit estimates for the “Magnificent 7.”
• Fed policy easing: If inflation keeps drifting towards 2%, we may see the first rate cut of the cycle between July and September. Historically, every 25 bps drop in 10-year UST yields adds ~2% to the #NQ100 ’s valuation multiple.
• Record buybacks and dividends: #S&P500 companies hold $3.5 trillion in cash. After tax relief on repatriated foreign earnings earlier this year, several megacap boards approved accelerated buybacks — mechanically supporting stock prices.
• Easing tariff risks: Potential trade deals between the US and EU, and the US and Mexico, would remove the threat of 20–50% tariffs priced into valuations, unlocking CAPEX in manufacturing and semiconductors — sectors with a heavy #NQ100 weight.
• Resilient consumers and services: Unemployment remains near 4%, and household spending is growing 2–3% YoY. This supports e-commerce, streaming, and platform advertising — together making up ~40% of #NQ100 and ~28% of #S&P500 .
The current highs of #S&P500 and #NQ100 aren’t a random spike — they result from strong corporate earnings, expectations of Fed cuts, and hopes of trade détente. If even some of these five drivers materialize, the indices have a strong chance to stay elevated and set new records by year-end. FreshForex analysts believe current prices could spark a new rally, with today’s market conditions offering plenty of entry points in both indices and stock CFDs.

TESLA 400 BY END OF YEAR !! 5 REASONS !!!
1. **Strong Earnings and Revenue Growth**
Tesla has a track record of exceeding earnings expectations. If the company reports robust financial results in Q3 and Q4—driven by higher vehicle deliveries and growth in its energy storage business—investors are likely to gain confidence. This could push the stock price upward as Tesla demonstrates its ability to scale profitably.
2. **Advancements in Autonomous Driving**
Tesla’s Full Self-Driving (FSD) technology is a game-changer in the making. If Tesla achieves significant progress toward Level 4 or 5 autonomy—where vehicles can operate with little to no human intervention—it could position the company as a leader in transportation innovation. Such a breakthrough would likely excite investors and drive the stock price higher.
3. **Battery Technology Innovation**
Tesla is working on developing cheaper, longer-lasting batteries, which could lower production costs and improve profit margins. If the company announces advancements in battery tech—such as improvements from its Battery Day initiatives or new manufacturing processes—it could signal a competitive edge, boosting the stock to $400.
4. **Global Expansion and Production Increases**
Tesla’s new Gigafactories in Texas and Berlin are ramping up production, while potential market entries like India loom on the horizon. Increased output and access to new customers signal strong growth potential. If Tesla successfully scales its operations, investors may see this as a reason to push the stock price toward $400.
5. **Favorable Market Trends and Government Policies**
The global shift toward sustainable energy and electric vehicles (EVs) is accelerating, supported by government incentives and regulations favoring clean energy. If EV adoption continues to rise and policies provide a tailwind—such as subsidies or stricter emissions standards—Tesla, as an EV leader, could see increased demand and a higher stock valuation.
While reaching $400 by year-end is ambitious, Tesla’s strong brand, innovative edge, and leadership under Elon Musk could make it achievable. That said, risks like market volatility and growing competition from other EV makers could pose challenges. If these five factors align, however, Tesla’s stock has a solid shot at hitting that target.
