XM Inverse H&S heading to lockup expirationMy key points:
1. Sap bought XM ( Qualtrics) back in 2018 for $8b with a P/S : 19.9 www.cnbc.com
2. Based on guidance for 2021 ($954m) current P/S stands at: 17.9 www.marketbeat.com
3. Descending Triangle Breakout with Apex time and possible retest on earnings date
4. Potential Inverse H&S
5. Rsi divergence & breakout
6. Insiders lock up expiration on 07/07/21 ( www.nasdaq.com )
*medium risk reward ratio
** Stop loss on latest low
*** Always think for yourself before trading/investing, the above are only my own thoughts on a possible scenario and nothing more.
Apex

Bitcoin Preparing for New Highs April. $100,000 Inevitable.As in the words of Michael Saylor: "There is no better asset to buy, there is no better asset to buy, for a third time there is no better asset to buy." Don't get lost chasing alt-coins that you forget to accumulate the ultimate apex financial asset of our lifetime which is Bitcoin. I have been telling people for the past 2 months that Bitcoin under $100,000 is a good deal. I remember when I use to say Bitcoin under $10,000 was a steal not that long ago.
We have been trading above a steady $50,000 for Bitcoin the past couple weeks. It seems like every time we test the 50 day moving average and bounce off we get a beautiful run up. January 27th 2021 was the last time we touched the 50 day moving average and that yielded a 100+% gain in Bitcoin price within 45 days. We also have a bullish divergence on our daily MACD.
History repeating itself? We'll see. Always stack those satoshis! If you don't know what to buy just freaking buy Bitcoin! Convert that dirty fiat currency loosing 20% yearly purchasing power into Bitcoin that gains purchasing power every year.
Much love, peace, health, and wealth!

XRPUSD looks ready to break out of 4hrchart ascending triangleI give it no later than the 11th-12th of this month for xrp to finally break above this pattern 58-59 cents is the target here. Of course no bullish breakout has been confirmed yet meaning a fakeout resulting in a breakdown instead of up is still potentially in the cards. I will be waiting an obvious breakout one way or the other however probability currently favors the bulls slightly. *not financial advice*

$BTC | Will #Bitcoin hold support at the 100MA | @barzorrBitcoin trades just above the 100ma in the 4 hourly charts and is approaching the apex of the triangle. Will the bulls step up this time and take bitcoin to higher levels?

Bitcoin's Next Psychological Destination $70,000In many ways I still feel like we're just in the very early stages of this bull cycle in Bitcoin. Interesting to see how this one will play out. We just hit the $60,000 psychological number and $70,00 will be next. Grayscale Capital and MicroStrategy Investments are investing heavily at all time highs. They will continue to do so even past $100,000. Don't forgot the avalanche of corporations and intuitions that want a piece of that Bitcoin pie. Bitcoin is starting to seem like a good price under $100,000.

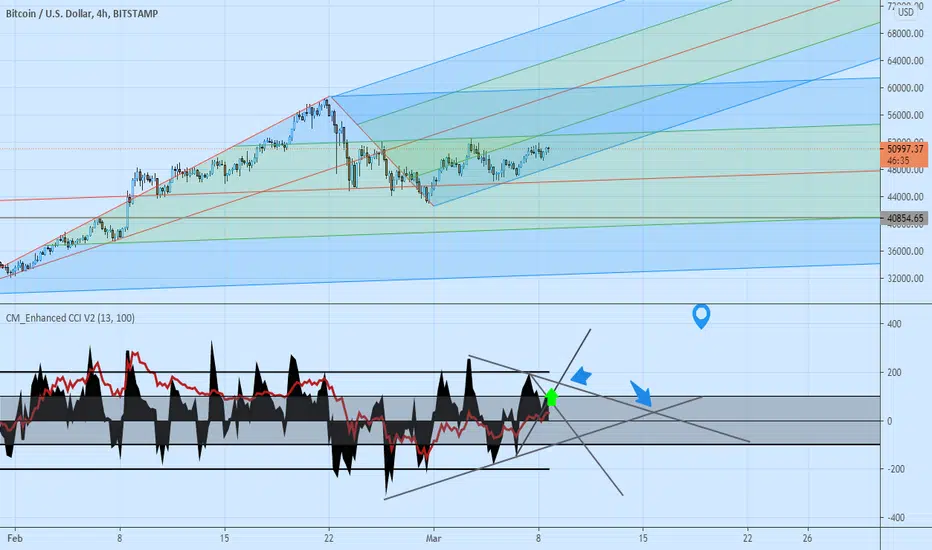
BTCUSD H4 13CCI Triangles Long when tlbTwo 13 CCI triangle apices (apexes?) are above the CCI zeroline, which favors price moving up. The definitive Long would be when CCI crosses up through the downtrendline, at the green arrow
Reversal to short would be when 13 CCI crosses down thru an uptrendline not shown
#XRP Looks to be 3 days from breaking out #XRP daily candles are approaching an apex and likely primed for a move. looking for volume and a trend break

PLUG Ascending TriangleAnalysis: PLUG never ceases to amaze me. Technically, I think this has more to go. It's set up nicely near the apex of an ascending triangle that has been forming for two weeks. Today's candle showed a hammer formation with buyers stepping up end of day to take back control. However, volume has been tapering lately which is a concern. Either side could step up and push this stock.
This has been flirting with the upper resistance level the entire triangle. I'm thinking a small pullback tomorrow to test the 8 EMA. If it breaks resistance at the $28.70 level, I want to see heavy volume lift it past resistance.
Strategy: I've been a PLUG holder for a while now. But I, personally, am going to pick up $30 calls with Friday expiry if this touches into the 8 EMA. There's a good amount of liquidity weighted to the call side. Whole numbers are the hot spot due to its psychological effect. Please note, I am not an advisor. This is my opinion. Leave a comment, though, and tell what me your thoughts!!!

APEX FROZEN FOOD - Ascending Triangle Pattern - Swing TradeThis analysis is purely based on price action and chart pattern.
Another zoomed-in image showing Fibo-Support by price is included here for more understanding.
Analysis is done on daily TF hence it may take several days to couple of weeks to reach its target.
Trade Strategy along with logic is explained in image itself.
Always plan your trade & trade your plan
Keep trailing SL accordingly once entered into the trade.
This analysis is purely for education purpose. Kindly do your own study before entering into any trade .
Feel Free to comment for any query and suggestion.

DOTUSDT Dynamic Resistance|Structural S/R|Apex|Declining VolumeEvening Traders,
Second Analysis – DOTUSDT- trading with the psychology of a Descending Triangle, price is approaching its apex.
Points to consider,
- Bearish Price Action
- Structural S/R Respected
- Key Dynamic Resistance
- Oscillators Below 50
- Declining Volume
DOTUSDT’s immediate price action is bearish with consecutive lower highs under dynamic resistance. Price is being coiled into its apex where a break will be imminent; breaking key structural S/R will allow us to have a bearish bias on the market.
Both oscillators are showing weakness trading under their 50- midpoint, further downside is likely to reach oversold conditions.
The volume profile is currently declining; an influx will be highly probable as price breaks from its Apex.
Overall, in my opinion, breaking bearish will allow for a valid short with define risk. Price action is to be used upon discretion/ management of trade.
Hope this analysis helps
Thank you for following my work!
And remember,
It does not matter how slowly you go as long as you do not stop.”Confucius

DIAUSDT Falling Wedge|Price Action Apex|Swing Low|200MA|.618 FibEvening Traders,
Second Analysis – DIAUSDT- trading in a falling wedge formation where a confirmation will be on a break of dynamic resistance.
Points to consider,
- Price Action Apex
- Market Structure Lower Lows
- Key Dynamic Resistance (.618 Fibonacci Confluence)
- RSI Divergence Forming
DIAUSDT is trading towards its apex in a bullish falling wedge pattern were a confirmation will allow us to have a bullish bias on the market.
The market structure is currently making lower lows on dynamic support, holding this on the next test will increase the probability of a bullish divergence on the RSI.
The volume profile is currently below average, a break of resistance will need increasing volume. This will signal a true breakout, aiding in avoidance of fake outs.
Immediate target is the bearish retest zone which is in confluence with the .618 Fibonacci and market structure. A respect of resistance here is highly probable on the first test.
Overall, in my opinion, DIAUSDT is a valid long once the falling wedge pattern is confirmed. Price action is to be used upon discretion/ management of trade.
Hope this analysis helps
Thank you for following my work!
And remember,
“You will never find fulfillment trading the markets if you don’t learn to appreciate and be satisfied with what you already have.” ― Yvan Byeajee


Crypto Trade Update - ETH and BITCOIN trades and ideas #cryptoMy ETH trade and how am I hunting for another short

$EURJPY Short Trade channel top - countertrend #forex #tradingUse 1/3 or 1/2 normal size since its counter trend go short at market.

BTCUSDT Dynamic Resistance|Bullish Divergence|.618 Fib|PA Evening traders,
Today’s Analysis – BTCUSDT- a probable swing trade, signs of a short term bullish bias as price shows strength, breaking dynamic resistance is a long.
Points to consider,
- PA Demand (.618 Fibonacci Level)
- Dynamic resistance/support converging (Apex)
- 21 MA visual guide
- Oscillators diverging
- Volume below average
BTCUSDT’s price action shows that there is demand below key Fibonacci levels, mainly the .618 level.
This gives us a short term bullish bias on the market as price action shows strength.
The Dynamic resistance and supports are converging; price will have to break out of its apex sometime before 18th July.
The 21 MA can be used as a visual guide for when the breakout occurs, price is likely to trend of it.
Oscillators are both diverging from price; this shows immediate strength in the market, remaining above the 50 level is bullish.
Volume needs to increase upon a breakout, this will help dictate the strength off the move and avoid fake outs.
Overall, in my opinion, BTCUSDT will have a volatile move from its apex. A break of the key dynamic resistance allows for a valid long with defined risk. Any moves are to be backed with increasing volume to avoid fake outs.
What are your thoughts?
Thank you for following my work!
And remember,
“If you don’t respect risk, eventually they’ll carry you out.” – Larry Hite


GOLD XAUUSD in the uptrend approaching breakout resistance #goldBuy the breakout on 1hr closing basis

#Bitcoin 20% move incoming We are approaching apex of the triangle, soon we will have a huge move!! careful with your leverage trades
will post a leverage setup once I see something
#notfinancialadvisor
#DoYourOwnResearch

USDCAD Long Idea - Breakout and Inverted H*S #forex #tradingLong USDCAD in EU Open and close above the neckline.

FOREX STOCKS & CRYPTO - Trading Ideas and Commentary #trading My take on Currencies Stock Market and Crypto

USDMXN anticipating breakout BUY on 1hr/4hr closing basis #forexBuy the breakout once a solid green bar close above the trendline
Check the signature for link to your free telegram group
