Backtest

ICHIMOKU AND RVI BEGINNERS PLAY BOOKNow ichimoku is relatively simple look for buys above the cloud and look for sells under the cloud. so when we backtest that over our 5/5 winners with rvi we get two less entrys, however as a beginner to avoid them whipsaw movements that isnt always a bad thing. The cloud itself offers dynamic support and resistance based of averages. price breaking through the cloud signals a breakout and a change in the trend usually. if new to trading I recommend learning about ichimoku on youtube, its not the all time great plan but if you have no plan its better than that. to keep discipline and entry requirements.

EURGBP (4H) Backtest : 48% win rate across 21 trades => 10 RBacktest results : prnt.sc
Non-looser = 71%
Icons on the chart
Thumbs up : Trade was a win
Thumbs down : Trade was a loss
Circle with a cross : Trade was breakeven
Cross : Did not take the trade due to presence of liquidity (equal highs/lows) behind the stop loss
Variables
Avg winner = 1.6R
Strategy : wait for market structure break, then trade the retest of that zone. Zone is drawn using the first candle which crossed the pivot high/low to trap the traders.

Short- BTI saw the market consolidation and the red MA over the blue so I knew it was going down , I had a little draw down but overall it went exactly how I thought it would

USDMXN (4H) Backtest : 61% win rate across 23 trades => 15.4 RBacktest results : prnt.sc
Icons on the chart
Thumbs up : Trade was a win
Thumbs down : Trade was a loss
Circle with a cross : Trade was breakeven
Cross : Did not take the trade due to presence of liquidity (equal highs/lows) behind the stop loss
Variables
Avg winner = 1.6R
Strategy : wait for market structure break, then trade the retest of that zone. Zone is drawn using the first candle which crossed the pivot high/low to trap the traders.

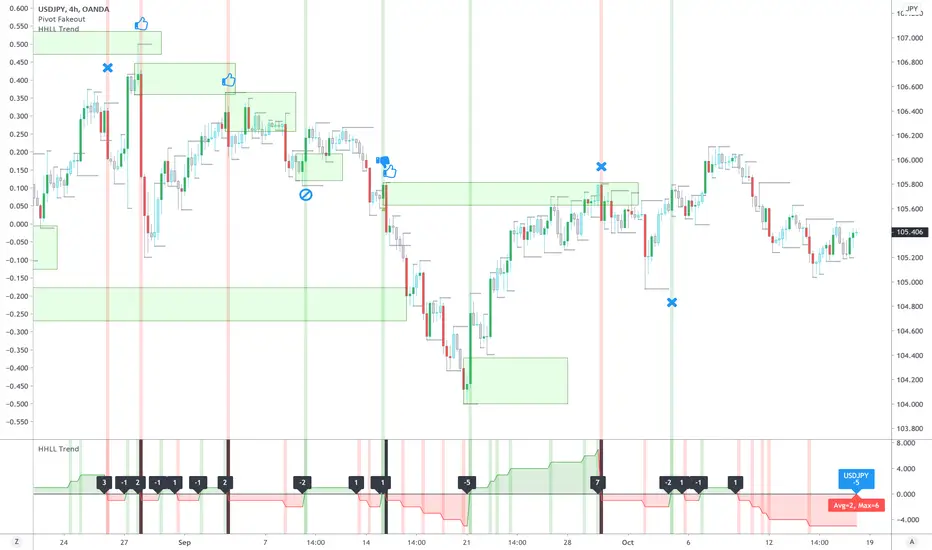
USDJPY (4H) Backtest : 67% win rate across 24 trades => 19.6 RBacktest results : prnt.sc
Icons on the chart
Thumbs up : Trade was a win
Thumbs down : Trade was a loss
Circle with a cross : Trade was breakeven
Cross : Did not take the trade due to presence of liquidity (equal highs/lows) behind the stop loss
Variables
Avg winner = 1.6R
Strategy : wait for market structure break, then trade the retest of that zone. Zone is drawn using the first candle which crossed the pivot high/low to trap the traders.
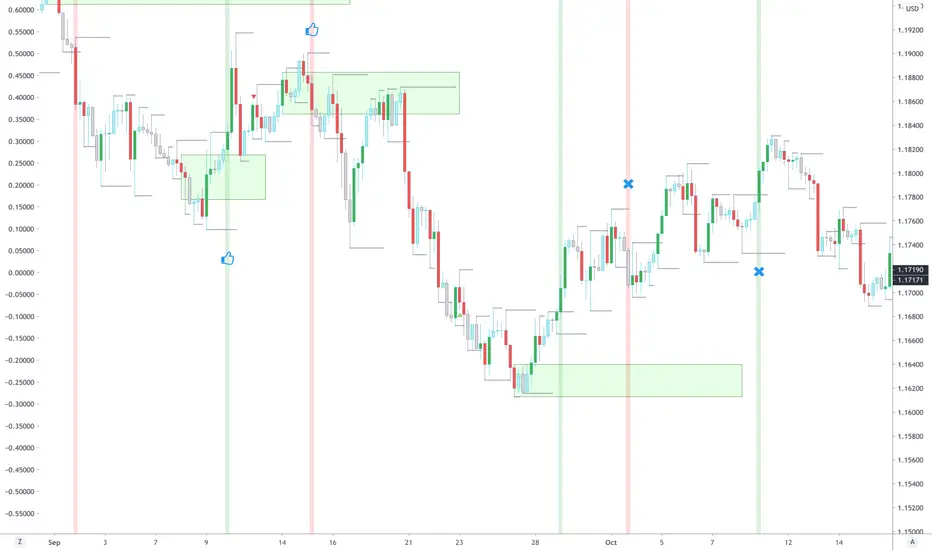
EURUSD (4H) Backtest : 52% win rate across 25 trades => 13.8 RBacktest results : prnt.sc
Icons on the chart
Thumbs up : Trade was a win
Thumbs down : Trade was a loss
Circle with a cross : Trade was breakeven
Cross : Did not take the trade due to presence of liquidity (equal highs/lows) behind the stop loss
Variables
Avg winner = 1.6R
Strategy : wait for market structure break, then trade the retest of that zone. Zone is drawn using the first candle which crossed the pivot high/low to trap the traders.
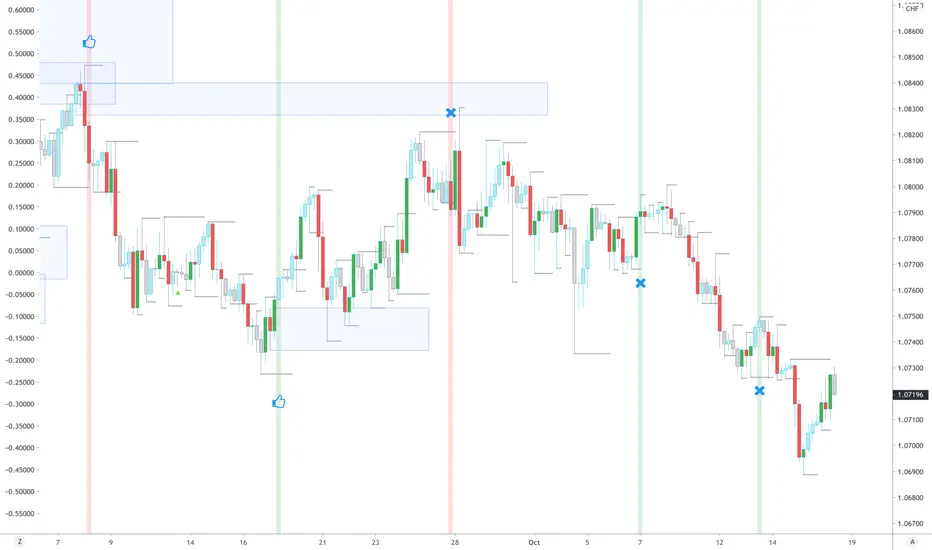
EURCHF (4H) Backtest : 63% win rate across 16 trades => 14 RBacktest results : prnt.sc
Icons on the chart
Thumbs up : Trade was a win
Thumbs down : Trade was a loss
Circle with a cross : Trade was breakeven
Cross : Did not take the trade due to presence of liquidity (equal highs/lows) behind the stop loss
Variables
Avg winner = 1.6R
Strategy : wait for market structure break, then trade the retest of that zone. Zone is drawn using the first candle which crossed the pivot high/low to trap the traders.
NZDUSD (4H) Backtest : 46% win rate across 26 trades => 10.2 RBacktest results : prnt.sc
Icons on the chart
Thumbs up : Trade was a win
Thumbs down : Trade was a loss
Circle with a cross : Trade was breakeven
Cross : Did not take the trade due to presence of liquidity (equal highs) behind the stop loss
Variables
Avg winner = 1.6R
Strategy : wait for market structure break, then trade the retest of that zone. Zone is drawn using the first candle which crossed the pivot high/low to trap the traders.

Emini / ES / SPY (4H) Backtest : 57% win rate across 21 tradesWinners = 12
Losers = 5
Breakevens = 4
Total Trades = 21
% Non Losers = 76%
% Winners = 57%
% Breakevens = 19%
% Losers = 24%
Win/Loss = 240%
Net R = 14.2
Avg R/Winner = 1.18
Avg R/trade = 0.68
Bad trades prevented due to presence of liquidity near SL= 14
Icons on the chart
Thumbs up : Trade was a win
Thumbs down : Trade was a loss
Circle with a cross : Trade was breakeven
Cross : Did not take the trade due to presence of liquidity (equal highs) behind the stop loss
Variables
Avg winner = 1.6R
Strategy : wait for market structure break, then trade the retest of that zone. Zone is drawn using the first candle which crossed the pivot high/low to trap the traders.


NZDUSD (4H) Backtest : Break of market structureWinners = 6
Losers = 5
Breakevens = 2
Total Trades = 13
% Non Losers = 62%
% Winners = 46%
% Breakevens = 15%
% Losers = 38%
Win/Loss = 120%
Net R = 4.6
Avg R/Winner = 0.77
Avg R/trade = 0.35
Bad trades prevented due to presence of liquidity near SL= 20
Icons on the chart
Thumbs up : Trade was a win
Thumbs down : Trade was a loss
Circle with a cross : Trade was breakeven
Cross : Did not take the trade due to presence of liquidity behind the stop loss
Variables
Avg winner = 1.6R
Strategy : wait for market structure break, then trade the retest of that zone (against the trapped traders).

RTY (Russell) (4H) Backtest : Break of market structureWinners = 8
Losers = 3
Breakevens = 2
Total Trades = 13
% Non Losers = 77%
% Winners = 62%
% Breakevens = 15%
% Losers = 23%
Win/Loss = 267%
Net R = 9.8
Avg R/Winner = 1.23
Avg R/trade = 0.75
Bad trades prevented due to presence of liquidity near SL= 26
Icons on the chart
Thumbs up : Trade was a win
Thumbs down : Trade was a loss
Circle with a cross : Trade was breakeven
Cross : Did not take the trade due to presence of liquidity behind the stop loss
Variables
Avg winner = 1.6R
Strategy : wait for market structure break, then trade the retest of that zone (against the trapped traders).


BACKTESTING: AUDJPY price action on the 4H timeframeHere is the Strategy of strong AGRESSIVE initiation and then entry on the pullback from that initiation. The rules for this strategy is that price must pull back at least 50% of the initial move. Entry must be in convergence with at least one more factor, like an RSI divergence, a retest of a major trendline or horizontal level, or break and retests (resistance turned support). This strategy works because agressiveness in the markets tell us where price really wants to go, and entering on the pullback gives us a good Risk to Reward Ratio. simple
4 trades demonstrated with 3RR or more on each. :)

BTCUSD Scalp |H1 Double Bottom|Dynamic Resistance|.618 Fib|RangeEvening Traders,
Today’s analysis – Scalp opportunity on BTC, following are technical points to consider,
- Range low double bottom
- Dynamic Resistance breached
- .618 Fibonacci retest
- 21 MA support
- Range high target
A double bottom deviation back into range shows demand below range support, this is considered bullish.
The Dynamic resistance in confluence with the 21 MA has breached with recent impulse, first time since the down trend. The 21 MA is now considered support – S/R Flip.
A backed test and hold of the .618 Fibonacci is bullish, allowing for a risk defined entry.
Price action immediate target will be range high. It is important to monitor volume to avoid fake outs.
Hope this analysis help!
Thank you for following my work!
And remember,
“Trading effectively is about assessing probabilities, not certainties.” ― Yvan Byeajee

Using the Strategy Tester to Evaluate a StrategyThis video idea explains how to use the strategy tester on TradingView to evaluate the performance of your strategy. We go over all of the data presented for you regarding your strategy, and if we make mistakes along the way you can always check out the TradingView help section that is specifically for the Strategy Tester.
I highlight the overview of your strategy, dive into the details of the performance summary for your strategy, and show how we can review all of our trades including our commission paid.
Finally, we show how changes to the strategy can alter your Strategy Tester results and how accounting for commission(fees) and selective testing windows can alter perceptions on strategies.


Using The Replay Bar To Backtest EURUSDI thought it would be fun to share a backtesting video. Video time is limited so I couldn't get a full session recorded. I know technical analysis is only part of the picture but this is a fun exercise.

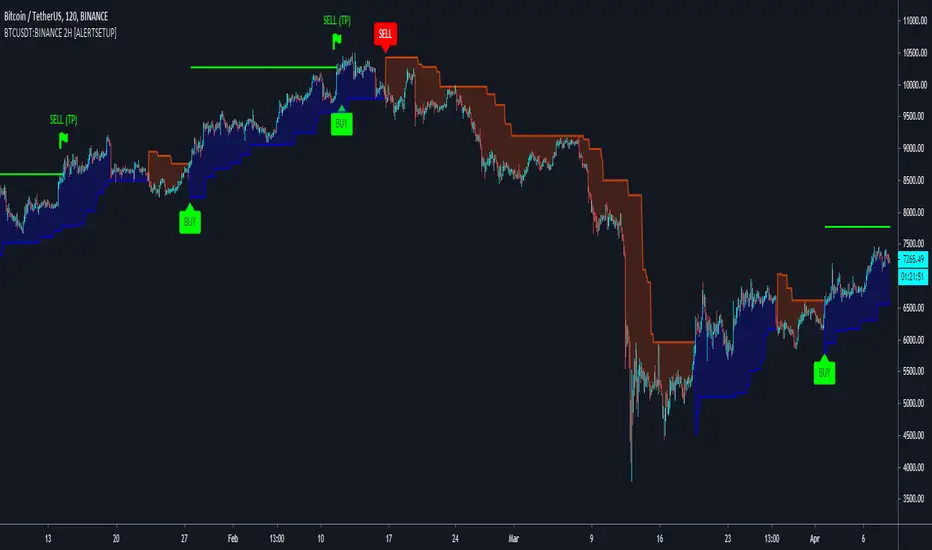
Trading BITCOIN on 2H - My Automated StrategyHi guys,
Today while playing with my strategies I was searching for the best Buy & Sell strategy for trading Bitcoin in 2H. BINANCE:BTCUSDT
Here are the rules:
Only long trades (Entry long + Exit long)
Backtest From 2018-01-01 to today, starting after 2017's bull rally
0.1% commission
10 000 € as initial capital
100% equity as order size
No pyramiding
Goal:
1. Beat Buy & Hold return
2. Get the biggest Net Profit in the backtest results
3. Create a bot with it!
Here is what I found
Base indicator: SuperTrend
Parameters:
ATR multiplier : 12
ATR Lookback : 1
Trade filter: ADX
Timeframe: 2H
Threshold: 14
Take profit: 17%
Why 17% ? In average, a leg up is around 17%. This is what gave the best results.
No stop loss. The SuperTrend makes a very good natural trailing stop loss. We sell when it reverses.
I built an alert setup for this strategy, with simple BUY and SELL signals for those willing to automate and create their own bot. See the indicator link below.
Feel free to share your strategy/idea for trading Bitcoin in 2H!
Thanks for reading.
XRP/USD Swing StrategyHi guys, here is a simple Swing Trading strategy for Ripple BINANCE:XRPUSDT
To trade this strategy manually you will need the SuperTrend indicator, paired with a 25 bars EMA as trend filter.
Set the ATR multiplier to 2 and the lookback to 3 bars.
Filter trades whose ADX on the 1 Day timeframe is below 12.
Backtest results below.
Configuration:
To get the indicator and automate the strategy, use the link below, thanks.
