Dow Jones Here is my thoughts, looks like 16k Dow will be the bottom unless we get an overthrow which is possible.
Bearmarketsignal

We got rejected with a triple top at $8100Maybe we are goimg for another dip at resistance line. Or possibly even better below $7777 for a new 3 Month Low.
Stop Loss : $1830

BTC/USD What Now?Hello Friends , just like previous posts I published. BTC is in a bearish mode and will remain so unless we are able to retest the upper resistance (marked on chart) and have a break through, otherwise BTC is heading south towards LL and LH.
We have a decline in volume since this years ATH and there are several bearish patterns that have formed on various time frames, which point to LL according to what the particular patterns dictate.
1) The largest pattern is the head and shoulders pattern which spans from May 18th to current time frame. H&S tells us that BTC is headed towards $4800.00
2) Next in line is the descending price channel that began June 26th. This channel says that BTC is headed towards $4872.00
3) BTC created it's first bear flag July 12th to July 16th and the following day BTC hit $9071.00
4) Aug 12-17th Bear flag formed yet recovered on the 4hr time frame only to form a larger bear flag on the daily.
5) Bear flag #3 Aug 6th to the 20th on the daily timeframe. This bear flag is looking to go as low as $7500.00 if BTC losses it momentum.
I would stay out of this trade just to see what happens. If BTC breaks the resistance within the flag, then that is a sign of another failed bear flag and a good opportunity to secure profits. However, if BTC closes below the support line within the flag then we will see a big move downward to the size of the flag and then possibly the size of the pole.
Details on the Chart.
This is my viewpoint and my opinion. I am not giving advice but only sharing what I see. Do not enter a trade on my TA but do your own homework.
Cryptocurrency is volatile and very risky. Never invest what you can't afford to lose and always educate yourself and continue to do so when making any kind of investment.
If you find this information helpful, then please hit the like button. Your support is appreciated. Thank you!
CYA on the next one...until then, the trend is your friend. Buying on the dip and selling on the hype.
Cheers!

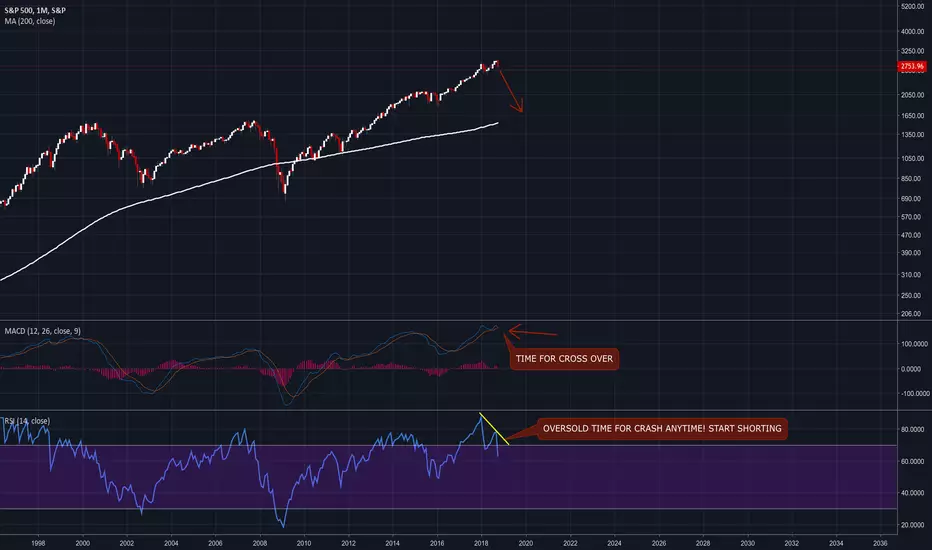
200 DMA Failure Confirms Bear MarketNow that the indexes have broken out of the last major down channel (drawn in blue), the 200 day moving average (in purple) is the next major resistance. The S&P 500 has failed to hold above the 200 DMA three times since Oct 2018. Holding above the 200 DMA is the real test of being in a bull market or not--bull markets hold over the 200 DMA for extended periods while bear markets are rejected at the 200 DMA. Having another major market turn at the 200 DMA, (especially without having retested Dec lows or even built any significant resistance points on the way up) is going to look very BAD in my opinion. But the market is so over extended now I don't see how it can rally over the 200 day MA and hold.
So the market moves up, whistling bullishly, oblivious to the bear market confirmation it has primed itself for. This rally has been impossible to short, but going long now would be similarly doomed. So short at the next break under the 200 day MA, and watch as the market collapses.

In FED we trust ... Amen.Credit markets have gone crazy... history repeats itself. Look at this insane surge for the junk bond market.

Are we headed on a 10 year BEAR market?Germany the 4th largest economy is about to go into a recession, UK collapsing on the face of the Brexit, France government at the edge of destruction, Italy is bankrupt, Greece is bankrupt, China could very well be in a recession as we speak, Venezuela is in turmoil, Honduras, Guatemala, Argentina and many other south American countries are bankrupt. The USA now showing signs of a weak economy. Is this the beginning of the next 10 year bear market?

Stocks Enter Danger Zone: Will Trump's Wall Work?I have been watching the Dow Jones since we saw that 4,000 point drop. Ever since, we have been in a sideways range. Yesterday we broke the floor on that range in a negative way.
Normally this would be a negative signal for stocks, but I think Trump's "Border Wall" move could reverse things from here so he can keep his precious stock market gains until reelection in 2020.
Don't be freaked out by this move quite yet. Let's see how things go on Friday and Monday morning.
Steemit Article
Youtube

Short $ETSY swing play $55 to $46ish area. This play and the reasoning should be pretty self explanatory, zoomed the chart out so you can see how far back I look before taking a trade. The play is from the Red sell rectangle to the Green support rectangle, and start looking to abort the trade at new highs with high volume and/or any random bullish news. Looks like it's at resistance and almost all the oscillators are overextended on the daily timeframe, with VFI clearly moving downward. If this play works out the way I'm thinking I'd be looking to short the next bounce.

When will the FTSE 100 be in a Bear market?Looking for when the FTSE 100 may enter a Bear Market. Despite the media saying a 20% drop is a signal for a Bear market, the real number is 16%.
Taking a measurement of 16% from the previous high in the summer of 2018 and a 16% drop comes to around 6442.
If price drops below this mark, (red dash line) this could signal the Bears are in full control.
Taking a measurement (purple line)from how far the FTSE dropped in the last recession and price could move to around the 4800 mark.

Economic reccesion is most likely already upon usHello,
I've compiled a few charts I've posted in the past year warning about the economic reality of the times we're in now. My predictions we're pretty accurate up to this point, and I see no reason for it to change. Contrary the evidence for an imminent reccesion only keeps piling up. The front end of the yield curve has started to invert with the 2 year yield already higher than the 5 year. Oil declined more than 30%, banks declined more than 20%, the dollar is still standing because guess where everyone is going when they're selling out. Also on the technical side of things. Both the TSI and MACD have now broken trough the signal line. Mind you these are slowed down indicators to remove the noise, and everytime time these slowed down indicators crossed their signal lines they never went back up before going down to oversold levels. Both indicators have also crossed in the Russell 2000 index.
All this makes me strongly believe that a reccesion has most likely already started. We may just get another slightly higher new high, but I doubt that it will happen.

SPY Complex Correction In ProgressWe thought the downdraft in October marked "ABC" on chart was the correction. But... We got another pivot at the .62 Fibo, where B turned, now X turned again.
Looks like we got a larger WXY wave. ABC was the W that formed first bottom. If this pattern completes, expect -33 on the ABC leg to approximate the X-Y leg.
This would put Sand P down around 252. For starters. Let's see how it plays. In my humble opine, we are entering bear market, started 4 October. Sorry!
This isn't advice, it's a half-baked idea, trade at your own risk and good luck!

AUDCADAUDCAD simply trading within the 4H channel and it is proceeding to form lower highs, lets see how it unfolds

Japanese Index - Future ProjectionI've finally found a correlation with every stock index and came up with my hypothesis of how this stock market will crash.

I figured out the Stock Market Future ProjectionI finally cracked the projection of where the stock market is heading with the China Vs USA trade war.

DJIA has the next crash started?Big bearish divergence on the weekly, same thing happened before the 2008 crash.
If you've been reading news and digging in, the whole bull market since 2008 has been artificially pumped up through fiat creation, and it's a house of cards waiting to implode. Totally unsustainable.
This may or may not be the start of the crash, but the crash is coming. Be prepared.
Disclaimer: not financial advice

BNB is loooose! (But must be watched carefully to enter now)Grab the surf boards, ride those elliot waves to success. After a very predictable consolidation on the 4hr, BNB broke out nicely. Now we can try and anticipate it's short to medium term future. BNB at a couple of resistance lines on the BTC/USD chart.....the dormant volcano will blow. In my opinion BNB is one of the most predictable and reliable to chart. It has easily readable patterns that it seems to follow. I am going to target those particular sells and buys. I am optimistic that (with a little help from btc 7800) that BNB will achieve its goals.
Even if BTC acts up, BNB is stronger than most others because it has more perceived value than the majority of other alts.
xoxo
GoldenParachute
Good luck. This is educational idea and definitely not financial advise.

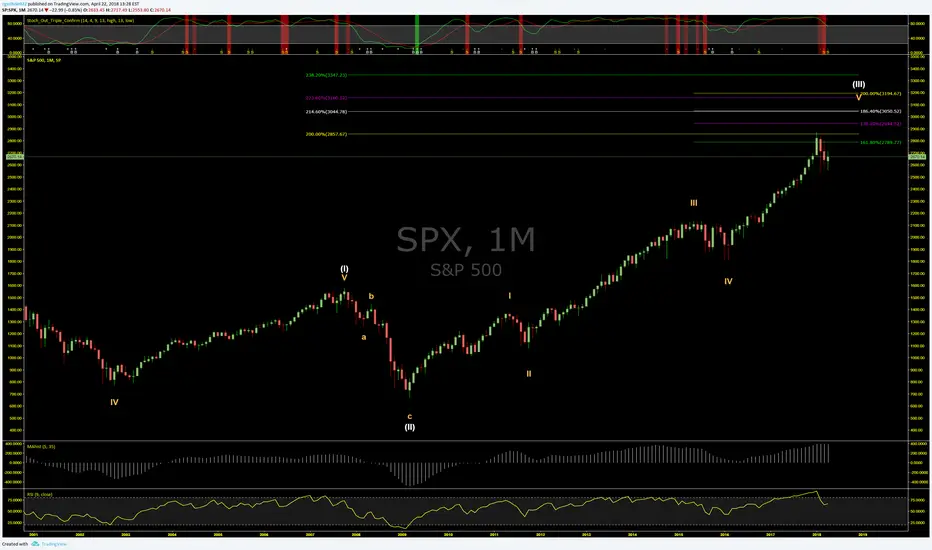
My Elliott Wave Analysis Found Next Major Market TopBased on my analysis of the Elliott wave that began around 1993, we are coming to the top of the third SuperCycle wave. SyperCycle Wave 1 ended with the market top in 2007 prior to the popping of the housing bubble. SyperCycle Wave 2 ended at the bottom in 2009 and we have been in SyperCycle Wave 3 ever since.
I project the market top to occur between November 1 and December 31 this year (2018). The good news is my projected level is 18% higher than where we are now. My market top for the S & P 500 is between 3160.12 and 3194.67. Based on this timeframe, I wonder if the real world catalyst rekates to the North Korean peninsula matters, surprise in 2018 mid-term elections or some other event.
I encourage other Wave Analysts to share your thoughts.