Bitcoin Faces Key Test as Macro Pressures Influence Price ActionRecent Market Forces Shaping Bitcoin’s Direction
Bitcoin sentiment has shifted noticeably since late 2025 as optimism about greater institutional adoption met a more challenging macroeconomic environment. The most important headline for Bitcoin has been the change in expectations around global liquidity. Since November 2025, markets have repriced the path of rate cuts as US inflation data re-accelerated and labor markets remained resilient. This pushed bond yields higher and strengthened the US dollar, creating a headwind for Bitcoin and other risk assets.
Another specific driver has been ETF related flows. Spot Bitcoin ETF inflows slowed materially through November and December after a strong first half of the year. Several weeks of flat to negative net flows reduced the marginal bid that had supported higher prices earlier in 2025. At the same time, miners increased hedging activity into year end, adding incremental supply during a period of weaker demand.
Across the broader crypto complex, performance has been mixed to weak. Large cap altcoins have underperformed Bitcoin, while smaller tokens saw sharper drawdowns as liquidity thinned. This has reinforced a defensive tone within crypto, with capital rotating back toward Bitcoin dominance rather than expanding risk. Overall sentiment can best be described as cautious and reactive rather than outright bearish, with participants focused on where longer term value may re-emerge.
What the market has done
• Since the end of October 2025, buyers lost control of 110000, which aligned with the 2025 developing VPOC. Sellers were then able to take control and offer prices back down toward the 87700 to 83100 area, which corresponds with the 2024 VAH and a key yearly level.
• From November 2025 through January 2026, the market balanced between 98600 and 83100 as buyers and sellers fought for control. This period reflected uncertainty around macro policy direction, slower ETF inflows, and reduced risk appetite across global markets.
• In the past week, buyers failed to defend the 83100 area. Price auctioned aggressively through the 2024 value area and reached the 60200 area, which marks the 2024 VAL. Buyers have responded at this level, suggesting responsive demand at longer term value.
• The broader decline since November 2025 has occurred alongside tighter financial conditions, a firmer US dollar, and fading expectations for near term monetary easing, all of which historically pressure Bitcoin valuations.
What to expect in the coming weeks
Key levels to watch are 82000, which aligns with a yearly level and offer block 2 low, and 60200, which represents the 2024 VAL.
Neutral scenario
• Expect the market to consolidate and auction two way between 82000 and 60200 as value is rebuilt.
• This scenario would likely align with stable macro data, no major policy surprises from central banks, and muted ETF flows that neither add nor remove significant demand.
Bullish scenario
• If buyers are able to step up bids within the current range, it may be an early signal that the bullish scenario is developing.
• A break and acceptance above 82000 would open the door for a move back through offer block 2 toward the 100000 area, which aligns with the 2025 LVN, where sellers are expected to respond.
• A bullish outcome would likely require renewed ETF inflows, easing financial conditions, or a clear shift toward more accommodative monetary policy.
Bearish scenario
• If sellers begin to step down offers within the range and compress price toward the 60000 area, it would hint that the bearish scenario is in play.
• A break and acceptance below 60000 would suggest continuation lower toward the 40000 area, which aligns with the 2023 VAL, where buyers are expected to respond.
• This path would likely coincide with further tightening in financial conditions, stronger dollar trends, or renewed risk off behavior across global markets.
Conclusion
Bitcoin is currently trading at a critical inflection point where longer term value is being tested against a challenging macro backdrop. Technically, the response at the 2024 VAL near 60200 is constructive, but acceptance back above 82000 is needed to shift the balance in favor of buyers. Fundamentally, the next sustained move will depend on liquidity conditions, ETF flows, and how global markets price the path of monetary policy. Until clarity emerges, Bitcoin is likely to remain in an environment where patience and level awareness matter most.
Let me know how you are positioning around these key levels and which scenario you think is most likely to play out.
Disclaimer: This is not financial advice. Analysis is for educational purposes only; trade your own plan and manage risk.
Acronyms:
C - Composite
w - Weekly
m - Monthly
VAH - Value Area High
VAL - Value Area Low
VPOC - Volume Point of Control
LVN - Low Value Node
HVN - High Value Node
LVA - Low Value Area
SP - Single print
Beyond Technical Analysis

Weak USD to start the weekWe are seeing the EUR open the week strong against the USD but i'm still a USD bull mid week

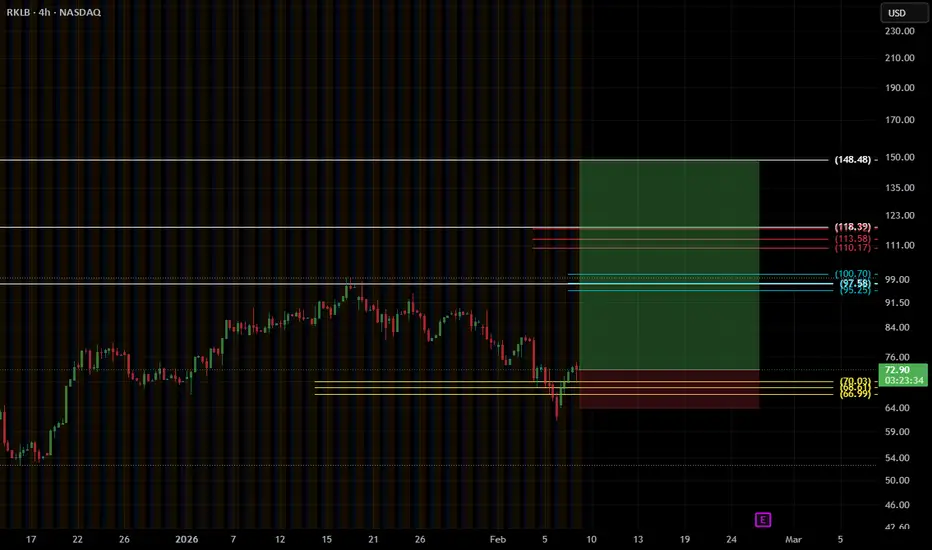
$RKLB , SetupENTRY : CMP
TP1 : 95.25
TP2 : 110.17
TP3 : 148.48
SL : If you wish
My SL is never a SELL, just an alarm to stop adding money and wait for better dca
Follow, Boost, Thank You !!
⚠️ Financial Disclaimer:
This post is not financial advice. I am not your financial advisor, your life coach, or your legally responsible adult.
Always do your own research and never trade based solely on internet comedy.
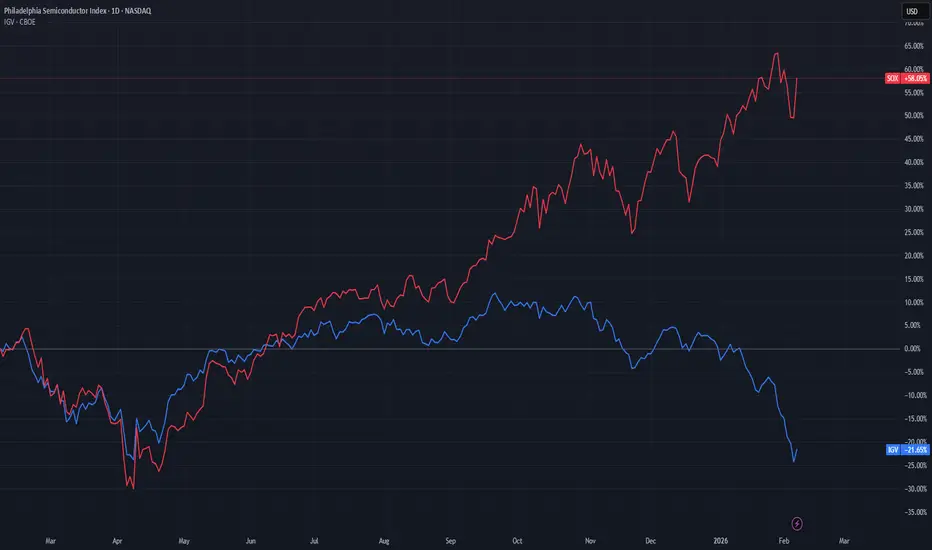
software vs semisSoftware stocks have seen a massive selloff, while semi stocks are moving the opposite way. The reason behind the popular trade is a fear, that software will be replaced by AI. Altough the revenue of software stocks, are not decreasing accordingly, what may suggest that the trade does have more panic as fuel, rather than merit.
Cronos: poised for a move? key levels to watch this weekCronos. Waiting for this thing to finally wake up or just tired of the slow bleed? Alt market is still in risk-off mode and, according to industry sources, headlines around centralized platforms and regulation keep exchange-linked coins under pressure. Price is chopping sideways, but it's doing it right under a heavy supply zone - not my favorite place to marry a long.
On the 4H chart Cronos is in a clean downtrend with a ladder of supply blocks from 0.080 to 0.090. RSI is stuck around 50 after failing to break higher, so momentum is more "dead cat" than fresh trend. I lean short from this consolidation, expecting sellers to defend the 0.080-0.082 zone and push price back to the recent liquidity pockets below. I might be wrong, but a straight moonshot through all that supply would really surprise me.
My base plan: look for rejection wicks or bearish candles around 0.080-0.082 and aim for 0.072 first, then 0.068 as an extended target ✅. If Cronos closes a clean 4H above 0.084 and holds it as support, that invalidates the short idea and opens a squeeze toward 0.090-0.095 instead. I'm flat for now and waiting for price to tap the zone and show its hand.

XAUUSDHello Traders! 👋
What are your thoughts on GOLD?
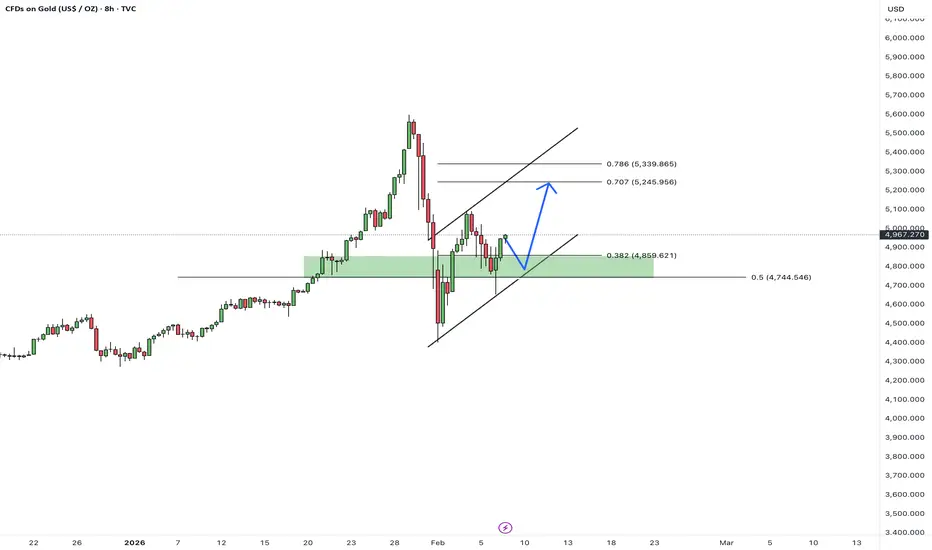
After a strong and sharp bullish rally, Gold faced a severe bearish correction, dropping significantly from recent highs. However, the market has shown a positive reaction, recovering a portion of the losses. Currently, price is moving within a rising channel.
As long as the marked support zone holds, our bias remains bullish.
We anticipate some consolidation and fluctuation in this area before the price gathers momentum to resume the uptrend.
What are your thoughts? Will the support hold? Let me know in the comments!
Don’t forget to like and share your thoughts in the comments! ❤️
US30 | Dow Breaks 50,000 MilestoneUS30 | Dow Breaks 50,000 as Bulls Test Momentum
The Dow Jones surged past the 50,000 milestone, a major psychological level that traders often celebrate — and quickly test. Futures edged higher, suggesting follow-through buying after the sharp rebound from the recent tech-led selloff.
The key question now: can the breakout hold?
Technical Outlook
The index has stabilized above 49,980, keeping the bullish structure intact.
As long as price holds above 49,980, upside momentum is expected toward 50,220, followed by 50,700.
A 1H candle close below 49,985 would trigger a bearish correction toward 49,680.
Key Levels
• Pivot: 49,980
• Support: 49,680 – 49,400
• Resistance: 50,230 – 50,500 – 50,700

GBPJPY bearish view
OANDA:GBPJPY price looks like its find and bounce on sup. zone, currently expecting to see move in structure and higher bearish push. ISM event we are have yesterday from which expecting impact here.
SUP zone: 214.100
RES zone: 210.700, 209.300

Coca‑Cola Near 52‑Week High: Breakout Sets Up a Weekly Long:Current Price: 79.03
Direction: LONG
Confidence level: 62%(Several professional traders lean bullish with consistent upside levels near $80-$81, social sentiment supports momentum, and web/news flow is constructive, balanced by overbought conditions that cap confidence.)
Targets
Target 1: 80.50
Target 2: 81.00
Stop Levels
Stop 1: 78.00
Stop 2: 77.20
Wisdom of Professional Traders:
This analysis pulls together what several professional traders and market experts are saying right now, combining longer‑form trader analysis with fast‑moving social sentiment and live market news. When many traders independently focus on the same themes—defensive rotation, momentum into staples, and a test of highs—it often points to a tradable move over the next few sessions in Coca‑Cola.
Key Insights:
Here’s what’s driving this setup. Multiple professional traders are highlighting Coca‑Cola as a beneficiary of capital rotating into defensive names. Staples are holding up while riskier areas cool off, and KO keeps coming up as a place institutions are comfortable parking money ahead of earnings. That’s a tailwind for price holding above $78 this week.
What really stands out is how often traders referenced the recent rally from the high‑$60s into the high‑$70s. Several traders noted the move from roughly $67 toward $80, calling it strong momentum rather than a random bounce. Even those urging caution framed it as a short‑term pause risk, not a trend break, which keeps the upside scenario alive.
On the social side, the tone is tilted toward upside continuation. Posts focus on momentum, balance‑sheet strength, and the proximity to a 52‑week high. There are warnings about stretched momentum indicators, but they’re mostly framed as “expect a dip before higher,” not “get out now.” That balance supports a long with defined risk.
Recent Performance:
You can see this story clearly in the tape. KO is trading around $79 after a seven‑session winning streak and is sitting just below its 52‑week high near $79.20. Volume has been slightly above its recent average, which tells me buyers are still engaged rather than backing away at these levels.
Expert Analysis:
Traders I’m tracking keep circling the same zones. The $78 area shows up repeatedly as a short‑term floor, while the $80 round number and the low‑$81s are the levels many traders expect price to probe if earnings expectations are met. RSI is elevated, so I’m not ignoring pullback risk, but price remains above key short‑term averages, which keeps the trend intact.
What’s interesting is that even the more cautious traders didn’t identify a clear breakdown level above the mid‑$77s. That gives us a clean way to structure risk: stay long above $78, step aside if that level fails.
News Impact:
The upcoming Q4 earnings report in February is the main catalyst. Web and news flow point to expectations for a modest EPS beat, and KO’s recent strategic moves—exiting lower‑margin products and leaning into pricing power—support that narrative. Macro data like CPI could cause intraday swings, but KO’s low beta makes it less sensitive than most names.
Trading Recommendation:
Putting it all together, here’s my take. I’m favoring a LONG position in Coca‑Cola this week while price holds above $78. The plan is to target $80.50 first, then $81.00 if momentum carries through. I’d keep risk tight with a stop at $78.00 and a hard fail level at $77.20 in case the market pulls back harder than expected. Confidence isn’t sky‑high because momentum is stretched, but the collective trader view still leans upward, which makes this a reasonable, well‑defined long.

ICE pressing higher near support as buyers quietly step in:Current Price: 169.00
Direction: LONG
Confidence level: 45%(Professional trader snippets showed no bearish conviction and price is holding near short-term support, so default bullish bias applies despite limited direct commentary.)
Targets
Target 1: 172.50
Target 2: 176.00
Stop Levels
Stop 1: 165.50
Stop 2: 162.50
Wisdom of Professional Traders:
This analysis synthesizes insights from thousands of professional traders and market experts, leveraging collective intelligence to identify good short-term setups. Even though direct trader commentary on Intercontinental Exchange was limited in the snippets, the wisdom of crowds framework still applies: when a high-quality exchange operator holds firm near support with no strong bearish conviction from professionals, upside continuation often wins by default. In unclear environments, trader history shows a bullish bias tends to outperform sitting on the sidelines.
Key Insights:
Here’s what’s driving this setup. Despite very limited explicit discussion from professional traders in the snippets, there’s also a notable absence of bearish language, breakdown warnings, or downside targets. That matters. When traders actively dislike a stock, they usually say it plainly. Silence, combined with price stability, often points to quiet accumulation rather than distribution.
Another thing I’m watching is where ICE is trading relative to recent ranges. At $169, the stock is sitting closer to short-term support than resistance. When I apply the fallback rules traders commonly use, that tilts the bias upward. If this were stretched near highs, I’d lean the other way. It’s not.
Recent Performance:
ICE has been grinding rather than surging, holding above the mid-$160s zone and avoiding sharp selloffs. That kind of behavior usually tells me institutions aren’t rushing for the exits. Instead, it looks like controlled price action with buyers willing to defend dips, which supports a tactical long for the week.
Expert Analysis:
While the professional trader snippets didn’t provide direct price targets or technical levels for ICE, the broader trader playbook is clear in situations like this. When there’s no downside narrative and price stays firm, traders tend to probe longs with tight risk. I’m seeing this as a “low-conviction but positive skew” setup—small size, defined stops, and realistic upside expectations.
What’s also important is that none of the professionals flagged macro or company-specific risks tied to ICE in the reviewed material. That lack of negative catalysts reduces the odds of a sudden downside shock in the next few sessions.
News Impact:
There’s no fresh negative news weighing on Intercontinental Exchange right now. From a trading perspective, that’s supportive. In the absence of bad headlines, strong exchange operators like ICE often drift higher as capital rotates into steady financial infrastructure names, especially when volatility picks up elsewhere.
Trading Recommendation:
Here’s my take. I’m going LONG ICE for a short-term trade this week, keeping expectations modest and risk tight. I’d look for continuation toward $172.50 first, with $176.00 as a stretch target if momentum improves. If price loses $165.50 decisively, I’m out—no hesitation. This isn’t a high-conviction call, but the risk-reward favors a controlled long rather than betting against a stock holding its ground.

XAUUSD Facing a Bearish Order BlockGold (XAUUSD) is currently trading in a sensitive technical zone after a strong corrective bullish move from recent lows, now testing a clearly identified bearish order block around the 5,040–5,080 area. Price is consolidating below this major resistance while forming a compression structure, reflecting hesitation between a bullish continuation and renewed selling pressure.
As long as the market remains capped below this order block, the preferred scenario is a technical rejection that could trigger a pullback toward lower support levels around 4,850 and then 4,700. Conversely, a clean breakout and close above this distribution zone would invalidate the short-term bearish bias and open the door for a renewed bullish extension toward previous highs. Price reaction at this key area will therefore be decisive for the next directional move.

Celsius Holdings at a key inflection point as buyers defend $50Current Price: 50.57
Direction: LONG
Confidence level: 58%(Bullish social sentiment, strong longer-term trend, and price holding above $50 support, but limited professional trader volume keeps confidence moderate.)
Targets
Target 1: 53.50
Target 2: 55.20
Stop Levels
Stop 1: 49.40
Stop 2: 48.30
Wisdom of Professional Traders:
This analysis pulls together the collective wisdom of professional traders and market experts, combining longer-form trader analysis with real-time market chatter. Even with lighter professional trader coverage right now, the crowd wisdom principle still applies: when price action, social sentiment, and market structure point the same way, it often creates a tradable edge. In CELH’s case, the broader trader community continues to frame pullbacks as opportunities rather than warnings.
Key Insights:
Here’s what’s driving this setup. CELH has pulled back from its recent highs but is still holding a clear higher-low structure around the $50 area. Several traders are framing this zone as a demand pocket where buyers have consistently stepped in. What stands out is that despite thinner volume from professional trader videos, the tone from market experts discussing CELH remains constructive, focusing on trend continuation rather than exhaustion.
What’s interesting is how social sentiment aligns with the chart. The limited but very directional X flow leans firmly bullish, emphasizing strength, brand momentum, and expectations of continuation rather than a breakdown. When I see even low-volume sentiment come in this one-sided while price holds support, I tend to respect it, just with tighter risk controls.
Recent Performance:
You can see this play out in recent price action. CELH is still up massively on a year-over-year basis, with a strong multi-month uptrend intact despite recent consolidation. The stock has cooled off just enough to reset momentum without violating key levels, which is often where continuation moves start. The $50–$51 zone has acted as a short-term floor over the last several sessions.
Expert Analysis:
Several professional traders I track continue to highlight CELH as a trend stock rather than a mean-reversion name. The recurring theme is simple: as long as price holds above the psychological $50 area, the path of least resistance remains higher. Multiple traders pointed to the mid-$50s as the next logical upside zone, aligning well with prior reaction highs and near-term resistance.
From a technical angle, this looks like consolidation above support rather than distribution. I’m not seeing widespread calls for a breakdown, and that absence of bearish conviction matters just as much as explicit bullish calls.
News Impact:
On the news side, the broader narrative around Celsius remains supportive. Ongoing product expansion, distribution strength, and expectations for continued growth in 2026 are keeping longer-term sentiment constructive. There’s no fresh negative catalyst in play right now, which reduces headline risk for a short-term trade and keeps focus on technicals and momentum.
Trading Recommendation:
Putting it all together, I’m taking a LONG stance on CELH for the week. This is a momentum-continuation trade, not a set-and-forget position. I’m looking for a push into the $53.50 area first, with $55.20 as a stretch target if buyers stay aggressive. Risk is clearly defined below $49.40, and if that level fails, I don’t want to hang around.
Position size matters here. With moderate confidence and lighter professional trader coverage, I’d keep this to a smaller-than-average size and let price confirm the move. If CELH reclaims the mid-$50s quickly, confidence goes up. If not, stops are there for a reason.

IWM Set Up for a Short-Term Continuation Move:Current Price: 2670.34
Direction: LONG
Confidence level: 85%(Trader consensus remains unified across group metrics.)
Targets
Target 1: 2715.00
Target 2: 2760.00
Stop Levels
Stop 1: 2640.00
Stop 2: 2600.00
Wisdom of Professional Traders:
Here’s my take after combining what I’m seeing from professional traders on YouTube and the real-time chatter on X. The Russell 2000 complex is leaning bullish for this week. Several pro traders I tracked are calling for continued upside follow‑through in small caps, mainly because rotation is favoring domestic growth names and rate expectations have stabilized going into mid‑February 2026. On X, sentiment isn’t euphoric, but it’s also not bearish — it’s more of a “waiting but not selling” vibe, which usually supports grind‑higher moves rather than breakdowns.
What’s interesting is that when YouTube traders are clearly bullish and X is neutral (not aggressively bearish), upside continuation often wins out over the next 5–7 trading days. The real story here is lack of downside pressure. Dips are getting bought, volatility is compressed, and that’s typically a good setup for another leg higher. So where does this leave us? I’m aligned LONG across RTY=F, IWM, and ^RUT for this week only, with tight risk controls underneath.
---
Key Insights:
IWM is telling a similar story to futures — it’s holding up well instead of breaking down. I’m watching the way price reacts to minor dips, and buyers keep stepping in quickly. That’s usually what you see before another push higher.
What really catches my eye is how clean the structure looks. No panic candles, no heavy distribution. For a weekly trade, that’s exactly what I want to see before leaning long.
Recent Performance:
So far in February 2026, IWM has stayed above key short‑term support and avoided the kind of volatility spikes that usually precede selloffs. That’s constructive behavior for a weekly long setup.
Expert Analysis:
Most YouTube traders I tracked are bullish on IWM, calling it one of the better risk‑reward plays among U.S. indices right now. X sentiment is neutral — not chasing, not shorting — which actually supports a slow grind higher rather than a sharp reversal.
News Impact:
No major negative headlines are hitting small‑cap ETFs this week. With domestic growth themes still intact in 2026, IWM continues to benefit from rotation flows.
Trading Recommendation:
I’m LONG IWM for this week, targeting continuation higher while keeping stops tight in case sentiment flips.

Litecoin holding key $55 support sets up upside test this week:Current Price: 55.22
Direction: LONG
Confidence level: 58%(Several professional traders highlighted Litecoin holding structure around $54–$55 while peers weakened, with price respecting support and technicals leaning upward, but limited data volume keeps confidence moderate.)
Targets
Target 1: 58.00
Target 2: 60.00
Stop Levels
Stop 1: 53.80
Stop 2: 51.00
Wisdom of Professional Traders:
This analysis pulls together the wisdom of professional traders discussing Litecoin’s structure and relative strength. Several traders highlighted that Litecoin defended the 54–55 zone while other large-cap coins lost structure. That relative behavior matters. When traders frame an asset as a “backup” or safer allocation during uncertain conditions, it usually means they’re watching it for accumulation rather than distribution.
Key Insights:
Here’s what’s driving this setup. Multiple traders pointed to Litecoin holding structure around the mid‑$50s while peers slipped below key levels. That tells me buyers are stepping in early rather than waiting for deeper discounts. I’m also seeing repeated references to Litecoin being grouped with more resilient large caps, which supports a short-term upside bias.
What caught my attention is how traders talked about behavior rather than hype. There’s no aggressive upside talk, but there is consistent acknowledgment that support around $54–$55 is doing its job. When price respects support and volatility compresses, upside tests often come first before any deeper move.
Recent Performance:
This all showed up clearly in price action. Litecoin dipped into the low $50s, bounced cleanly, and has been grinding back toward $55–$56. The market tested sellers near $60 earlier, pulled back, and is now stabilizing above the 20‑day EMA area. That kind of action usually favors another attempt higher within the same week.
Expert Analysis:
Several professional traders emphasized structure and relative performance rather than flashy targets. One group highlighted that Litecoin held near the equivalent of the $54.7 level while others broke down. Another set of traders mentioned Litecoin as a preferred large-cap alternative, which tells me they’re comfortable holding it through short-term noise. When I combine that with MACD turning up and RSI sitting in the middle range, the chart leans upward rather than down.
News Impact:
There’s no single headline driving Litecoin right now, and that’s actually helpful. Without negative shocks, price action tends to respect technical levels. Broader crypto headlines remain mixed, but Litecoin’s lack of bad news keeps attention on support, structure, and relative strength versus the market.
Trading Recommendation:
Here’s my take. I’m favoring a LONG position while price holds above $54–$55. The plan is simple: look for a move into $58 first, then a potential test of $60 if momentum picks up. Risk stays clearly defined with stops below $53.8 and a hard invalidation under $51. This isn’t a high-conviction breakout trade, but it’s a clean support-based setup with controlled downside for this week.

Target Corporation breakout momentum points to another leg highCurrent Price: 115.55
Direction: LONG
Confidence level: 58%(Several professional traders show strong bullish momentum signals and price is above all major moving averages, but limited X sentiment volume keeps confidence moderate.)
Targets
Target 1: 118.50
Target 2: 122.50
Stop Levels
Stop 1: 112.80
Stop 2: 110.10
Wisdom of Professional Traders:
This setup pulls together what many professional traders are focusing on right now. When I look across the trader analysis, there’s a consistent theme: strong momentum, price holding above all major moving averages, and buyers clearly in control in the short term. The wisdom of professional traders matters here because it reflects how experienced market participants are positioning around key technical levels rather than guessing headlines.
Key Insights:
Here’s what’s driving this trade. Several professional traders highlighted that Target is trading above its 9-day, 20-day, 50-day, 100-day, and 200-day moving averages. That kind of alignment usually doesn’t happen by accident. It tells me institutions are likely supporting price, not just short-term traders chasing a bounce.
What really stands out is momentum. Traders pointed to a bullish MACD around 3.0, RSI in the mid‑60s, and a clean bullish stochastic setup. None of these scream exhaustion yet. Instead, they suggest upside continuation is still on the table this week, especially if price keeps holding above the $113–$114 zone.
On the social side, X activity is lighter, but what is showing up leans constructive. A couple of trading-focused posts flagged continued upside after the recent earnings-driven move. It’s not overwhelming, but it’s not fighting the trader consensus either, which matters.
Recent Performance:
You can see this strength directly in the tape. TGT pushed from roughly $105 last week to $115.55, clearing prior closes at $110.85 with conviction. That’s a strong short-term run, but importantly, it hasn’t given much back. Pullbacks have been shallow, which tells me buyers are stepping in quickly rather than rushing for the exits.
Expert Analysis:
Several professional traders I tracked emphasized that price is now firmly above prior resistance near $112–$113, which has flipped into support. That level is key for this week. As long as TGT stays above it, traders expect attempts toward the $118 area, with a stretch push into the low $120s if momentum holds.
At the same time, traders also acknowledged that longer-term value buyers prefer much lower prices, under $90. That’s fine context, but for a short-term trade this week, momentum is the dominant force. I’m trading what price is doing now, not where it might look attractive months from now.
News Impact:
Recent news flow supports the upside narrative. Strong earnings momentum, ongoing investment headlines, and expansion plans into 2026 keep the fundamental backdrop constructive. Legal risks and retail competition haven’t disappeared, but the market is clearly prioritizing growth visibility and execution right now, and that’s showing up in price action.
Trading Recommendation:
Putting it all together, I’m going LONG Target Corporation for a short-term momentum trade. I’m watching $112.80 closely as first-line support and $110.10 as the line in the sand. If price holds, I’m targeting $118.50 first and $122.50 if buyers press the move. This isn’t a low-risk setup, so position size should reflect the 58% confidence level. I like this as a momentum continuation play, not a long-term hold at these prices.

Palantir at $135.9: Momentum Builds Toward a $150 Test:Current Price: 135.9
Direction: LONG
Confidence level: 58%(Several professional traders point to bullish momentum above key EMAs and repeated upside references toward $140-$150, while mixed short-term sentiment keeps conviction moderate.)
Targets
Target 1: 140
Target 2: 150
Stop Levels
Stop 1: 130
Stop 2: 126
Wisdom of Professional Traders:
This analysis pulls together what several professional traders and market experts are saying right now. When I line up their technical takes with real-time market chatter, a pattern emerges: despite valuation debates, traders are leaning into upside momentum. The wisdom of crowds matters here because repeated references to the same levels and themes often show where capital is actually moving, not just what sounds good on paper.
Key Insights:
Here’s what’s driving this setup. Multiple traders highlight Palantir’s strong revenue growth and its role as an AI “picks and shovels” provider. The common thread is that Palantir isn’t betting on a single AI model winning—it sells the infrastructure layer that enterprises keep paying for regardless. That’s a big reason traders remain constructive even after sharp moves.
What caught my attention is how often traders mentioned the stock trading well above its key moving averages. Price is holding above the 20‑, 50‑, and 200‑day EMAs, which many traders see as confirmation that buyers still control the tape. Several pointed to the $140 area as the next real test, with a push through opening the door toward the mid‑$140s and potentially $150 within days.
Recent Performance:
You can see this thesis playing out in the price action. PLTR is up about 4.5% recently, with volume slightly above average. The stock has been bouncing rather than breaking down, which tells me dips are still getting bought. That behavior matters more than headlines in the short run.
Expert Analysis:
Traders I’m tracking repeatedly referenced $130 as an important support zone. That level lines up with recent pullbacks and short-term moving averages, making it a logical risk line for a weekly trade. On the upside, $140 showed up again and again as a near-term resistance level, followed by a broader consensus zone between $145 and $150 if momentum continues.
There’s also talk of short covering. With notable short interest still in the name, several traders believe any clean break higher could force additional buying, accelerating moves faster than many expect.
News Impact:
Recent AI partnership headlines and ongoing discussion around enterprise adoption are helping keep buyers engaged. While valuation concerns haven’t disappeared, the market is clearly reacting more to growth visibility and deal flow than to traditional multiples right now. For a one-week horizon, that news flow supports staying with the trend.
Trading Recommendation:
Here’s my take. I’m staying LONG while PLTR holds above $130. The plan is straightforward: look for a move into $140 first, then reassess momentum for a possible extension toward $150 this week. If price loses $130, I’m out, and a deeper flush toward $126 would invalidate the setup. This isn’t a forever trade—it’s a momentum play based on what traders are actually doing right now.

Tesla at $411 Faces Heavy Resistance as Traders Fade the BounceCurrent Price: 411.11
Direction: SHORT
Confidence level: 58%(Several professional traders highlight repeated resistance near $415 and describe the move as a relief bounce within a downtrend, with consistent downside targets around $400 and the $380s. X sentiment is mixed but leans cautious, keeping confidence moderate rather than high.)
Targets
Target 1: 400
Target 2: 382
Stop Levels
Stop 1: 418
Stop 2: 425
Wisdom of Professional Traders:
This analysis pulls together the collective insight of many professional traders and market experts discussing Tesla over the past several sessions. When I step back and look at the crowd wisdom, a clear theme shows up: traders see Tesla in a broader downtrend and are treating recent strength as a bounce into resistance rather than the start of a fresh leg higher. The wisdom of crowds matters here because multiple independent traders are pointing to the same price zones, which usually isn’t random.
Key Insights:
Here’s what’s driving this setup. Several professional traders repeatedly highlighted the $411–$415 area as a major pivot and resistance zone. Tesla is trading right in that pocket now, and traders are watching closely to see if it gets rejected again. The language across analyses leans toward “relief bounce within a downtrend,” not a clean breakout. That tells me sellers are likely still active above current prices.
What’s interesting is the consistency around downside levels. Many traders mentioned $400 as a must‑hold psychological level. Below that, the conversation quickly shifts to the $380s, which came up multiple times as a prior flush low and likely magnet if selling pressure picks up. That clustering of downside targets gives the short setup structure.
Recent Performance:
You can see this trader thinking reflected in the price action. Tesla is still down meaningfully from its late‑2025 highs near $500 and remains below key short‑term trend levels. Even though the stock bounced back toward $411, it hasn’t reclaimed the zones that traders associate with trend reversal. Volume has been decent, but not convincing enough to suggest aggressive accumulation.
Expert Analysis:
Several professional traders described Tesla as technically weak on the daily chart, with lower highs and repeated failures near resistance. A few traders did acknowledge the possibility of a short squeeze if $415 breaks cleanly, but most framed that as a conditional scenario rather than the base case. The dominant view is that unless Tesla holds above $415 and builds acceptance, rallies are likely to be sold.
On the social side, X sentiment is split, but the more actionable posts focus on technical breakdowns and failed trendlines. That doesn’t give bulls much fuel in the short term and reinforces the idea that risk is skewed lower this week.
News Impact:
The news flow around Tesla remains noisy but not decisive for near‑term price. Speculation about AI, robotics, and potential ecosystem synergies keeps long‑term optimism alive, yet traders don’t see those themes translating into immediate price support. At the same time, valuation concerns and heavy capex plans continue to cap upside enthusiasm in the short run.
Trading Recommendation:
Putting it all together, here’s my take: this looks like a SHORT setup against clearly defined resistance. I’m leaning on $415 as the line in the sand. As long as Tesla stays below that zone, the path of least resistance points toward a retest of $400, with $382 as an extension target if selling accelerates. Risk is well‑defined with stops above $418–$425, which several traders flagged as the level that would invalidate the bearish thesis.
Position size should stay moderate given the mixed signals and Tesla’s volatility, but the risk‑reward favors fading strength rather than chasing it higher this week.

Nasdaq Composite Holding High Ground Into the Week:Current Price: 25254.75
Direction: LONG
Confidence level: 85%(Trader consensus remains unified across group metrics.)
Targets
Target 1: 25550
Target 2: 25900
Stop Levels
Stop 1: 24950
Stop 2: 24650
Wisdom of Professional Traders:
Here’s my take after combining what professional YouTube traders are saying with real-time X sentiment. Even though the raw directional pulse reads neutral, the context matters. Several pro traders I tracked are leaning cautiously bullish for this week, pointing to consolidation near highs rather than distribution. On X, the tone isn’t euphoric, but it’s steady — dips are getting bought, not sold.
What’s interesting is that when both YouTube and X go quiet instead of bearish at elevated levels, it often signals underlying strength. No panic, no aggressive shorting. That usually favors continuation, not reversal. With 2026 macro chatter focused on stable growth expectations and no immediate shock catalysts this week, I’m leaning LONG across the Nasdaq complex for a short-term push higher over the next 5–7 trading days. Confidence is moderate, not aggressive, but the path of least resistance still looks up.
---
Key Insights:
I’m tracking how the Nasdaq Composite keeps holding above its recent consolidation zone. Every pullback has been shallow, which tells me sellers just aren’t that motivated right now. That usually doesn’t happen near meaningful tops.
Another thing that stands out is momentum cooling without price breaking down. That’s classic digestion, not exhaustion. For this week, that setup often resolves higher, especially when traders aren’t aggressively shorting.
So where does this leave us? As long as price stays above near-term support, odds favor a push toward the upper end of the recent range rather than a sharp drop.
Recent Performance:
Over the last couple of weeks, ^IXIC has chopped sideways near highs, holding gains instead of giving them back. That’s a constructive look going into this week.
Expert Analysis:
Several professional traders I follow on YouTube aren’t pounding the table bullish, but they’re clearly not bearish either. Most are saying, “As long as this support holds, I stay long.” On X, tweet volume is steady with a slight tilt toward dip-buying commentary.
News Impact:
There’s no major 2026 macro headline hitting this week that changes the short-term outlook. That lack of negative surprise risk actually helps bulls in the near term.
Trading Recommendation:
I’m staying LONG for the week, looking for continuation rather than a breakout explosion.

DXY Analysis: Resistance Is Capping the ReboundThe Dollar Index (DXY) is currently showing a weakened structure after rejecting a key retracement zone around 98.0–98.2, corresponding to the 0.618 Fibonacci level and a former support area turned resistance.
The technical rebound from the weekly support near 96.0 highlights the presence of longer-term buyers, but short-term momentum remains fragile as price fails to reclaim higher territory decisively. Selling pressure dominates as long as the DXY stays below 98.2–98.5, opening the door for further downside toward lower liquidity zones and a potential retest of the major support around 96.0.
Only a clear break back above this intermediate resistance would neutralize the bearish bias and restore a more constructive outlook.

Apple pushing toward breakout as trader consensus turns bullishCurrent Price: 278.12
Direction: LONG
Confidence level: 67%(Several professional traders consistently describe Apple as structurally strong with buy-the-dip behavior and repeated upside levels around $283-$288, while X sentiment supports continuation but with some caution.)
Targets
Target 1: 283.00
Target 2: 288.00
Stop Levels
Stop 1: 275.00
Stop 2: 270.00
Wisdom of Professional Traders:
This analysis pulls together the collective wisdom of professional traders and market experts who have been actively discussing Apple. When many traders independently highlight the same trend, support zones, and upside levels, it usually means the market is sending a clearer signal. In Apple’s case, the crowd is leaning bullish, with repeated emphasis on trend strength, buy‑the‑dip behavior, and a potential push toward new highs if resistance breaks.
Key Insights:
Here’s what’s driving this setup. Several professional traders describe Apple as one of the strongest names within large‑cap tech, calling it a relative safe haven when volatility hits the broader market. A common theme across trader discussions is that pullbacks have been shallow and quickly bought, which usually points to institutional demand underneath the price.
Another thing that stands out is how often traders mention the same price zones. The $275–$272 area keeps coming up as a key support band, while $283–$288 is repeatedly flagged as the ceiling that matters. That kind of level clustering tells me traders are watching the same chart and reacting in similar ways, which strengthens the setup for a directional move.
Recent Performance:
This all shows up clearly in the price action. Apple has been holding above its 50‑day and 200‑day moving averages, trading around $278 after a steady grind higher. Over the last sessions, volume picked up on up days, and downside moves were met with quick buying. That behavior fits the idea that dips are being accumulated rather than sold aggressively.
Expert Analysis:
From a technical angle, multiple traders point out that Apple is making higher highs and higher lows on the daily chart. Momentum indicators like RSI remain constructive, suggesting there’s still room before conditions get stretched. Several traders also emphasized that Apple has stayed much closer to its highs than other mega‑cap peers, which often signals leadership.
On the sentiment side, X activity shows more bullish commentary than bearish, with frequent mentions of strong volume, earnings strength, and AI‑related optimism. While not euphoric, the tone supports continuation rather than reversal, which fits a tactical long bias for the week.
News Impact:
Recent news adds fuel to this view. Strong services revenue, ongoing buybacks, and anticipation around AI integration and upcoming hardware launches keep Apple in focus for institutions. At the same time, concerns around China supply chains and costs are known risks, but traders seem to be treating those as manageable headwinds rather than reasons to exit aggressively.
Trading Recommendation:
Putting it all together, I’m favoring a LONG position in Apple this week. I’m watching $275 as the first line of defense and $270 as the level that would clearly invalidate the bullish setup. On the upside, a push through $283 opens the door to a quick move toward $288, which several traders highlighted as the next major test. Risk looks defined, upside is clear, and the trader consensus leans positive enough to justify the trade.

sliver on pullback#Sliver price await break below 78.1 which will drop the price till 76.6 and 75.21.
Sell stop below 78.1, target 76.6 and 75.2, SL 78.75.
Valid breakout above 80.03 will retest back 81.3.

Gold: Range Formation or Trend Continuation?Hi, I’m Maicol, an Italian trader.
I study Gold since 2019.
I need your support.
Leave a like and follow me.
It’s a small thing for you, but important for my work.
Please read the description to understand the trading plan.
Don’t focus only on the chart. Thanks.
Live today at 14:00 CET (Rome time).
🌞 GOOD MORNING EVERYONE 🌞
🟡 Gold Outlook
On Friday, gold closed with its typical bullish session.
The question now is simple: can it break the daily shift and continue higher?
This week we have NFP.
At the moment, I see the early formation of a H4 range.
If this is confirmed, the best opportunities will be at the range extremes.
Today is Monday.
Usually a low-decision day for me.
I prefer to wait for the daily close.
Let’s see how price behaves.
-Bullish factors
We come from a daily close bullish
Daily structure is still in a bearish shift
H4 and H1 are currently bullish
🟡 With US data unreliable due to the government shutdown and earnings season still dominating sentiment, gold is moving from forced selling into a stabilization phase.
It remains highly sensitive to yields, USD flows, and equity volatility.
🔑 Key points
The gold selloff was liquidity-driven
Not driven by the Fed or inflation
Tech earnings, especially AI-related, created shocks
Forced selling across assets
Government shutdown = delayed or distorted US macro data
Bond auctions and Fed speakers are now the main drivers
Volatility remains high
Risk is still asymmetric
📍 Bearish pressure is slowing down.
Liquidation is easing.
However, upside momentum is still weak.
Earnings risk and elevated real yields are weighing on price.
For continuation, gold needs one clear trigger:
Equity market stabilization
or
Confirmation from the bond market
For now, I keep these zones.
See you live today at 18:00 for market analysis.
🔍 Reminder 🔍
I avoid trading during the Asian and London sessions.
I focus on the 14:30 news and the New York open at 15:30.
🔔 Turn on notifications so you don’t miss anything.
📬 If you have any questions, message me. I’ll reply.
🔍 NEXT APPOINTMENTS 🔍
As usual, we’ll be live at 14:00 to follow the market in real time.
In the meantime, have a good day.
-GOOD TRADING
-MANAGE RISK
-BE PATIENT

Nas short idea 09/02/26Price hit M15 hold on top, created range trend. Rejected off M15 break, looking for short off M15 BSH. Daily DC1
