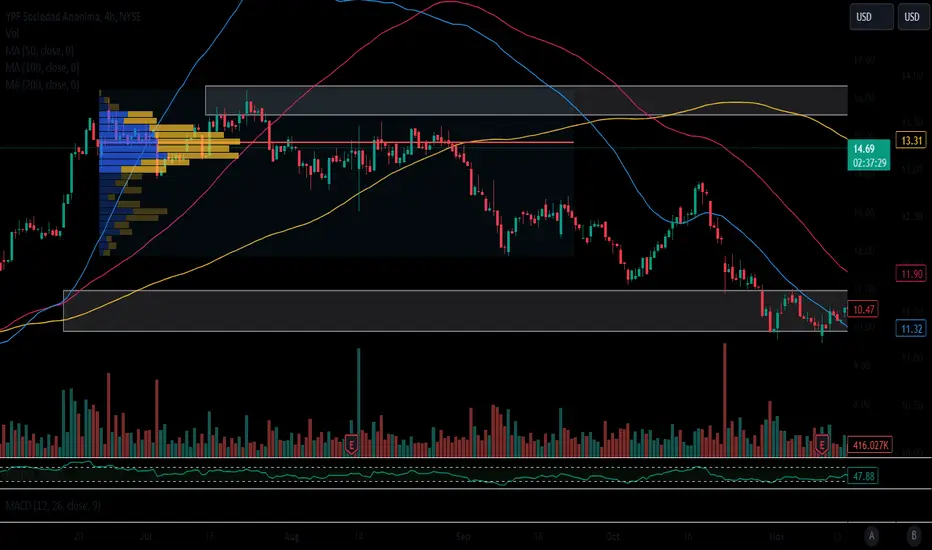
YPF - looking bullishNYSE:YPF breaking out from a massive pennant and doing new local highs, waiting for a pullback to 10 usd. Amazing opportunity to buy between 7 usd and 11 usd and hold very long term or sell at 35 or 50.
Next report date
Report period
Q1 2024
EPS estimate
0.66USD
Revenue estimate
4.38 BUSD
−8.53USD
−5.30 BUSD
18.30 BUSD
393.03 M
About YPF SOCIEDAD ANONIMA
Sector
Industry
CEO
Horacio Marín
Website
Headquarters
Buenos Aires
Founded
1977
FIGI
BBG000BHPFQ0
YPF SA engages in the exploration, production, and distribution of oil and gas. It operates through the following segments: Upstream, Gas and Power, Downstream, Central Administration and Other. The Upstream segment sells petroleum and natural gas. The Gas and Power segment markets natural gas to third parties and downstream segment; and manages commercial and technical LNG Regasification Terminals in Bahia Blanca and Escobar. The Downstream segment produces petroleum refining and petrochemicals. The Central Administration and Other segment covers corporate administrative expenses and assets, construction activities, and the environmental remediation. The company was founded on June 2, 1977 and is headquartered in Buenos Aires, Argentina.

YPF (NYSE: YPF) Lead Argentine Stock RallyThe U.S.-listed shares of YPF SA (YPF) shot up 24.3% toward a one-month high in premarket trading Monday, as investors in the Argentina-based oil and gas company cheered the election of right-wing populist Javier Milei as the new president of Argentina.
The stock's rally was part of a broad gains
YPF buy at new breakout at cmp 13-14YPF buy at new breakout at cmp 13-14.
target 28-35 in 4-6 months .

Long YPFConsolidation looks done. There is resistance so can get in on b/o
Earnings are great
Goal is about 2.5R (3.5ATR(21EMA)). Risk is about 1.5ATR
Risk management is the most important.

YPF could make a moveYPF could make a move out of decent base. Price and volume contraction coming into the 20-day

Short YPF This stock has really been on a tear recently and with a global recession looming I look for oil demand to wane. Going to take the short side of this trade and fade any bounce with long the Feb $11 puts.

whats not to love?its the only game in town. its huge. its soaking up loads of dead cash. its got a lovely name. long.


An Entry Against the Trend YPFI noticed a repeating pattern and tried to annotate this pattern using 1,2,3,4, and pattern completion 5 (white)
An entry here on this Monthly chart would be chasing this potential rise based on pattern completion
Risky entry against the trend, still possibly valid although, hard to pull off

future support between 3.00 /3.20 zonefuture support between 3.00 /3.20 zone. will see.
In technical analysis, a triangle is a continuation pattern on a chart that forms a triangle-like shape.

See all ideas
Trade directly on the supercharts through our supported, fully-verified and user-reviewed brokers.


Curated watchlists where YPF is featured.
