SOLUSDT – Short-Term Bearish BiasHello traders,
In my view, SOLUSDT is likely to lean toward a slightly bearish trend in the coming sessions. The preferred strategy is to sell the rally when price approaches the confluence zone around 196–199. Currently, Solana is testing the descending trendline that has been in place since early October — a level that has previously formed multiple tops and faced strong rejections.
News Overview:
The recent listing of the Solana ETF in Hong Kong is a positive sign for the medium term. However, the broader crypto market remains under pressure due to uncertainty in the United States , as ETF approvals are delayed by the government shutdown and the unclear regulatory stance from the SEC. This has limited short-term speculative capital and created a cautious sentiment across the market.
In addition, rumors claiming that a Solana ETF was approved in the U.S . have been refuted by Reuters and Bloomberg, indicating that the market may have overreacted to unverified information. This kind of overhype often leads to short-term corrections following technical rebounds.
Technical Analysis:
On the 4H timeframe, SOL is clearly moving within a downtrend structure, forming a series of lower highs and lower lows.
The 196–199 zone aligns with the descending trendline, the EMA89, and a key dynamic resistance level.
Price is showing weak reaction in this area, suggesting that buying momentum is fading.
If a rejection candle pattern or SFP (swing failure pattern) appears near 197, it could be a good opportunity to enter short positions.
The near-term target lies around 182–175, a strong support zone where price previously bounced. If 175 breaks, the decline could extend further toward 170–168.
Bitcoin (Cryptocurrency)

The 3 KEYS to Trading SUCCESSToday we will discuss about the 3 Keys I believe are required for succeeding in trading.
When you enter into the trading field, you quickly understand that it’s not just about charts and setups — it’s about mastering yourself mentally.
There are 3 keys that separate those who last from those who don’t in Trading:
( 1 ) Psychology
( 2 ) Risk Management
( 3 ) Consistency
Every single one is equally important, but how you balance them determines your long-term outcome when trading.
1 ) Psychology — Master Your Mind Before You Master the Market
Trading, the mental game disguised as a financial one displaying 1s and 0s winners and losers. The market, the charts, the currency, they do not care who you are, what you think, or how badly you want to win.
It simply exposes your strengths and weaknesses in the world of psychology .
Most traders lose, this is not because they lack knowledge, but because they cannot control their emotions, feelings — fear of losing, fear of missing out, greed after a win, hesitation after a loss, anxiety, frustration, impatience.
Every emotional outburst leads to poor decision-making: closing early, revenge trading, over-leveraging, or ignoring your plan, right after you told yourself you were going to lock in and turn $100 into $1000000.
To master psychology:
( 1 ) Detach from the outcomes/end-result. Focus on executing well, not whether a trade wins or loses. Follow your plan.
( 2 ) Think of probability. Every setup, every trade must have an edge — not a guarantee.
( 3 ) Accept losses as part of the process. Losses are tuition fees in this business. Every loss is a win, because there is a lesson to be learned.
( 4 ) Stay grounded. Journaling, mindfulness, and post-trade reflection go a long way. Keep track of trades and review them during down time.
When your mindset stabilizes, when your thoughts are calm, your trading skills become consistent. The charts don’t change — you do.
In terms of training your mindset, see my previous post below which explains the difference between a Trader and Gambler. This is an excellent article for those who want to BECOME a trader.
2. Risk Management — Protect Before You Profit
If psychology keeps your calm, risk management keeps you alive.
This is the part most traders skip — until they learn the hard way and blow their own capital, or 10 fundeds in a row.
Your number one job as a trader is not to make money. It’s to protect capital so you can focus on staying in the game long enough for your strategy and edge to play out well.
Practical risk rules:
( 1 ) Never risk more than 1–2% of your capital on a single trade. (If you do, you increase the emotions of greed)
( 2 ) Always know your max loss before entering — no guessing, if you do not? Your loss, your fault.
( 3 ) Use stop-losses logically, not emotionally. Set them at resistances or supports. Key levels.
( 4 ) Avoid over-leveraging. Leverage magnifies both wins and mistakes. Higher the leverage, higher the risk.
( 5 ) Don’t chase. Missed trades are better than blown accounts. Record them down and log emotions.
Good risk management doesn’t make you rich overnight — but poor risk management will make you broke instantly .
You don’t need huge wins to grow; you just need small, controlled losses and consistent execution throughout your trading journey.
3. Consistency — Discipline Over Drama
Consistency is the glue that holds everything together, risk management to Psychology.
It’s easy to stick to your plan for a week; but it is hard to do it for months without deviation and drifts. But that’s exactly what separates traders who make it from those who burn out.
Consistency means:
( 1 ) Showing up daily, sticking to a fixed plan of study, back testing, assessing.
( 2 ) Following your trading plan with discipline.
( 3 ) Reviewing your trades honestly — both wins and losses. (Are YOU doing THIS?)
( 4 ) Avoiding impulsive changes just because of one bad day. Take a break if the loss affects you badly.
Progress in trading is slow and often invisible. You might not notice improvements week to week but look back after six months of focused consistency — and you’ll realize how far you have come. Remember, slow and steady wins the race. This is a game of Tortoise v Rabbit. Push fast and hard and you will make mistakes – be slow and steady and you will win the race.
Stepping back to view the bigger picture
Trading success isn’t luck — it’s the result of compound discipline, calculated trades and timing.
( 1 ) Psychology gives you control.
( 2 ) Risk management gives you longevity.
( 3 ) Consistency gives you results.
When you align all three, everything starts to click.
You don’t need to master the market — just master your mindset, your risk, and your routine . The profits follow naturally.
Thank you all so much for Reading. I hope this post becomes beneficial to you!

gold\btcI don't understand this...
If gold protects against inflation, why is it losing so much value against Bitcoin?
Conspiracy theorists, the stage is yours 👀

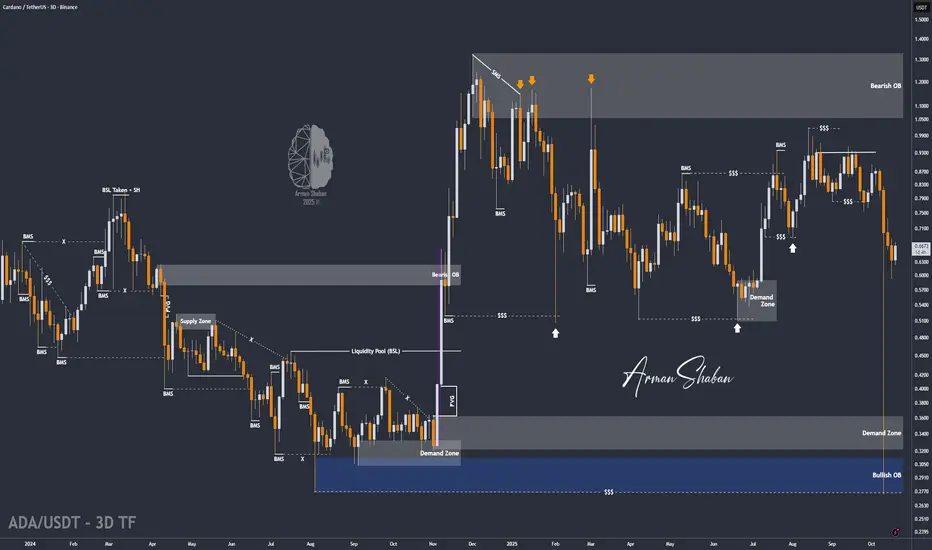
ADA/USDT | Demand Zone Holds, Bulls Gaining MomentumBy analyzing the #Cardano chart on the 3-day timeframe, we can see that after dropping to around $0.59 , ADA once again reacted strongly to demand, rebounding to the $0.66 area. This confirms that buyers are still defending lower levels and that the $0.58–$0.63 zone remains a key support range.
The overall structure is still bullish within accumulation, and this latest bounce could mark the beginning of a gradual recovery phase. As long as ADA holds above $0.63 , the next upside targets remain $0.75, $0.85, and $1.00 — with momentum likely to build if Bitcoin maintains stability above $112K .
This recovery reinforces the idea that ADA is quietly preparing for its next major move upward after weeks of consolidation.
Please support me with your likes and comments to motivate me to share more analysis with you and share your opinion about the possible trend of this chart with me !
Best Regards , Arman Shaban
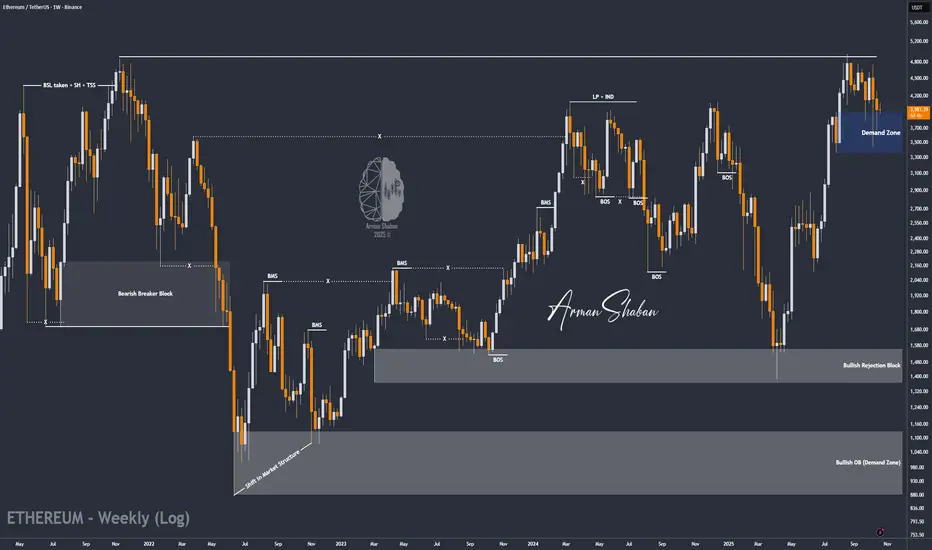
ETH/USDT | ETH Update – Waiting for Confirmation Above $4K!By analyzing the #Ethereum chart on the weekly timeframe, we can see that price has been consolidating around the $4,000 level after a sharp recovery from the $3,400 demand zone. This sideways movement shows ongoing accumulation, but a clear breakout and close above $4,000 is still needed to confirm renewed bullish momentum.
As long as ETH holds above the $3,900–$4,000 support range, the broader bullish outlook remains valid. The next upside targets are $4,950, $5,500, and $6,000 , but continuation strongly depends on Bitcoin’s ability to stay above $112K .
In short — ETH is gearing up for its next move, but the key lies in a confirmed breakout above $4K with BTC providing stability.
Please support me with your likes and comments to motivate me to share more analysis with you and share your opinion about the possible trend of this chart with me !
Best Regards , Arman Shaban
LTC/USDT | LTC Update – Bulls Back in Control!By analyzing the #Litecoin (LTC) chart on the weekly timeframe, we can see that after testing the $76–$88 demand zone, LTC has continued its recovery and recently climbed to around $94.5 , showing that buyers are still defending key levels strongly.
The overall structure remains bullish — as long as the price holds above $88, the outlook stays positive. The next upside targets remain $100, $114, and $120, where short-term resistance could appear before the next breakout attempt.
This steady recovery once again confirms Litecoin’s technical strength and the reliability of its long-term demand zone. If momentum holds, we could soon see another strong push toward the $100 mark and beyond.
Please support me with your likes and comments to motivate me to share more analysis with you and share your opinion about the possible trend of this chart with me !
Best Regards , Arman Shaban

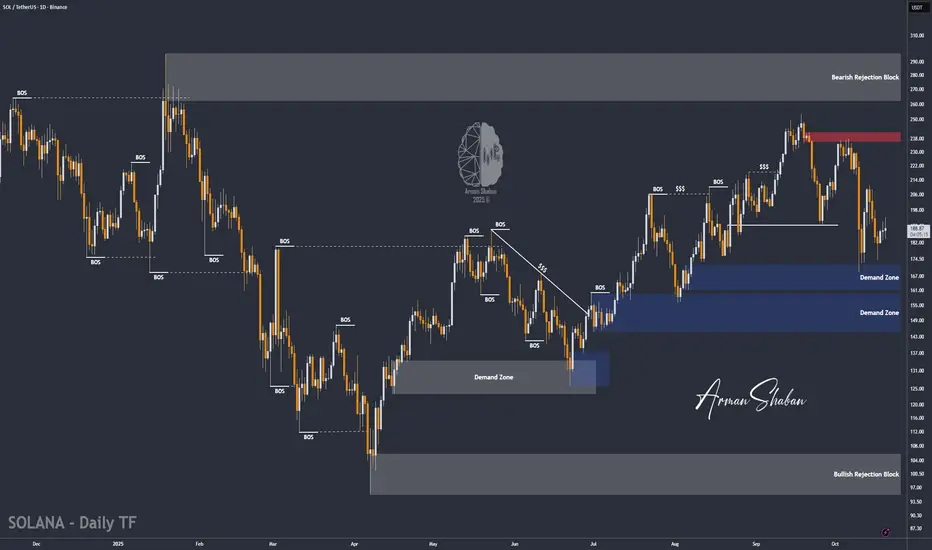
SOL/USDT | SOL Update – Recovering After Volatile Swings!By analyzing the #Solana (SOL) chart on the daily timeframe, we can see that after a sharp drop to around $169, SOL quickly rebounded to $211, then faced another correction back to $174. Since holding steady above $170, the price has regained momentum and is now trading near $190, showing signs of renewed strength.
If SOL manages to maintain stability above the $170–$175 zone, the bullish structure remains intact. The next upside targets are $211, $216, $238, and $254 , where short-term reactions may occur before further continuation.
The overall outlook remains bullish , but you should watch closely to see if SOL can sustain its momentum above current levels — this could be the start of a new leg higher.
Please support me with your likes and comments to motivate me to share more analysis with you and share your opinion about the possible trend of this chart with me !
Best Regards , Arman Shaban
BNB/USDT | BNB Update – Correction After New ATH!By analyzing the #BNB chart on the weekly timeframe, we can see that after reaching a new all-time high at $1,376, BNB entered a healthy correction phase and is now trading around $1,100. Despite this pullback, the structure remains bullish as long as the price holds above $1,050, which currently acts as the key support zone.
If BNB manages to stay above this level, the uptrend could resume, with potential upside targets at $1,300, $1,400, and $1,550 — consistent with previous projections. However, a confirmed break below $1,050 could open the door for a deeper drop toward the $850 region.
For now, bulls still have control, but the next few days will be crucial to confirm whether this correction is just a pause or the start of a deeper retracement.
Please support me with your likes and comments to motivate me to share more analysis with you and share your opinion about the possible trend of this chart with me !
Best Regards , Arman Shaban

BTC Weekly Log Channel ChartThe last two times weekly price bounced off of this trend line there were 7 weekly green candles in a row. Price is on it's second weekly green candle, we'll see if that happens again. Added my price target & the week I believe it happens from other charts that I have for the bull cycle peak.

BITCOIN SIGNAL: HUGE WHALE GETTING READY TO DO THIS NOW!!(scary)Yello Paradisers, enjoy the video!
And Paradisers! Keep in mind to trade only with a proper professional trading strategy. Wait for confirmations. Play with tactics. This is the only way you can be long-term profitable.
Remember, don’t trade without confirmations. Wait for them before creating a trade. Be disciplined, patient, and emotionally controlled. Only trade the highest probability setups with the greatest risk to reward ratio. This will ensure that you become a long-term profitable professional trader.
Don't be a gambler. Don't try to get rich quick. Make sure that your trading is professionally based on proper strategies and trade tactics.

$BTC Bulls Fight Back With Weekly CloseNot sure how I continue to amaze myself, but I do 🤓
Notice how those MMs respected my DANGER ZONE POI to the dollar?
Thankfully CRYPTOCAP:BTC did not close the Week outside the DZ.
The battle between Bulls and Bears is FIERCE 🔥
Bulls cannot afford another blue weekly close.
If so, the 50WMA retest ~102k will be inevitable.
Bulls need to reclaim and close this upcoming week above the 20WMA and .236 Fib
A close ~$116k would be super bullish.
That should be enough ammo to spark the long awaited parabola that UpTober has historically brought us.

BTC Market Update: Bulls Regain ControlBitcoin has stabilized after a sharp corrective phase, forming a consolidation structure around the $111,000 area. Recent sessions indicate that sellers are losing dominance while buyers are quietly re-accumulating within the current range. This type of price action often appears before a potential short-term recovery move.
Market volume remains steady, and the structure shows compression—suggesting liquidity buildup below the current level. If this consolidation sustains without breaking lower, a breakout toward the $115,000–$116,000 region appears likely. A clean move beyond this zone could invite stronger bullish continuation as sidelined traders re-enter.
However, the broader trend remains cautious, as macro conditions and dollar strength could still limit momentum. Short-term traders may look for entries near the range lows with clear invalidation below $108,000. Proper risk management remains essential, targeting gradual exits around mid-range levels and scaling profits near projected resistance zones.

BTC 2026 Outlook - Roadmap Speculation to $300KHello BTC Watchers.
Let's talk about BTC in the Logarithmic view.
I mapped out the date-ranges, as well as how far the price fell logarithmically after each top. You'll see the word "lines" on the chart. This simply indicates the amount of diagonal trendlines it has fallen. By using this pattern-dedicated approach, a commonality is found which may be useful in speculating a future price. Because if not for past history, how else would we speculate on the future?
It's interesting to note that the past 3 ATH's (all time high's) are each lower than the previous if you compare it not to price but to the "lines". Even the fifth high (the one coming next) will be on a lower click-line than the previous, and that estimate is already over 300k. This is a really helpful way to speculate a future high because usually on a regular-view chart, the zone above the ATH is uncharted territory. You could use a Fibonacci trend-based extension, but this is limited to the cycle that you're using for input points. Logarithmic chart + indicators factor in the entire history of the price.
This would mean the new peak could be in 2026 around USD 300k.
It's important to note that this ay not be a straight line up. As you'll see, although the price has been increasing exponentially, there have been periods of hard pullbacks or corrections. These are great times to enter the market, NOT when the price is close to the peak of the curve (in green).
So could it be that this is just another dip in the road towards a new ATH - despite the recent market liquidation?

TradeCityPro | Bitcoin Daily Analysis #201👋 Welcome to TradeCity Pro!
Let’s dive into Bitcoin analysis—its bullish trend seems to have started again, so it’s very important to analyze it well for the new week.
⏳ 1-Hour Timeframe
Yesterday, Bitcoin formed a range box between 106319 and 107301, and by breaking the top of this box, it began an upward move.
📊 After breaking this box, buying volume increased sharply, and after a pullback to this area, the move continued up to 111645.
✔️ Now the price has returned above the 109000 zone, but it still hasn’t managed to hold above this area.
⭐ With a break of 111645, we can confirm that price has stabilized above the 109000 zone.
🔍 In that case, we can enter a long position on the break of 111645; and at the same time, we’ll confirm that the break of 109000 was a fake-out.
💥 The trigger on the RSI is the 74.53 level. With RSI entering Overbought and breaking 74.53, the next bullish leg can begin.
❌ Disclaimer ❌
Trading futures is highly risky and dangerous. If you're not an expert, these triggers may not be suitable for you. You should first learn risk and capital management. You can also use the educational content from this channel.
Finally, these triggers reflect my personal opinions on price action, and the market may move completely against this analysis. So, do your own research before opening any position.

Bitcoin Short This is overbought on M15, M30, and H1 showing strong divergence on RSI
There is a bat pattern on H1 displaying a potential reversal zone
Bitcoin is currently in a downtrend after the crash, making this a continuation
Stoploss above 112250
There is strong resistance from the previous weeks low

Ethereum’s Hidden Fractal Points to $33K by November 2026Most of the space seems to think that the bull market is officially over, that the four-year cycle has come to a close. For most of the cycle, I have thought that way too. 1,064 days is up, and that’s the longest a Bitcoin cycle has ever gone for. So, the idea that the same thing will play out again is very valid, and it’s entirely possible that it is indeed the end. However, my stance is very different — I still think we have one year left in the tank, and I will present a lot of evidence to support why I believe this and why I’m sticking to it.
If you’ve been following me for a while, you know that we’ve found some very interesting bar patterns in history that keep on repeating, and this will be the primary source of evidence used in my thesis.
Bar Pattern Fractals
I have tested hundreds of indicators over the last six years and bought thousands of dollars’ worth of indicators, and in the end, the highest success rate has come from simply following bar pattern fractals. They repeat over and over. They are hard to find, but once you do, you can ride them for months.
ETH 2017 Fractal
What you see above is a fractal I have been following for months now. It has been mirroring the 2017 cycle, with some parts nearly identical in movement and timing, with only a few small deviations here and there. The macro pattern continues to play out like clockwork.
Take a look at this TA from March 2025. We caught near the bottom, called for max pain, and discussed this fractal that could be playing out. The ETH call was under 2000 back then.
I also published TAs on Chainlink and its repeating bar patterns. It was straightforward for catching big macro moves for LINK.
As you can see, these are just two examples of many fractals I’m following. The main one is ETH because it’s been a 1:1 mirror for the most part. The last spike down was a deviation for sure — well, at first I thought it was on the Bitstamp chart because it has the most historical data for ETH, but when I switched to the Binance chart, I found something very interesting.
A view of the bar pattern fractal is telling us where we are.
When switching to the Binance chart, we see a very interesting wick of 26% that nuked the market during that time — very similar to what Binance has done this time around. You cannot make this stuff up. So at first, I thought it was a small deviation, but in fact, after looking at this chart, it’s still a mirror, even including that huge scam wick of 27%. Amazing.
So as you can see, in terms of the bar pattern fractal, I simply cannot ignore the fact that this keeps mirroring, and if it continues, it’s possible that we have one more year left in this bull market, and that this four-year cycle thesis is, in fact, a massive bear trap.
If we take a look at the monthly candle that shook a lot of players out last cycle before the run-up, we can see that we printed a candle with wicks on both ends — very similar to what we are forming right now.
If we zoom into that moment on a smaller timeframe, you can now see the moves are similar — a big drop into a double bottom followed by a slow grind up. This is how ETH normally puts in bottoms.
Looking at ETH’s RSI levels on the monthly chart — during the first cycle, when it broke the all-time high, RSI was extremely overbought at 87. On the last cycle, it was 82. This cycle, ETH is at an all-time high and the RSI is only 59. We’re not even in the overbought range yet — there’s so much room for ETH to expand, it’s crazy.
Since its inception, ETH has always pulled off the same move: one very aggressive wave with an aggressive pullback, followed by one smaller wave that creates a higher high to finish off the cycle. It’s done this every time.
Which means that if the bar pattern fractal continues to mirror, then wave 1 tops in the first week of January 2026, followed by a massive correction that will again fool everyone into thinking the four-year cycle is 100% over. But what if ETH puts in a bottom in February 2026 and rallies back up to all-time highs? Nobody would believe it — the disbelief would be strong because everyone would have sold the top in Q4 2025 due to the four-year cycle theory.
The second major piece of evidence I’m leaning on is the Russell 2000. Since its inception, the Russell 2000 has done the exact same thing before expansion comes:
Double top
Second drop bear trap
V-shaped recovery back to all-time high
Expansion breakout
Same thing every time. Look at the chart and tell me we’re not going into expansion — there’s a very high chance. The last two times, we got that massive monthly candle breakout in November.
Which brings me to the main point — every time the Russell goes into expansion, Bitcoin has started its most aggressive run. The last three times, Bitcoin went on to break its all-time high and put in a cycle top within an average of 355 days.
Gold, shown above, is so close to the 4.236 extension right now that it would be crazy to buy here. There’s a high chance of a major top coming in, and we’re about to see a major rotation back into Bitcoin with those gains.
Just take a look at the Power of Law model for Bitcoin — the bull market hasn’t even started yet.
It’s crazy that people are calling the cycle top with the Mayer Multiple sitting at 1.19.
Conclusion
My view is that there is one more year left in this uptrend in crypto. Bitcoin has turned into a different beast. It has completely detached itself from the rest of crypto for the most part, but the first expansion is coming in 2026. If the bar pattern does not deviate, then greatness lies ahead.

BTCUSD 1W Chart – The Cyclical Geometry of Bitcoin MarketsA close examination of Bitcoin’s long-term structure reveals a striking symmetry between its bull and bear phases. The last two bear markets each lasted 364 days, while the two subsequent bull runs expanded for 1,064 days — a rhythm so precise it reflects the mechanical heartbeat of Bitcoin’s market cycles.
Following the 2020 halving, Bitcoin rallied +2,105% over 1,064 days, peaking at $69,000 in 2021. The previous cycle delivered an even greater +18,044% rally, followed by an -84% correction that defined the next macro bottom.
The current cycle, post Halving 2024, continues to mirror this same time symmetry with remarkable accuracy. If history holds, the projected top should arrive roughly 1,064 days after the Halving — around late 2026 — with a potential target zone between $143K and $146K, adjusted for performance decay over time.
However, if the market breaks this cyclical rhythm, it would mark the first major deviation in Bitcoin’s historical pattern. Such a break would not just disrupt the four-year cycle theory — it could signal the birth of a Supercycle, a multi-year parabolic expansion phase driven by institutional adoption, sovereign participation, and macro liquidity shifts.
Until then, all evidence still supports an ongoing reaccumulation phase within the broader bull structure.
Bitcoin’s 364-day downtrend → 1,064-day expansion remains one of the cleanest repeating geometries in financial history a rhythm that could either repeat once more or evolve into something far greater.
-CryptoPASOK

BITCOIN Did the 1W MA50 save the Cycle again??Bitcoin (BTCUSD) has now completed two straight weeks since the Friday 10 flash-crash of almost touching the 1W MA50 (blue trend-line) but managing to hold it and rebound. This is not the first time we see this pattern during this Cycle. In fact it is a frequent one that systemically fuels the 3-year Channel Up of this Bull Cycle.
As you can see, ever since the November 21 2022 bottom of the previous Bear Cycle, the current Bull Cycle has been trading within this Channel Up pattern, which after it broke above the 1W MA50 and in March 2023, turned it into its long-term Support.
More specifically, since that day, every time BTC broke and closed a weekly candle below its 1W MA20 (red trend-line), it dropped further to its 1W MA50 to find Support, priced the Channel Up Higher Low and rebounded.
This has happened so far 3 times (excluding now), in September 2023 it almost touched the 1W MA50 and rebounded but in August 05 2024 and April 07 2025, it marginally breached it and then rebounded. Based on this, BTC is currently at or very close to the new Higher Low (Support), hence a buy opportunity.
The only condition that hasn't been fulfilled, is the 1W RSI entering its 2-year Support Zone. If the 1W MA50 indeed holds and manages to keep closing the 1W candles above it, that would be an indication that the Bull Cycle is still in effect. The minimum rally a pull-back has given throughout the Cycle has been +92.44%, so as long as it holds, there are strong probabilities that BTC may reach a least $143000.
Do you share that model's optimism or you think the new Bear Cycle has already started? Feel free to let us know in the comments section below!
-------------------------------------------------------------------------------
** Please LIKE 👍, FOLLOW ✅, SHARE 🙌 and COMMENT ✍ if you enjoy this idea! Also share your ideas and charts in the comments section below! This is best way to keep it relevant, support us, keep the content here free and allow the idea to reach as many people as possible. **
-------------------------------------------------------------------------------
💸💸💸💸💸💸
👇 👇 👇 👇 👇 👇

20/10/25 Weekly OutlookLast weeks high: $115,965.44
Last weeks low: $103,546.52
Midpoint: $109,755.98
Following the flash crash of two weeks ago, Bitcoin opted for the "fill the wick" pattern last week with a steady continuation of the downtrend printing a low for the week 1.5% shy of completely backfilling the entire wick.
Because of the aggressive nature of the immediate recovery, I would estimate that a large number of stop losses would be placed just under the bottom of the flash crash wick and so as price approached that level, buyers stepped in to move price away from that danger area. I am still not convinced that $98,000-102,000 area is safe from a revisit, but when is a question I do not have an answer for.
This week we've seen an early move by the bulls to flip a very important $108,000 level. I could see BTC conforming to the weeks range quite strongly as both extremities of the range as well as midpoint line up very well with HTF S/R levels. I think any PA between those levels would give clues as to the strength of both sides, bulls and bears but the important moves will happen around the extremes. Of course the trade war news is a factor still in play as well as CPI later in the week.
This CPI release is also taking place during a government shut down, it's the first CPI on a Friday since 2018 and FOMC (rate cut predicted) takes place just 5 days after with massively reduced data releases due to the Government shut down. This to me is a volatility storm waiting to happen and many participants are going into it blind.
Good luck this week everybody!

Bitcoin - Will Bitcoin also cross $100,000?!Bitcoin is located between EMA50 and EMA200 on the four-hour timeframe and is in its medium-term ascending channel. In case of an upward correction towards the specified supply range, it is possible to sell Bitcoin with a better risk-reward.
It should be noted that there is a possibility of heavy fluctuations and shadows due to the movement of whales in the market and compliance with capital management in the cryptocurrency market will be more important. If the downward trend continues, we can buy within the demand range.
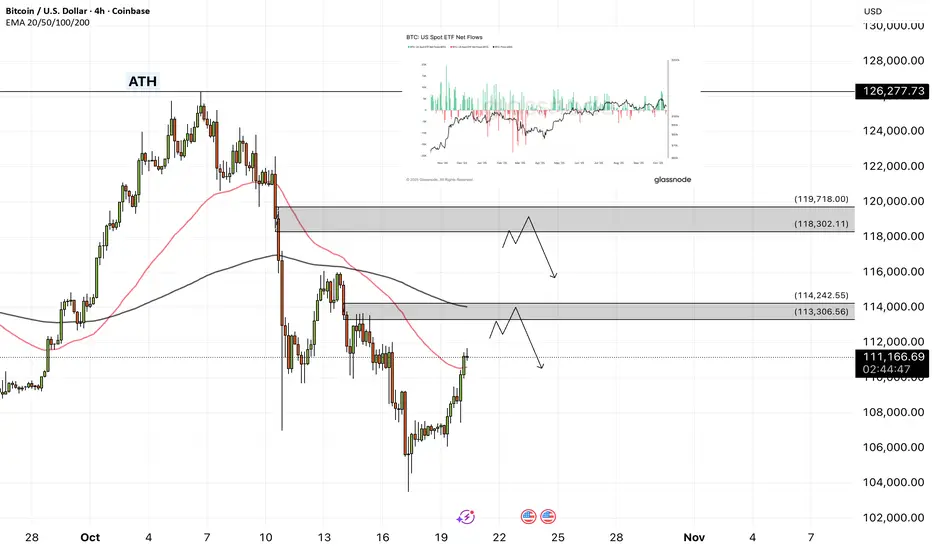
Bitcoin’s recent rally has stalled under macroeconomic pressures, marking one of the most significant events in the asset’s history. With capital inflows into ETFs slowing and volatility spiking, the market has entered a recalibration phase—characterized by deleveraging, cautious investor sentiment, and a reliance on new demand to reignite the bullish trend.
This latest price decline is particularly concerning, as it marks the third time since late August that Bitcoin has fallen below roughly $117,000, a zone where most large holders are now underwater.
Following the largest liquidation cascade in Bitcoin’s history, capital inflows into U.S. spot ETFs have weakened alongside price declines. At the same time, the derivatives market has seen a sharp reduction in leverage, while ETF investors have shown mild selling pressure, resulting in a net outflow of about 2.3K BTC so far this week.
Unlike previous capitulation phases, where outflows typically accelerated price drops, the current slowdown reflects hesitation rather than panic. However, if weakness persists or ETF inflows take longer to recover, it could signal fragility on the demand side, undermining one of the core drivers behind Bitcoin’s past rallies.
During the recent liquidation wave, spot trading volumes surged to some of the highest levels of the year, reflecting intense market activity as traders rapidly adjusted their positions amid heightened volatility.
...دادهاند
In Q3 of this year, the number of publicly traded companies holding Bitcoin on their balance sheets hit a new record — despite ongoing market turbulence. According to data from Bitwise Asset Management, the number of listed firms with Bitcoin holdings grew by nearly 40% in just three months, reaching 172 companies.
Still, a recent October survey by Bank of America shows that 76% of investors currently hold no exposure to cryptocurrencies, up from 67% in September. Even among those with some allocation to digital assets, exposure remains minimal:
• 3% of investors hold only 2% of their portfolios in crypto.
• 1% allocate around 4% to cryptocurrencies.
• 3% have 8% or more of their portfolios invested in digital assets....
BTC 4H Analysis | Day 5🥳 Hey everyone! Hope you’re doing great! Welcome to SatoshiFrame channel .
✨ Today we’re diving into the 4-Hour Bitcoin analysis. Stay tuned and follow along!
👀 After breaking out of the descending channel and confirming the long setup I explained in the previous post, Bitcoin moved upward and easily broke through its Maker-buyer zone.
🔍 Over the past two market-holiday days, Bitcoin consolidated in a multi-timeframe accumulation phase with a ceiling at $107,356, which was easily breached. The price then advanced toward its higher-level key resistances. It’s now trading between $110,500 and $113,000 — the $113,000 zone is our long trigger since price has struggled there multiple times before. This makes it a bit risky, but if the upward movement continues, the next resistances could be at $115,800 and $120,836.
🧮 Looking at the RSI oscillator, it has comfortably passed the 50 level on the 4-hour chart and is now heading toward the overbought zone, facing a key resistance at 70. This 70 level overlaps with the 50 zone on the daily timeframe, meaning that if RSI enters overbought on the 4-hour, the daily will just be shifting from a bearish swing phase to a long-position momentum phase — so the 70 zone is crucial.
🕯 If you check the lower-volume section of the chart, you’ll notice something interesting: the breakout above the two-day accumulation range came with a clear rise in buy volume, which helped Bitcoin easily break both the resistance area and the descending trendline (the upper boundary of the previous channel). This suggests Bitcoin may soon take a volume or price correction to gain more strength for another upward move.
⏰ During today’s New York session, we might see some strong moves. Remember last week when U.S. investors were selling off their ETF holdings, and the market was hesitant to buy? That fear caused weak participation. This time, we may have a reason to stay active during New York hours as sentiment shifts.
🧠 Here are the two key scenarios to watch:
🟢 Long Position Scenario
Wait for Bitcoin to react either to the micro-buyer zone or to the $113,000 area. If we see a pullback followed by an indecision candle (confirmation setup) touching the SMA-7, that’s our entry cue — ideally with a tighter stop size.
🔴 Short Position Scenario
Ignore shorts for now. Bitcoin already completed its second downward wave with an imbalanced slope, and over the last two days, seller momentum has weakened. Buyers are now driving price through resistance levels, so shorting here would go against the current flow.
❤️ Disclaimer : This analysis is purely based on my personal opinion and I only trade if the stated triggers are activated .

BTC - NEED MORE CONFIDENCEMorning folks,
So after our Thu conversation BTC has collapsed to ~ 105K. So, our suggestion has been confirmed, although we have not planned any traders.
Now it is trying to show the bounce. This is great news, but somehow I do not want to hurry up with long entry, and prefer to get more confirmation.
For example, if we would get this reverse H&S pattern - this will be at least something.

Bitcoin Price Outlook: Testing the $97,800 Support ZoneHi there!
Let's analyze Btc!
Bitcoin is currently moving inside a clear descending channel, showing consistent lower highs and lower lows. The price is likely to continue its downward movement until it reaches the daily support area around $97,800.
This zone appears to be a promising area for long-term opportunities. Still, traders should wait for strong confirmation signals before entering, as a reversal will only be valid once momentum shifts from bearish to bullish.
