Bitcoin relief rally before CAPITULATION to $20K!In February and March we talked regularly on the YT channel about how Bitcoin's primary and secular trend lines were far too steep to be sustainable. Well, that was quickly redeemed by a deep and long-lasting price- and time-based correction. The primary and secular trend lines now merge nicely on the weekly log chart (if drawn as internal trend lines rather than external). You can see those lines on the daily chart too.
In March and April we talked about how Bitcoin would go down to $42 000-45 000 and how that would beautifully complete an ABC 4th-wave correction. This thesis, however, was nullified once the price broke below $42 000. And the reason for this is because the corrective A- and C-waves should technically be of equal or similar length, either in raw numbers or in percentages.
Now it rather seems like we're in the midst of a much bigger ABC correction - a zig-zag (5-3-5) in which we have just completed the A-wave and initiated the B-wave. Based on the diagonal primary and secular trend lines - which would act as a magnetic force should this ABC-correction play out within the 4th wave - then we can reverse engineer the B-wave target. The A-wave caused a -55% drop in itself. That means the C-wave should be of similar magnitude.
The $46 500 level perfectly aligns with that calculation, from which a -55% drop would land Bitcoin in the low 20 000s and right on the diagonal primary and secular support line. This area also perfectly coincides with the 0,5 fib and a diagonal resistance level. For as we know, fibonacci levels tend to be particularly reliable when it comes to Elliott Wave Theories.
Last week I announced that Bitcoin was in for a bullish reversal amidst the $28,600 drop. Now those technicals are coming together in strength. We might be in for new all-time highs, but there's a greater chance Bitcoin will be rejected at this very technical $46 500 level. The only thing I want you to take with you from this piece of analysis is that that very price zone ($46 500) is a danger zone and it stretches all the way up to the mid $51 000s as Bitcoin could very well feint us all by reversing at the 618 fib but for a $24 000 capitulation C-wave bottom. Anyone who trades actively may want to get out of the way in this 12,50% danger zone. The risk to reward for staying/hodling in that range is absolutely horrible.
Long Life Trading
Bitcoincrash


"Bull Run has come to End!", Historic Data of Bitcoin suggests!Hey guys,
I'm up with new analysis, a new idea about BTCUSDT.
Here you can see a bold red curve which is actually the famous 11-years-resistance line (actually from the time Bitcoin is launched). Past data shows that whenever we touch this resistance, the bear market starts.
Here is what I have noticed:
"0.618 fib level and bear market targets"
In 2011, the price of BTC reached about $34 before dropping to about $2.5 which lies at 0.618 fib retracement level.
The principle of this analysis is that for the next bear market, we can calculate the approximate bearish targets using the fib retracement tool, putting 0 fib level at the 0.618 fib level of the previous bull run. Then we will get to know the bearish targets for the bear market i.e again at 0.618 (61.8%) level. I know this is surprising but yes, it has been working since BTC trading has started.
Following this principle:
In 2013, 61.8% fib level was at around $123 and the price retraced to $155 from $1269 in 2015.
In 2017, 61.8% fib level was at around $3091 and the price retraced to about $3100 from about $19000 in 2018.
Now in 2021, 61.8% fib level is at around $20357 and the price is expected to be retraced to this level. The current price is $31434.
Also, just to remind you that I have also shared an analysis 9 days ago entitled "Bitcoin in Range: Can continue to be more bearish" :
In conclusion, I would say that technically it is the start of Bear Market and my bearish price targets are $20357. After the targets are hit, BTC price will continue ranging below 21EMA until the start of the next bull run which historically starts just before Bitcoin Halving and gets sped up after the event of halving. Next Bitcoin Halving is expected around February 2024.
The good thing is: As Bitcoin will continue ranging with Bitcoin Dominance low, Alts will pump hard but to make this happen, we need to eradicate or maybe lessen the fear in the market.
Muneeb #SyedMuneebAli

Bitoin Shock TherapyBitcoin price did a -45% correction, so far price went below DMA200, which is indicator for long term traders/investors and if we will stay below it for reasonable amount of time, that would sinalize further dump.
IF price will manage break upside above DMA200 and stay above it, we could be safe in the long-term goals, and see btc floating around 100k by the end of the year.
Stay calm, make sure you running affordable risk.

Bear or Bull Market? Judgement DayHi guys,
MA200 is the strongest support line of Bitcoin and has been in the past years.
If today's candle closes below MA200, it is a sign that we might go lower and fall into a bear market.
But if the candle closes above MA200 (ignore the wick) we may bounce back soon to a bull market and a great opportunity to buy more.
The RSI and MACD are pretty low, so a reverse trend should happen but crypto is always full of surprises.
Today is Judgment day, Bulls & Bears are fighting for a decisive future.
Trade carefully!

Bitcoin about to fall to 45K - See this chartBitcoin is forming an inverse cup and is surely going to fall.
The Elliott correction wave theory also supports this.
According to Elliott wave theory, after every 3 bull runs, there are 2 bearish runs - each bigger than the previous.
This can be seen in April's chart when bitcoin first fall on the 18th and then was seen regaining strength, but it fell big on the 25th.
Similarly, the fall you saw was the first one and what's happening in the market right now is short gain. The next fall is going to be bigger and bitcoin is likely to touch 44400.
Follow me to see more such trade analysis regularly.
#NFA #DYOR


I'm seriusly concerned about this (huge divergence on btc)As we can see in the charts there is a huge divergence between the price and the indicators, the volume is deeply sinking and the rsi tells us the same.
By the way, this is just a technical analysis where nobody knows what will happen. Besides coinbase launches on the NYSE, almost every altcoin is reaching all-time-high, every day we see a new big company joining to bitcoins party.

The end of the bull run for Bitcoin - This time is different 80kHello Guys and welcome to this analysis about Bitcoin!
We all know about the current bull run for Bitcoin but the question is. When will it end?
Well if you ask me it will happen very soon and I will explain it to you very detailed.
Remember Bitcoin has always done the same in the past.
The history is repeating .
Price Prediction
Searching on the Internet about the Bitcoin potential Price Prediction you will find a lot of theories about that. The Super Cycle, the Stock to Flow Model and many mores. They all claim that this market will go crazy to the upside. Now there is nothing wrong about these theories. I also agree with them when it comes to the final Target for Bitcoin. I also see it going up very easy till 1Mio . I do not doubt this. The usecase of Bitcoin is insane and everybody who puts a little effort in doing some researches about it, will understand this.
Investing
Now to the more important part. How will the Price develop in the near future so I can take advantage of it and make some money. Is it good that I am currently in Bitcoin? Should I hold it?
Well when it comes to Bitcoin as an Investment you should definitely hold it. Long Term holder will benefit the most of this movement. But if you are not in this market yet what should you do now?
Well right now if you will buy Bitcoin and you will hold it long term there is absolute no problem. If you look back at the chart no matter at what time you have bought bitcoin you are in profit or around break even. Key is to hold. This is the reason #1 why people are losing money in bitcoin. They do not hold it long term. This is also the reason why the market will give us extreme drawdrowns in Price, so most of the investors will get emotionally and leave the market.
Should I buy Now?
But if you ask me if you should buy Bitcoin right now then I would say definitely NO! I expect some serious drawdowns on Bitcoin in the next couple months. I can not provide you a specific date but I can provide you specific numbers. I expect in the range between 78-82k a big drop of -86%
Everybody will just ask me if I am crazy. No I am not. From my point of view that would be the most logical scenario right now, why?
Cycles
If we have a look at the Bitcoin Cycle we will see that the history has repeated exactly the same. I will refer to the bull run from 2012-2013
We can see that the market went up around 12000% . If you compare it to the bull run 2015-2017 you will notice the exact same number.
Also both correction were almost the same: 83%
That is crazy. Now we have even more similarities for that. We can spot a triangle Pattern and a Inverted Head and Shoulders Pattern.
Now if that was the same that means the current move to the upside is that bull cycle that brought Bitcoin end 2013 till 1000$
If I am applying right now the same Fibonacci and the same Percentage Growth then I come to the target between 78-82k. Of course this target can varify a little bit as we have seen the % are not 100% the same.
Therefore we can expect right now the market to go up till that area and to drop afterwards -86% and to come to the target between 11-15k . That drop would also test the inverted Head and Shoulder Structure exactly like in 2015 the market did.
Additional Confirmation
We can also spot at the same area a Trend Line Resistance which can also be an additional confirmation.
If the price will drop during 3-4 day about -40% then we have our final confirmation that the market will go for that -86% drop
Institution:
Now people would say this time is different. We have big institution who bought Bitcoin. It is not possible that the price will drop that much. Well that is true that there are big institution like Tesla who bought Bitcoins. Well they did around 30k because it was only around that specific date time possible to do this for them. But remember. Those are long term holders. No matter what they will do they will end up as winners. If the market will reach that level they can realize their profit. Which would be about 3x. That is very good money for such an institutions. And if they will not do this they would hold it during the whole drawdown and probably buying some more.
Now the thing is that there is still the higher power who could always bring the price down. Whenever the Supply will be given the market will drop hard. Very hard. That is just normal economic cycle.
Final Thoughts:
From my point of view this market is very exponential already. After such an exponential growth the market needs at some point to give us a big drop. Imagine the Bitcoin Price at 80k. So many financial institutions, hedgefonds would be in big profit. That will mean for them positive year. They will all close from my point of view. No matter how much higher Bitcoin potentially could go. They will rejoin the market for sure. But probably at a lower price.
Also remember to the end of 2017. Nobody thought about Bitcoin would drop -82% Nobody! Only 1% have been exiting at the top because they know exactly how the economic cycle works and they have been master in technical analysis. They have been just counting 1 with 1 and I am doing it right now the same. I strongly believe that we have right now the same setup like in the end of 2013. To many aspects are showing me the same. Also right now the media is telling us to buy bitcoin. At that high price? No thank you. Following the media has been always a wrong decision. I am looking to attack and to rejoin at the lower price. From my point of view it is better to realize the profits before this big boom. When it comes to this markets it is always better to be a little bit more pessimistic to not lose that % gain. Me personally of course I am going to hold some of my Bitcoin in my portfolio longterm but definitely I am going to realize some of the profits before this big BOOM.
Thank you that you have been reading this post till the end. It really means a lot to me.
Let me know what you think about this idea in the comment. This post is just my personal opinion based on my knowledge for the market and the researches I did.

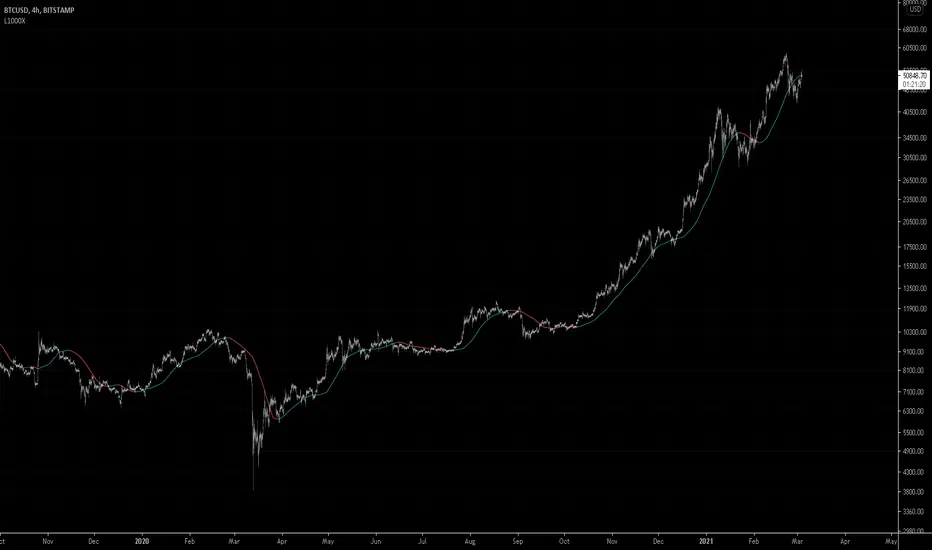
Bitcoin, 2021 Crash incoming?Hey Traders,
2020 was a crazy year for Bitcoin and Cryptos overall. We have witnessed Bitcoin defying everything and surging %1,200 since March 2020.
Are we currently witnessing end of the Bullrun? Lets do some technical analysis!
1) Looking at volume we are seeing constant decline - this represents exhaustion of buying power.
2) On weekly chart we see that Bitcoin is extremely overbought and it needs urgent correction.
3) On oscillator we are witnessing bearish divergence - this represents trend change (Bearish in this case)
4) Bullish trendline on weekly is being broken, we will see if weekly candle closes below it which will be a very bearish case. (Its broken on all lower timeframes including Daily)
Lets see if this is the end of the Bull Market. I will be monitoring Bitcoin closely from now on.
Stay safe and happy trading!

IS THE CRYPTO MARKET ABOUT TO CRASHLIKE 2017?Greeting This is arsalan here. I am a forex institutional market trader and cryto trader from the past 6 years but never shared any of my idea here so this is the first time.
The thing I noticed to share this chart with you guys is that to stop facing big losses.
CHART ANALYSE:
The naked chart showing down below is the weekly chart of bitcoin/usdt pair. I am seeing the bearish divergence on weekly time frame and it never happened before since the last crash of 2017. The market is making higher highs but the RSI of period 14 is making lower highs. That is the indication of bigger crash that we may see in the coming years.
Done for now but from now onwards I will keep share my ideas here with you guys free of cost so follow me for future analysis.
Thank You!!
Best regards: Arsalan aka binaryTrader :)

Bitcoin Following Projected $100k-300+ Target ChannelYeah I know it sucks for Bitcoin to drop so massively and destroy all short-term hopes for a continued uptrend without "downward disturbances".
I anticipated the drop and predicted it on Jan. 7
Still it caught me off-guard and brings a bit of annoyance and call for patience.
To the chart we go and let's check back with my Bitcoin channel prediction (see related idea).
The prediction analysis can now be tested. The upper Bollinger Band has been breached downwards.
So Bitcoin either is able to close above it or I would expect some more losses to -30% (~$29k) or -40% (~$25k) from the ATH (~$42k)
In case Bitcoin closes above that swings momentum back and gives Bitcoin the opportunity to remain fully bullish the following weak.
Best case scenario would be for Bitcoin to close at or above $38,2k end of this week. Then the 22$ drop was just a short lived "glitch".
The path Bitcoin is taking also will give an indication to what stock-to-flow trend line it is following.
Right now it would appear to be the 100k mid-May, which would indicate a quicker uptrend and a more parabolic move upwards starting mid-February and aiming at $300k.
As we have suffered already a 20% loss in price I remain bullish and consider the current price level a welcome opportunity to average into Bitcoin.
Be aware there is however an additional 20% price loss possible to keep some of your powder dry and make sure to put tight stop-loss orders in.
** Please support this idea with your likes and comments, it is the best way to keep it relevant and support me. **
--------------------------------------------------------------------------------------------------------
!! Donations via TradingView coins also help me a great deal at posting more free trading content and signals here !!

BTC Starts Correction. Now let’s find suitable entry points!As predicted, BTC failed to make new highs, stopping just short of $19,500. The coin has now started an overdue correction. Now it is essential to find where it will bounce back so we can enter once again!
Support Levels
Finding suitable entry points goes hand in hand with finding the right support levels. The first support level stands at $17,000, where BTC made a small comeback at the start of this correction. This level is important as it was the last main resistance in Bitcoin's path to the all-time high. However, due to Bitcoin's outstanding growth from $10,000 to $19,500 in just two months, the correction is more severe and has already stepped past this point!
The next support level stands at $16,000. This level came into prominence this year, as it held Bitcoin from pushing higher repeatedly. This level is likely to be hit, as after a strong bull run, a mild bear market is to be expected. Currently, Bitcoin has bounced near this level twice.
Lastly, we have the $14,000 support level. This level is critical as it was the highest price we hit following the 2017 bull run until November 2020. It also acted as a major support holding Bitcoin above it throughout much of 2018. BTC may head to this level in case of a "severe" correction. Yes, Bitcoin can go lower. However, due to the strong momentum, optimism, halving, and entrance of institutional investors, the price will likely hold above $14,000.
After bouncing on one of these levels, we are likely to see revisit the all-time high. However, it may take a while before we break it.
Strategy
The 5 and 200 EMA crossover is among the best strategies on the 1h chart. With a 0.01% commission, the strategy would have made a stunning 415% return from 2019 up until the present. While backtesting is not the same as live trading, if you backtest for long enough and throughout different market conditions, then you will likely see similar results in your live trading. Therefore you can also use this strategy as your next entry point.

Do NOT Buy Bitcoin. It's Going To Crash!!! Would you buy and why? It went all the way to 20K and then crashed all the way to 3K!

Bitcoin Crash, INCOMING?! *Death Cross*?Hello, I am a fairly inexperienced trader who has been researching the "never below 10k again" theory, but I think I found a frighting pattern on accident.
Can someone with real TA skills please me this is a real? If it is, I"m going to be sick to my stomach.
Thank you, Cheers
ibb.co

BITCOIN. WHAT CAN WE EXPECT THIS WEEK?Hello traders, and welcome to this crypto corner, I hope you had a wonderful week.
from our last analysis, we expected btc to make a retracement from 10k region to the upside around 11k region, which we can see on the chart..
so, what's next for bitcoin?
last week if you can recall that after the wave 5 truncation, I started labelling a wxyxz correction. initially, I like to start my analysis with letters. then when the move is done, we can adjust the symbols.
what matters really is not the symbols, it's the direction of the market.
imo, I think we started a 5 wave impulsive move to the downside from mid august after the 12.5k huge resistance. I'll adjust the symbols once the move is complete
what do we expect now on bitcoin
we expect a move to the downside, a big one, you know I think things can go real south in coming weeks.
is 9k possible? Yes... oscourfe.....lol
is 8k possible? depends, if traditional market experience huge losses in coming weeks.
now, I'm sure you're about to ask is 7k or 6k possible? well maybe, maybe not. let's focus on the move to the downside, and I'll be updating you as we move
follow me, and let's take profit together.
VERY IMPORTANT: Hitting the "Like" button is like a tip, please don't forget to do so after reading, this is your way of appreciating my effort and encouraging me to post more free analysis and updates.
if you enjoyed this free analysis and update, make sure to hit the follow button to get more free updates, like, share and drop your comments below, and I'll see you shortly
have a wonderful week trading,
safe trade
trade responsibly
namaste traders

#BITCOIN - Triangle Pattern In Elliott Wave Theory - Part 2 -BTC Decision Time
Will the $9K Fortress Fall?
There is a seriously crazy amount of stuff happening in the world!.
- Global pandemic.
- A very just and long overdue fight for equal rights.
- Economic turmoil.
The list can certainly go on, but we'll only add one more thing to it — DECISION TIME FOR BITCOIN.
It is very likely that Bears will once again storm the $9K BTC fortress, but will they finally succeed where they have been soundly defeated on several recent occasions?
The Last weeks, bulls were routed, trounced , decimated , by staunch $10K defenders when it blasted clear of the five-digit mark only to violently crash back into the $9,000 region.
Here are a few of the predominant factors holding BTC under.
Focus on Traditional Markets
Retail traders are nowhere to be found, as has been the case since civilians were completely and utterly "REKT" after the 2018 bear market.
That leaves the vast majority of price action up to the pros who have a lot on their hands as of now. Compared with traditional market traders, there are far fewer traders whose sole focus is on cryptocurrency.
Meaning most traders are dabbling across several different types of assets — and not all of them digital . With the irrational-but-widely-accepted ongoing bull market in the Dow Jones; S&P500 and Nasdaq showing little sign of letting up, the spotlight on digital assets has dimmed.
There Is Still a Pandemic.
(In Case You Forgot)
Simply put, there is still a pandemic on. This thing is just throwing a curveball no matter how you look at it.
Currently, it is impossible to say if the pandemic is a boon or hindrance to Bitcoin's fortunes. But, logic might tell us that under such circumstances, an unabated rally to the moon is just not in the cards yet.
From prior experience, Bitcoin always loves a good counter-trend rally, with the recent move from the $3,000s back to $10,000 being another one for the books.
Nonetheless, the insecurity around the economy and the whooping America has taken at the hands of the virus (being the world's leading source of BTC trading activity) means the bull-case is still psyched out.
$10,000 Is a Major Psychological Hurdle!.
Certain numbers are powerful. For Bitcoin, 10,000 is just such a number. Try as it might, BTC hasn't been able to completely break free of the orbit caused by 10,000's gravity.
Even after posting major gains and sustaining prices near the $20K mark, the Bitcoin pendulum has swung wildly even without the myriad forms of turmoil seen today.
Getting near the $10K mark has already been a very wild ride, and breaking through it will be one, too.
The reason we've seen such swift rejection at or above $10,000 recently is that bears need to exert immediate and definitive downward pressure to keep the psychological barrier in play. Too much time spent above $10K will give hope and gather forces on the other side of the equation.
So far, bears have shown more power in defending their fortress, but the longer that fortress remains sieged by prices hovering nearby, the sooner we can hope it will fall.

Anytime 50 Weekly MA did this brought a huge crash (Must see!)Hey everyone,
Recently I've been only focusing on the macro-level perspective mainly on the weekly chart. This one is very interesting...
Take a look at the 50 Weekly Moving average . Anytime it goes down pulls the price down too. It hasn't happened very often and when it did in 2014 and 2018, massive price dumps followed.
It seems like today, 50 Weekly MA is pointing down and getting ready for a downward movement. If it goes down do you think the history will repeat? Please let me know your thoughts by leaving your comments below.
Please also take a look at my recent weekly analysis regarding my bearish view.

Short it Than BOOM! try to catch the falling knifeTrading strategy
I rarely post charts, but when i do it im always right;
Ive been trading bitcoin since 2013
1 day divergence from 10200 ~ 10400 usd
Rsi going lower, its not an asset so valuable now that SP500 is going to the moon.
Im shorting since 10200 usd levels, my first target is 8800 ( Rebound to 9200 than full short again to 8000)
Wait until gets to fibonacci 0.382 ~ 0.5 levels which would be 7500~7000 usd levels. For me it has to be that way to have a nice run up to 14000~16000 usd levels.

BTC Daily Analysis, Will we see 5200 Lows? Hey everyone, I will be trying to post more on my account. Been very busy with school and this pandemic but I for sure will try to expose more ideas. Recently, I've been looking to improve my trading and now I feel like I have finally come to a point where I'm starting to feel confidence in trading. I moved away from indicators, and all this crap. Mainly I look at price and see what it is doing. No, I didn't learn overnight, but I'm glad I never gave up.
I read a quote, it said "When you want to give up, don't forget why you started" and I think we all can see here what it can mean us traders. We always get hurt, we lose money, we change strategies, etc. But don't give up. Work hard and I promise you results will come. There is no easy way out of this industry, it's like a business.
If you want to be a doctor, you learn, you practice, you must work hard. Similarly, with trading, you must learn, take time to develop this practice, and then you will see success. Anyway that's my little motivation for you guys, on with the analysis:
Looking at BTC, we see currently it is in a very strong down trend, price looks to be forming a double top. We see some nice wicks, and a beautiful reversal pattern. This checks out for me. We see that there was a low that was previously created but it did not break the previous low, this could mean that the small rally up might be exhausted. Bitcoin could drop all the way to 5200 ish, but we could see a continuation of this forming uptrend if we fail to break 5200. On the 4HR, we also see a fakout to the upside, this shows great potential short for a little bit right now. 5200 seems like a great area to buy possibly, if we start to see some rejection there as well. Could form a double bottom too.
Cheers all, please provide any feedback or ideas you may also have. Feel free to follow, and like my ideas. Always willing to talk to you all. Happy trading and stay safe. <3

The Corona Virus Conspiracy ------ WAKE UP IT'S ALL PLANNED MartyBoots here , I've been trading the markets for 13 years and I have see this Panic before
What is unusual is that the Corona virus could have actually been used to manipulate the masses and even other countries
Who needs real war when you can just create a deadly virus
Anyway let me know in the comments what you guys think
Please like the Video to help my work
This is not my normal video , I just thought I would put it out there because there are a few very fishy elements to this situation , this is also evident in the charts

BTCUSD Elliot Wave 12345 ABC with bullish and bearish ScenariosGreetings everybody here's my analysis on BTCUSD. I have alternate possible Elliot counts as well as bearish and bullish scenarios with some of my fundamental views and thoughts behind Bitcoin and the current state of the financial markets.
For those too lazy to watch through, my primary count leads me to believe that this current dump is the possible end of corrective wave C.
If we hold 6k support we should move back up to the upper weekly trend line of around 9k and then we will have to see how price reacts at that level. If we cannot hold 6k support we are heading to the 49xx region and then if we cannot hold that the final support zone will be between 45xx and 32xx support zones which is confluent with the bottom weekly trend line and 78.60 fib retrace of previous bull run.
Key points to take from this is that we could potentially have an amazing buy opportunity on the horizon in anticipation for the halvening and not to panic.
Happy Trading :)
The information provided on this website is general in nature only and does not constitute personal financial advice. The information has been prepared without taking into account your personal objectives, financial situation or needs. Before acting on any information on this website you should consider the appropriateness of the information having regard to your objectives, financial situation and needs. Therefore, before you decide to buy any product or keep or cancel a similar product that you already hold, it is important that you read and consider the relevant Product Disclosure Statement (PDS) of the product provider to make sure that the product is appropriate for you. Before making any decision, it is important for you to consider these matters and to seek appropriate legal, tax, and other professional advice.
