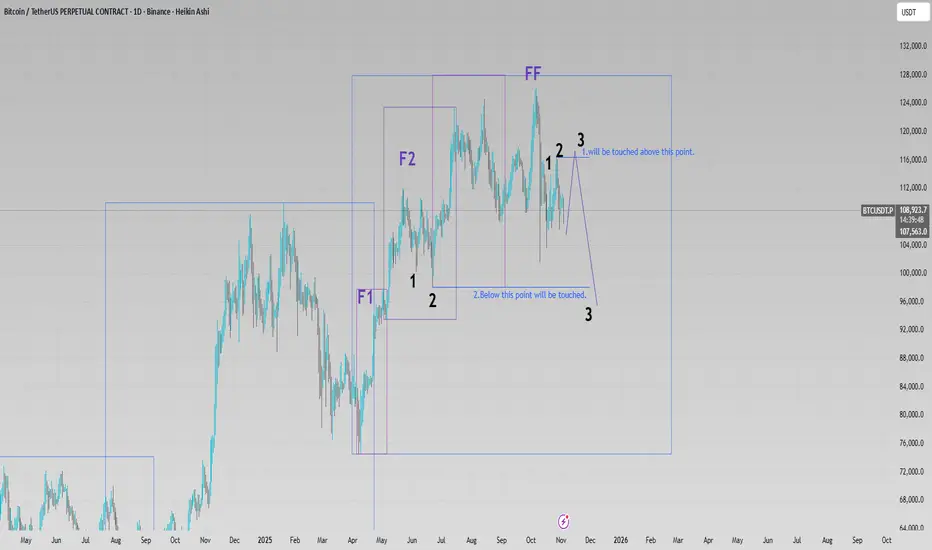
Bitcoinfutures
Bitcoin Monthly Candle Close color patterns since 2011 and ideasMAY Closes RED
A Quote from Last months post (March & April had closed Green)
The Arrows mentioned are no longer on the chart.
"The Arrows point to the 3 occasions we have had a Green March followed by a Green April.
2 of these were followed by a RED May and had a few months of Cool down before a continued push higher.
This points to the idea of a possible continued Range."
We got that RED May candle and it was not large.
For me, the idea of s continued Range / push higher, remains.
The range
Bitcoin CME Gap at $80,000 calls for bullish move after crashBitcoin Futures on the CME exchange is showing a very strong gap around a price level of $80,000. This implies that a bullish move can develop next.
This chart shows a bearish continuation pattern, a bear-flag.
It can happen that Bitcoin moves up to fill this gap right away. Or, there is a drop first and only afterward the gap is filled.
There is no time rule as to when a gap must be filled. It can either work as a magnet for Bitcoin's price or it can be completely ignored. Long-term, it will
Bitcoin Following a previous path but Accelerated and BULLISH
The Beauty of Data on a chart is that it is FACT.
So lets have a look
SMA colors
50 SMA - RED
100 SMA - Blue
128 SMA - Green
200 SMA - Yellow
Bitcoin followed a 2013 to 2017 Fractel for most of the recovery from the Deep Bear, from Jan 2023.
But in February 2025, PA fell off this Path, and so avoided a Parabolic rise and a Blow off Top.
We may have entered another Fractel but I am waiting for confirmation before talking about it.
But what IS happening is a very srrong similarity to the
WHAT IS CME GAP : Do They Always Fill?What Are Bitcoin CME Gaps?
As said earlier, the Chicago Mercantile Exchange closes for the weekend, observing trading hours from Sunday (5 PM ET) to 4 PM the next Friday. For most of their offering, this presents no problem, but Bitcoin keeps moving while the CME closes up the store. This can have big consequences for CME traders, as some of the bigger moves happen right in that time frame. In some cases, this causes them to miss out on great trading entries.
How To Identify CME Gap?
Let’s look
Bitcoin Futures H4: Bullish Trendline Rebound Toward $103KBased on my analysis of Bitcoin futures on the 4-hour timeframe, the market remains in a clear bullish trend. Price has recently rebounded from the ascending trendline, reinforcing bullish momentum. As long as this structure holds, there is a high probability that Bitcoin could continue its upward move toward the $103,000 area in the coming days.
Bitcoin ascending channel and Cups -Next cycle Cup entered ? YES
Bitcoin ascending channel and Cups -Next cycle Cup entered
PA entered channel in march 2017 and has never left, other than to go to ATH.
Bitcoin has spent more time in and above this channel than out of it.
Since entering channel, PA has always bounced off the lower line of channel
For the sake of this post, we are assuming that the current ATH is the final one this cycle.
Reasons why this maybe the case are listed below.
The Cups ( the yellow Semi Circles ) go from the ATH and the tops are
The Double Bottom Trap That Traders Might Miss1. The Comfort Zone of Classic Patterns
Few formations attract traders’ attention like a double bottom. It’s one of those timeless chart patterns that promise hope after a long decline—a visual story of selling exhaustion followed by a bullish reversal.
But markets rarely reward what’s obvious. In futures trading, especially when examining instruments like Bitcoin Futures (BTC) and Micro Bitcoin Futures (MBT), patterns are only half the story. What truly moves price isn’t just the shape on th
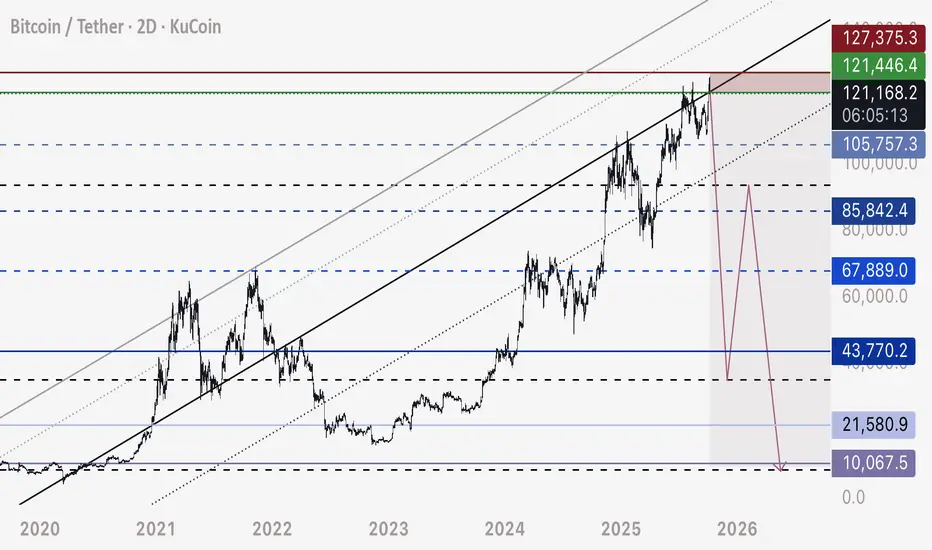
BTC - Trade Setup Today for my Flash Crash Plan Branching off my previous two posts today, which are linked below and give an in depth analysis and theory behind this idea and plan, here are the details of my short trade on Bitcoin.
Entry - 121,400 to 121,700
Stop Loss - Keep it Tight at 127,400 in case Bitcoin moves up to 126,800 to form the head of an inverse head and shoulders (unlikely but I keep two direction ideas in mind always)
Take Profits:
105,700 - 10% Closure
85,800 - 10% Closure
67,900 - 20% Closure
43,800 - 60% Closur
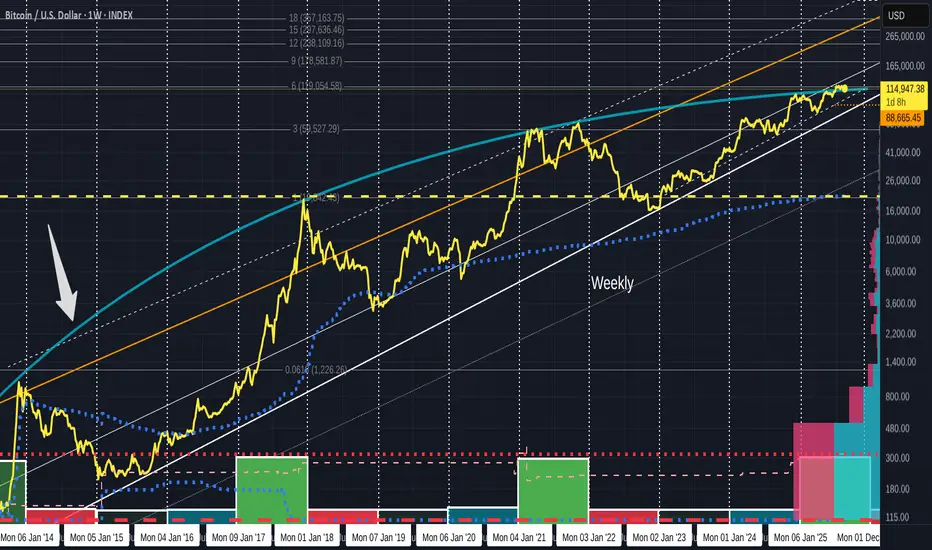
Where is Bitcoin on the LONG Term resistance since 2013? ARROW
To recap, that Blue Arc that has rejected Bitcoin PA ever since it rose into the Channel.
The Arrow points towards it.
This is the ONLY line that has rejected EVERY ATH since 2013 and is a part of a calculated Fibonacci Spiral.
I have posted the details and shown this in another post.
SO, as you can See, PA has begun getting squeezed by this and the long term rising line of support below. PA has never dropped below this line since rising over it in 2012.
The Crunch point of this squeeze is in
Bitcoin Daily shows us that a HUGE Hurdle has been crossed
The question I will answer in this post is "What is the significance of that Blue line that BTC PA is now sitting on"
On the Daily chart, we can see it has been tested as support and Held.
Previously, it was resistance..
So what ? This has happened many times before.
Lets zoom out and look at the weekly.
So, we see that the Blue line was also the rejection zone in 2021.
Infact, if you look, it has rejected BTC PA 5 times since March 2021 and we have finaly managed to get over it and seem to
Bitcoin: The CME Futures PREMIUM, New All-Time High ConfirmedOk, you got me, I will reveal my secrets to you. I only do this because I love you and I want to give you true value. Great content that you can truly trust because it is based on real market data. Just watch!
» Bitcoin CME Futures price: $104,425 (BOOM!)
» Bitcoin BTCUSDT Spot price: $103,600 (Checkmate)
There is a premium on Bitcoin futures price. This means the market is bullish, plain and simple. You can bet your house, a hotel and your wife on the fact that Bitcoin will soon hit a new All
Bitcoin Trajectory for Q1 and Q2 2025Hey everyone, it’s been a while! 👋
Let’s dive straight into the Bitcoin outlook and my vision for the months ahead. 🚀
Key Observations 📊
Patterns : Rounding Top & Bottom.
Rebound Levels:
Alt. 1: $101,000
Alt. 2: $82,000
Moving Averages : EMA50 & EMA188.
Target Area : $135,000+ 🔥
Pro Tip 💡
I'm setting an alert for the EMA188 cross on BTCUSDT to stay ahead of the game.
Stay tuned for more updates and insights! 💬
Bitcoin Cycle Update – Are We Nearing the Peak?Check out this BTCUSDT chart – we’re at GETTEX:92K today, and seems like things are heating up!
▸We’ve seen a Cycle Bottom in late 2022 - early 2023, followed by strong Bull runs in 2023 and 2024.
▸Those Consolidation phases (sideways channels) gave us the perfect setup for massive pumps!
▸Right now, we’re in a Pause Triangle after a big rally – but the Cycle Top could be just around the corner in mid-2025.
▸After that? A potential Bear phase – time to plan your m
Bitcoin Aligns with the 2017 Cycle ModelThere’s growing speculation that the current Bitcoin cycle mirrors the market behavior seen in 2017.
Intrigued by this, I conducted my own analysis. I overlaid the 2014–2017 cycle pattern onto the current chart for comparison.
The results?
A striking resemblance in both the overall shape and the distinct correction and impulse phases.
It seems history may not repeat itself exactly, but it certainly rhymes. 📊
Behind the Curtain: Bitcoin’s Surprising Macro Triggers1. Introduction
Bitcoin Futures (BTC), once viewed as a niche or speculative product, have now entered the macroeconomic spotlight. Traded on the CME and embraced by institutions through ETF exposure, BTC Futures reflect not only digital asset sentiment—but also evolving reactions to traditional economic forces.
While many traders still associate Bitcoin with crypto-native catalysts, machine learning reveals a different story. Today, BTC responds dynamically to macro indicators like Treasury
Bitcoin, Mind The Gap (85,720) The massive move initiated from Trumps tweet Sunday about the Crypto Strategic Reserve has left a massive gap on the Bitcoin Futures Chart. Gaps tend to get fill sooner rather than later, with a high 90% hit rate on gaps getting filled.
We could see a pullback this week to fill the gap with another run up following back above 90k to save the weekly close ... again.
We see confluence with the golden pocket (0.6128 - 0.65 Fib) here on that retracement and also the most amount of volume (VPVR) be
BTCUSD ConsolidationBitcoin is currently in a consolidation phase and gathering momentum to start a new trend, either up or down. The main consolidation range is between the 92,500 and 100,000 levels, and there is now a new consolidation range between 94,800 and 98,500. During this period, trading is not recommended, as it is uncertain which direction the trend will take.
$30,000 drop or $30,000 rise ?!!!This wedge can change the market outcome. If Bitcoin cannot break this wedge from above, we will see a $30k price drop. If the price breaks this wedge from above, we will see a $30k price increase. Now that most traders are disheartened by the crypto market and are selling their assets cheaply, I suspect that the price will go up.
Give me some energy !!
✨We spend hours finding potential opportunities and writing useful ideas, we would be happy if you support us.
Best regards CobraVanguard.💚
_
Bitcoin Forecast After 2024 - Why support at 82,000?Bitcoin's price at the close of December, marked by this inverted hammer, clearly indicates that a correction is imminent. However, the overall trend remains upward.
We will discuss the fundamental reasons why Bitcoin may have temporarily peaked in December 2024, as well as the potential support level around 82,000 this year. Let’s explore how we can manage Bitcoin following its peak above 100,000 as we move into 2025.
Micro Bitcoin Futures & Options
Ticker: MBT
Minimum fluctuation:
$5.00 per
Trade Idea 2024-12-30 and Review of 2024As the year comes to a close, we expect it to be a quiet week. If you haven’t already, now is an excellent time to set your trading goals for the coming year. Where will your focus be? Which markets will you trade actively? What is your risk management plan?
It is also a good time to complete a review for 2024 if you have not already! Keeping a trading journal is essential for tracking progress and learning from your mistakes.
Active trading, like other high-performance activities, requires r
Decoding the BTC-ES Correlation During FOMC Meetings1. Introduction
The Federal Open Market Committee (FOMC) meetings are pivotal events that significantly impact global financial markets. Traders across asset classes closely monitor these meetings for insights into the Federal Reserve’s stance on monetary policy, interest rates, and economic outlook.
In this article, we delve into the correlation between Bitcoin futures (BTC) and E-mini S&P 500 futures (ES) during FOMC meetings. Focusing on the window from one day prior to one day after each
Bitcoin Futures Confirming 3 Drives of Bearish Divergence
In the recent analysis of futures on the daily timeframe, a technical pattern known as the "3 Drives of Divergence" has been confirmed, signaling a potential trend reversal. This pattern, often associated with strong bearish momentum, has been observed with a divergence in the Relative Strength Index (RSI), further supporting the bearish outlook.
RSI Divergence: The RSI, a momentum oscillator, shows a bearish divergence where the price makes higher highs, but the RSI makes lower highs. This