APPLE ABOUT TO START A MINI BULL RUNStock market bubble has started to burst. Although we are already in a very young bear market which will last for a few years. So this kind of things don't play out overnight, there are many throughs and peaks in between. Looks like APPLE (AAPL) has completed the first impulse wave down. We have two reversal divergences between price ahd a fast Fisher transform (red one) and a reversal divergence on a slow Fisher. That is clear enough for me that this is a bottom. Target 195$.
Bounce

QCOM Earnings: Test of 2-year ResistanceQCOM looks like it wants to test it's 2 year support at the $50 mark. Secondary support is somewhere around $43. QCOM is coming off of a finished head and shoulders pattern, making its D leg downward. Typically a D leg is finished by a sharp reversal. In case of negative earnings, QCOM will likely drop well below the $50 support and have a sharp reversal upward. If earnings are positive, QCOM will likely bounce off the $50 support and make a less drastic reversal upward. Fisher transform also indicates the potential for an upward reversal. With QCOM's extreme debt levels, the FED put will serve them well going forward.

BTC trapping sellers before one more bounce?BTC is currently in a very important support zone on the daily timeframe (range low).
Although we've seen a large red candle two days ago, wicking into 3400s, there was enough demand to push the price back up and the daily candle closed back inside the range (potential swing failure pattern forming).
The low wick has taken stop losses below, but the sellers failed to follow the push down.
Ideally I would have liked to see the price fill the gap below and tap into 3250s and then bounce strongly to the upside, but we can't ignore what is currently forming on the chart here, which is why I'm posting this analysis.
For validation of this trade, we want to see a candle close above 3565, after which I expect that area to hold as a regained support (currently resistance).
Targeting the resistance areas above:
1. 3649
2. 3780
3. 3849 (less chance to be reached, but still within range)
If the bulls fail to take over here (3530-3476) and push this above 3565 (local pivot point), then I doubt 3430 (weekly support) will hold for long.
After a candle close below that level, we can expect 3330-3250 area to be reached next.

GBPUSD LongMy Personal Opinion on this market is a possible W Forming at this level and retracing, assuming that the Rejection of Brext played it's role in solidifying a lasting market structure, We could see a return to the previous High.

LUN Ready to Bounce Again - Just Wait for ItLUN (Binance)
Strong Support at 40K Levels
Every Time it Pumps Up from here strongly with 7% gains or more
RSI rising too
Buy Zone 4000-4200
Sell Targets: 4450 | 49000 | 5550 | 6666 | 8888

Short US Equities. The Dead Cat Bounce is Over.The market entered an important zone of resistance, formed by important support levels in the past. It is also failing to break through the 180 MA, where it has been rejected many times during this recent downtrend. We have also formed a double top, with bearish divergence shown on the RSI. As soon as we break resistance at 6530 with force, it will be a good short opportunity. I believe this was the completion of the dead cat bounce in the recent days, and we should now see a continuation of the downtrend. I will be playing this through SQQQ .

[ETHUSD] Ethereum interesting bounce areaCypher pattern with round number (100) gives us interesting bounce area.
Bear flag helps us to complete the Cypher pattern (y)

Pfizer - Time for a Dead Cat Bounce?The healthcare company develops a corrective structure after a bearish move started on Dec, 03. The close below $42 could activate a bearish move that should dive to PFE to the area between $38.89 and $37.59. The RSI oscillator suggests more downfalls.


RCN Bouncing Off From SupportRCN holding on to its support and has bounced off nicely. We can expect to see more gains on the price in short term.
Accumulate now.

Weak bounce increases the likelihood for this bearish scenarioWell, this bounce from 3200 is the most pitiful excuse for a bounce I have seen in a long time.
This shows that the support at 3200, which should have lead to a very strong reaction, a rally to upper 5000s, is quite weak.
I think we'll go below the MA200 in the near future. Maybe the structure will be different from the 2011 fractal, in that BTC just doesn't really do large bounces and dumps any more,
just a slow and long decline towards 1200, the high of 2013.
This means that the bearmarket will also drag on longer than expected, and only in the second half of 2020 would we rise again thanks to:
1. The halving effect
2. The stock market bearmarket probably over and new bullrun in stock indices (BTC correlated with stocks)
So, let's see if BTC bounces soon, then this might still be averted, but the likelihood fot this increases more and more.
The positive of this?
An entry at 1200 would be an insane opprtunity, since the ATH for next rally, even though it would occur later, say 2023 plusminus, would yield nice gains.
Also keep this chart here in mind: www.blockchain.com
Historically, when transactions go above old ATH, only then the beartrend stops, and BTC turns bullish. Never before. And it looks as if it will take quite some time until we
reach old transaction ATH.
So, I will be prepared for that scenario.

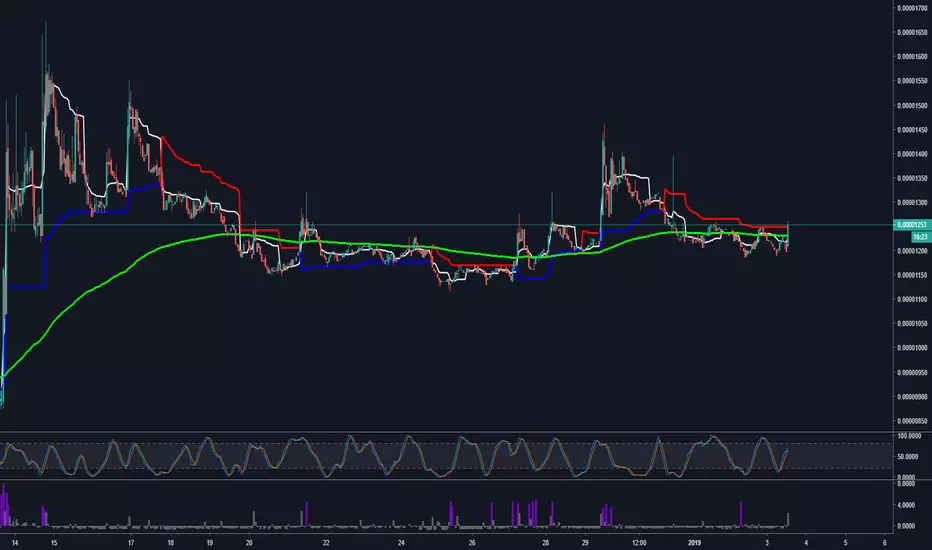
$SYSBTC Syscoin Short Term Long Channel Bounce 1 Hour Time FrameWatching a short-term 1 hour bullish engulfing candle bounce play off of support. I'm long at current level and looking for price targets at or above the 1460 satoshi area. Don't fall in love with her just trade the bitch! Viva La Crypto!
NASDAQ play update: 5.8k-6.5k? shortterm bull $nq1! $ndx $tqqqIt's late so I'm throwing this up quickly before market open. I'll update it later. My last chart worked out perfectly, we bounced off of a 0.5 retracement from 3.9k in early febuary 2016. I think we have at least 1-2 more days of upside on NASDAQ. My zones are defined on the chart. We bounced exactly on my teal support zone as predicted in my last Nasdaq chart, and I sold off some 12/28 TQQQ contracts at 3:55pm near at the height of the bounce.
In afterhours we're currently Bull flagging, probably getting to the .236 fib retracement around 6150. I'll be going long in the morning in anticipation of further upside, but I have a strong main objective to get a good short position on 1 of the indexes after this short squeeze rally. NASDAQ has been the hardest to push down during the past months, and it clearly bounced the highest yesterday 12/26. So I may look to the Russel and the S&P to short since they've been more bearish and I believe we have more downside over the next year.

Bitcoin is still bullish
On the scale of the month, we can clearly see that we are still moving in the descending channel. The formation of the extreme candle looks like a “reversal”, which gives us a good opportunity to jump to the upper edge of the channel, but it will be rather difficult and unlikely to go higher. In the case of achieving resistance of 5,000, the chances for a breakdown and fixation above are very small, to continue further to decline more likely, since the market still does not have sufficient volumes for a real bullran. Still adhere to the scenario that we are now witnessing a rebound of a dead cat.
The weekly scale looks positive, to maintain a bullish mood, we need to keep above the 3650 mark. On the month scale, there is still a strong oversold, but on the weekly chart RSI and Stoch RSI look positive, there is a rather bullish attitude and good chances for the upward movement. Day-to-day MACD also looks good. In addition, we can note that now we are in a zone of strong resistance and going higher will lead us to the area with little or no resistance, where we can get a rather strong bullish impulse.

Stocks Forming Significant Bottom: UpdateA somewhat more bearish scenario than the previous idea (linked) may be completing as we speak. The adjusted midpoint here is on Dec. 13 where the previous down move suddenly accelerated downward in a steep panic-selling type of move. Nevertheless this setup suggests that this selloff should be about done anywhere under the 2350 level and we should see a significant bounce this week.

Bitcoin : Christmas Dead Cat Bounce over ? What's next ? Hello traders.
Going to open a short position around this 4170 area at the next 4hr red candle for several reasons :
- We are around a 0.786 Fib Retracement from the previous 4.4k top and 3.1 bottom which is a key level for reversal.
- We are making a nasty bearish divergence on RSI, MACD and Stoch, they have proven their worth during this bear market.
- It looks like we might be forming a falling wedge, which is a bearish pattern.
- There is always a story of power in a trend which is most of the time defined by volume. As you can see, the volume on this last pump is really not significant compared to the overall volume of the move. It was a push that was showing that the current trend might be weakening, so we want to participate in the pullback. Looking to find 3541 as first target being the 0.618 Fib retracement of this upward move. Risk Reward ratio is 3, pretty safe.
What's next for BTC ?
From my experience, bottoms, real bottoms, never flatten out and then spring like the action we have seen this past week. Actual bottoms are violent formation with huge wicks in the candles, enormous % variation and very brutal action. I don't define the 3.1 low as bottom, therefore I think we will see lower levels in the beginning of Q1 or later this year. I don't want to hurt feelings of the newly found bulls on this platform but I think this is only a dead cat bounce that has had a violent spring fueled by FOMO and broken dreams. Now if this is a spring, we need to see if this was the end of the action or if there is more. Basically, the intensity and volume of the coming pullback should give us clues to whats next. If BTC manages to stand it's ground at the 0.618 Fib and look for higher prices, we might be able to make a medium term higher high before going to find the real bottom. If BTC fails to hold the 2 levels that are on the chart, things will probably turn pretty ugly.
Stay Open-Minded and Trade Safe.
Wishing you all a Merry Christmas and beautiful end of the year celebrations !
CR.
