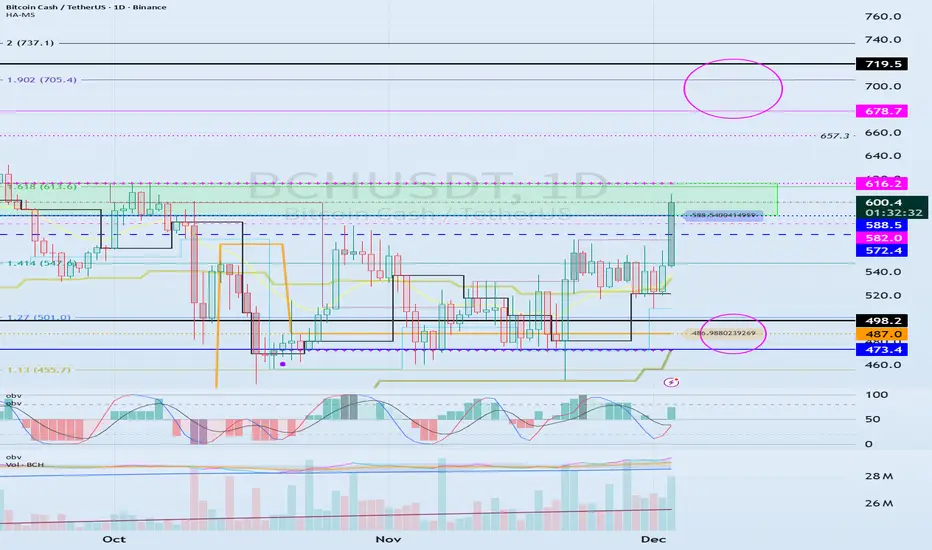
The key is whether it can break above 588.5-616.2
Hello, traders!
Follow us to get the latest information quickly.
Have a great day.
-------------------------------------
(BCHUSDT 1D chart)
The 1D chart is rising towards the HA-High ~ DOM (60) range, raising expectations for a bullish trend.
Accordingly, the key question is whether the 588.5-616.2 range can be supported and the price can rise.
If it rises, we should examine whether it can break above the 678.7-719.5 range, which is the range formed by the DOM (60) indicator on the 1M chart and the previous high.
To continue the uptrend by breaking above key points or ranges, the StochRSI, TC, and OBV indicators must show upward trends.
If possible,
- The StochRSI indicator should not have entered an overbought zone.
- The TC indicator should remain above zero.
- The OBV indicator should remain above the High Line.
Therefore, we should examine the movements of the StochRSI, TC, and OBV indicators when the price rises above the DOM (60) indicator.
If the StochRSI falls below 80, it's considered a stop loss, as further declines are likely.
-
Thank you for reading.
We wish you successful trading.
--------------------------------------------------
Breadth Indicators
SPX : Potential Zweig Breadth ThrustThe Breadth Thrust Indicator is a technical indicator that looks at how many stocks advance vs. decline over 10 days.
When it snaps from around 0.40 to above about 0.615 in 10 trading days or less, that’s called a Zweig Breadth Thrust and has historically lined up with strong bull runs more often than not.
Historically it doesn’t happen often, but when it does, forward returns over the next several months have usually been positive, which is why traders get excited when the line on your chart surges like this.
Historically, once a full thrust has triggered, the index has often been higher 6–12 months later in the majority of cases.
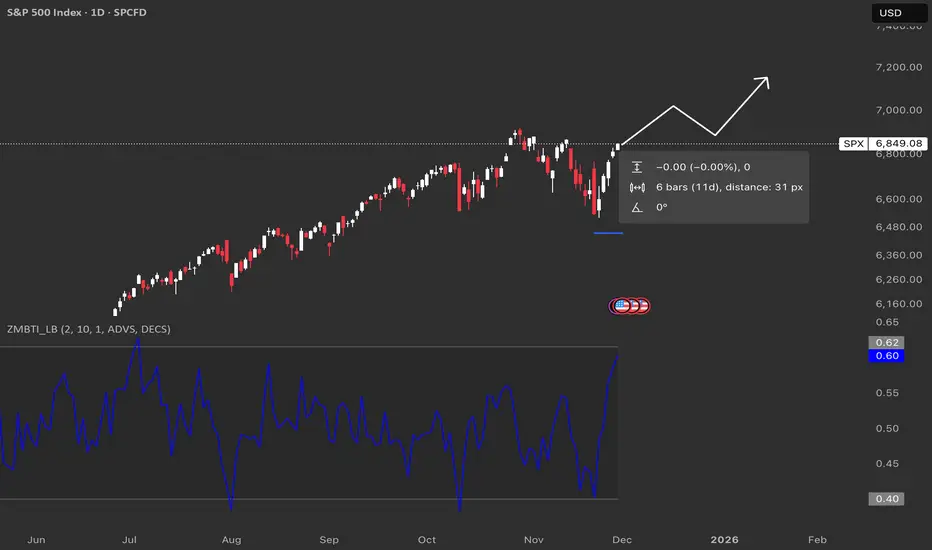
Hindenburg Omen Is Flashing AgainThe Hindenburg Omen has triggered, and it’s lining up with what the market breadth data has been whispering for months. If you look at the bottom pane, you’ll see the percentage of stocks above their major moving averages has been sliding for about six months.
So even though the index has kept pushing to new highs, fewer stocks are moving with it. A small group of mega-caps is doing all the heavy lifting, while the broader market slowly weakens underneath.
Historically, that’s exactly the kind of environment where the Hindenburg Omen becomes relevant. It doesn’t promise a crash, but it flags when internal conditions have deteriorated enough to allow one. Several past signals have occurred before meaningful corrections.
Why This Matters Now
The next couple of weeks are important. CPI, PPI and labour data between now and 10 December will shape expectations heading into the FOMC meeting. If the Fed changes tone on monetary policy, liquidity, or the path of rates, it will feed directly into sector rotation and capital flows.
That’s why I’m not committing to any major trades right now. The signals are mixed, breadth is weakening, leadership is narrow and policy risk is rising. Capital preservation comes first until we get a clear direction from the data and the Fed.
Sometimes the smartest move is patience. Let the data confirm the story. The market isn’t going anywhere.

Weekly and Monthly Forecast
Hello, fellow traders!
Follow us to get the latest information quickly.
Have a great day!
-------------------------------------
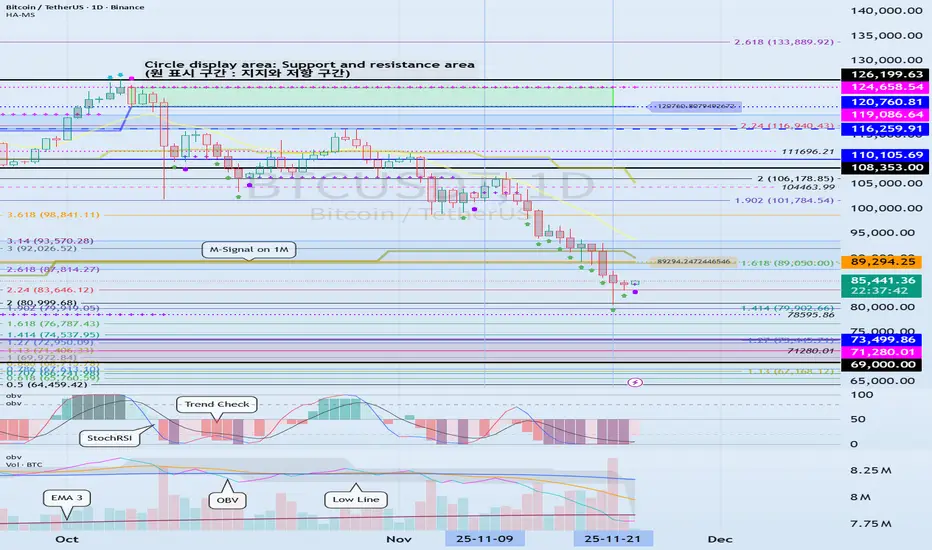
(BTCUSDT 1D chart)
The volatility period has ended.
The key is whether it can rise above 89294.25.
If not, we need to check for support near 69000-73499.86.
(1W chart)
The following are important areas as the price falls below the third range:
- 116259.91-119086.64
- 87814.27-93570.28
- 69000-73499.86
A decline below the 69000-73499.86 range can be considered a long-term downtrend, so this is a very important area for now.
Therefore, as the price approaches the 69000-73499.86 range, we need to check for increased trading volume or the emergence of a new HA-Low indicator on the 1W chart.
If the HA-Low indicator is formed, it's important to determine whether there's support near it.
The basic trading strategy is to buy in the DOM(-60) ~ HA-Low range and sell in the HA-High ~ DOM(60) range.
If the price rises near the HA-Low indicator and moves toward the HA-High indicator, the wave should be considered closed (reset).
Conversely, if the price falls near the HA-High indicator and moves toward the HA-Low indicator, the wave should also be considered closed (reset).
A closed (reset) wave means that the trend has been reestablished.
Therefore, as mentioned earlier, the basic trading strategy is created.
However, if the price rises in the HA-High ~ DOM(60) range, a stepwise uptrend is likely, while if the price falls in the DOM(-60) ~ HA-Low range, a stepwise downtrend is likely.
The end of a stepwise uptrend is a decline, and the end of a stepwise downtrend is a rise.
Therefore, a decline after encountering the HA-Low indicator is different from a decline after encountering the HA-High indicator.
Therefore, a stepwise downtrend indicates a period of truncation buying, while a stepwise uptrend indicates a period of truncation selling.
During a stepwise downtrend, even if the price declines, there's an expectation that a price increase will occur soon, so you can increase the number of coins (tokens) representing profit.
This method involves trading at each purchase price and selling the same amount of coins (tokens) when the price rises, thereby increasing the number of coins (tokens) representing profit.
The coins (tokens) representing profit are those with a purchase price of 0, which can lead to significant profits later.
-
A bullish trend can be considered when the price rises above the M-Signal indicator on the 1M chart and holds.
However, the point where you should actually buy is when the price rises above 108353.0.
Based on the current trend, the next volatility period is expected around December 23rd.
Therefore, you should check to see if the price holds above 89294.25 during the next volatility period.
Therefore, it appears likely that the price will move sideways to reverse the trend.
Based on the price movement, the start of a major bear market is expected to begin after the first quarter of next year.
However, if the price falls below 69000-73499.86, you should consider this a bear market and consider a response plan.
-
Thank you for reading to the end.
I wish you successful trading.
--------------------------------------------------
- Here's an explanation of the big picture.
(3-year bull market, 1-year bear market pattern)
I'll explain more in detail when the bear market begins.
------------------------------------------------------
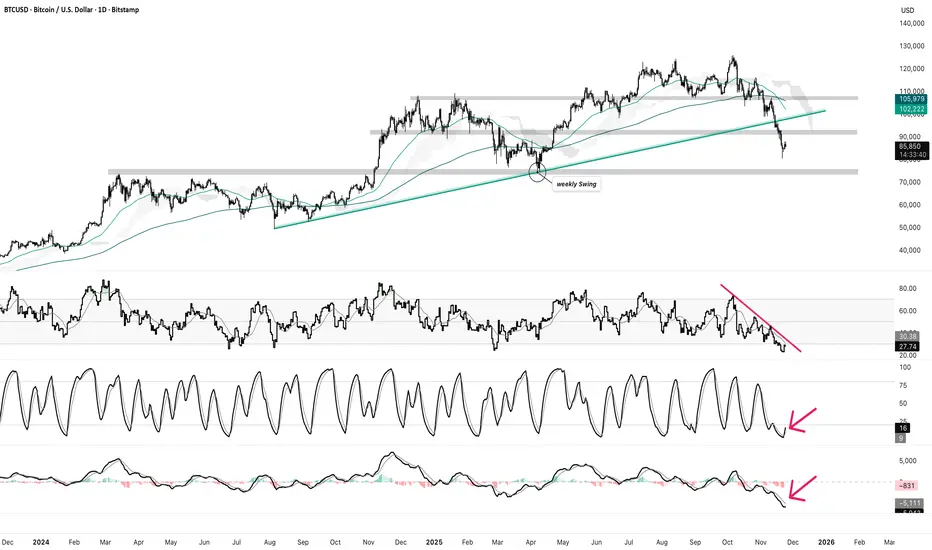
A Relief Rally Is Coming for BitcoinTo keep things simple, based on the oversold situation of DSS Bressert, RSI and MACD on the daily timeframe, it is obvious that a relief rally is certain at this point. The plummet of the "fear and greed" index is also of note. A bullish break of RSI should give the trigger to enter long with a stop below the "weekly swing" and risk being managed as always.
#NFA and always #DYOR
The key is whether support can be found around 89294.25
Hello, fellow traders!
Follow us to get the latest information quickly.
Have a great day.
-------------------------------------
(BTCUSDT 1D chart)
This period of volatility is expected to last until November 22nd.
If the price fails to find support and rise near the M-Siganl indicator on the 1M chart after this period of volatility, it is likely to decline to the 69,000-73,499.86 level.
Therefore, the key question is whether it can find support and rise near the HA-Low indicator level of 89,294.25 on the 1D chart.
-
(1M chart)
It is showing a downward trend, failing to reach the Fibonacci ratio 2.618 (133,889.92), which was considered the target level.
However, if the price maintains above the 69,000.0-73,499.86 level, it is expected to maintain an upward trend in the long term.
-
(1W Chart)
If the price rises above the HA-High indicator, it is likely to form a stepwise uptrend.
Since a stepwise uptrend usually ends in a decline, this decline could be a sign of a bearish trend.
The M-Signal indicator on the 1M chart can be used as a benchmark for bullish and bearish trends.
Therefore, if the price remains below the M-Signal indicator on the 1M chart, it should be considered a bearish trend and a response should be considered.
However, considering the overall trend of BTC, the most important range is the 69,000-73,499.86 range. As long as it does not fall below this range, the price is expected to maintain an upward trend in the long term.
-
Thank you for reading to the end.
I wish you successful trading.
--------------------------------------------------
- This is an explanation of the big picture.
(3-year bull market, 1-year bear market pattern)
I will explain in more detail when the bear market begins.
------------------------------------------------------

Aifinyo AG Increases Bitcoin Holdings with New Strategic PurchasAifinyo AG increases its digital asset presence as it buys an additional 2 Bitcoin. The company now holds 30.9 BTC. This fresh purchase reflects rising confidence and a clear commitment to its long-term blockchain vision. The Aifinyo Bitcoin strategy continues to expand as global interest in crypto grows. The company aims to stay ahead as more firms explore digital assets.
The German publicly traded firm manages a growing financial technology platform. It helps businesses streamline growth and operational processes. Its decision to deepen its Bitcoin position highlights how traditional companies view crypto. The Aifinyo Bitcoin approach sends a signal about strong conviction and a belief in long-term digital value. Investors watch these moves closely as the market prepares for new cycles.
Aifinyo AG understands how strategic adoption shapes financial positioning. Digital assets now influence treasury decisions across industries. The Aifinyo Bitcoin plan shows a shift toward future-focused financial models. More European companies explore similar strategies. The trend grows as Bitcoin gains attention as a treasury asset and a long-term store of value.
Aifinyo AG Strengthens Its Corporate Vision Through Steady Accumulation
Aifinyo AG builds its reputation as a forward-focused fintech company. The firm increases its crypto holdings in a consistent pattern. This latest addition strengthens its corporate crypto strategy. The company chooses long-term Bitcoin exposure rather than short-term speculation. This approach positions the firm for future growth as adoption expands.
The move aligns with an ongoing industry pattern. Public companies add Bitcoin to diversify and protect treasuries. Aifinyo AG plans for resilient financial positioning. Its leadership sees Bitcoin as a strategic asset. The corporate crypto strategy allows the company to move with global technological change.
Why Bitcoin Remains a Key Asset for Aifinyo and Other European Firms
Bitcoin becomes more relevant in Europe as financial innovation grows. Companies look for alternative assets that store value. The Aifinyo Bitcoin buildup reflects this growing trend. The firm understands how limited supply and global demand create long-term benefits. This belief motivates regular and steady purchases.
European fintech companies embrace digital transformation. They test new models that integrate blockchain technology. Bitcoin plays a strong role in treasury planning now. The Bitcoin treasury growth trend expands across several industries. Companies join the wave to strengthen balance sheets and diversify reserves.
Regulators across Europe also explore new frameworks. These frameworks support responsible digital asset use. Aifinyo AG works within these evolving guidelines. The firm increases its holdings with clarity and strategic timing. The Bitcoin treasury growth movement gains traction as more firms follow similar steps.
Conclusion
Aifinyo AG joins a rising wave of European companies that embrace Bitcoin. The firm increases its holdings as part of a clear strategy. This approach highlights belief in digital finance. The corporate crypto strategy builds a strong foundation for the future. The company shows steady growth through calculated decisions.
The move strengthens Aifinyo AG’s role in the fintech ecosystem. It aims for innovation and long-term economic resilience. The Bitcoin treasury growth trend continues shaping financial planning. Aifinyo AG stands among early movers that understand global digital adoption. This sets the stage for stronger performance as blockchain innovation expands.

Bitcoin ETF Investors Underwater as Price Breaks $89.6K Bitcoin has now retreated below a key cost-basis level, officially pushing U.S. spot Bitcoin ETF investors into the red.
Data from Glassnode’s Sean Rose shows the average ETF investor cost basis sits around $89,600, a level Bitcoin broke on Tuesday. The decline means spot ETFs are now holding unrealized losses.
Bitcoin ETF Realized Price Now Lost
On Monday, analyst JA Maartunn reported that the ETF’s realized price was just 9% away from breakeven with Bitcoin at the time. With Bitcoin now hovering just below that level, institutional holders are slipping into losses.
Analysts believe it could trigger further selling from ETF issuers as they seek to reduce risk. However, the opposite remains possible. In 2024, ETF providers accumulated BTC during corrections, helping fuel a strong recovery.
CryptoQuant CEO Ki Young Ju maintains that Bitcoin remains outside bear-market territory as long as it holds above $94,635. Meanwhile, the latest dip has pushed BTC below that mark.
ETF Outflows Accelerate as Investors React to Macro Weakness
The downturn comes amid weeks of heavy redemptions across digital asset funds. Last week alone, crypto ETPs saw $2 billion in outflows, the largest since February. BlackRock’s IBIT posted a record $463 million single-day withdrawal on November 14, and the outflow trends have only continued.
According to CoinShares, global crypto ETP assets declined from a peak of $264 billion in early October to $191 billion, representing a 27% drop. The U.S. accounted for $1.97 billion of last week’s redemptions, while Switzerland and Hong Kong saw smaller outflows. Germany bucked the trend with $13.2 million in inflows as investors bought the dip.
CoinShares analysts highlight worsening macroeconomic conditions, including shifting expectations for Federal Reserve policy.
Acheron Trading CEO Laurent Benayoun noted that upcoming flows will likely hinge on economic data and central-bank signals. Meanwhile, VeChain’s Johnny Garcia cautioned that short-term ETF moves often reflect rebalancing and arbitrage, not purely sentiment.
Market Searches for BTC Bottom
Bitcoin briefly plunged to $89,253 on Tuesday, its lowest level since April, before rebounding slightly above $90,000. Yet, BTC is now down more than 5% on the day and 3% year-to-date, erasing the gains sparked by its October all-time high of $126,080.
Major altcoins also suffered. Ethereum slid to $3,011, down 23% in a month, while Solana fell 27% to $135. XRP remained comparatively resilient, declining just 8% to $2.16.
Now, several prominent figures believe Bitcoin is nearing a cyclical bottom. Gemini co-founder Cameron Winklevoss called BTC under $90,000 a “final buying opportunity.”
At the same time, Bitwise CIO Matt Hougan and BitMine chairman Tom Lee both expect the market to stabilize this week. Hougan described the current price zone as a “generational opportunity.”
XRP and Solana ETFs Continue to Attract Fresh Capital
In contrast to Bitcoin and Ethereum’s heavy outflows, XRP and Solana ETFs continue to post steady inflows.
Canary Capital’s recently launched XRPC fund recorded $245 million in inflows on Friday, followed by another $25 million on Monday, even as Bitcoin ETF holders turned net-negative.
Solana ETFs have also remained resilient, adding $8.26 million on Monday and pushing total inflows since October to $390 million. The divergence indicates a growing appetite for alternative large-cap assets perceived as undervalued in relation to Bitcoin following its steep pullback.

Breaking News: Bitcoin RSI Drops Below 40 — First Time Since EarBitcoin’s weekly RSI has just fallen under 40, a level we haven’t seen since the beginning of 2023 — right before one of the strongest recoveries of the past cycle.
📉 Why it matters
• RSI < 40 on the weekly chart typically signals structural oversold conditions.
• Historically, these readings have aligned with accumulation zones, not distribution.
• Similar setups occurred in 2015, 2019, and 2023, all followed by strong multi-month rallies.
📊 What to watch next
• Weekly reversal signals
• Bullish RSI divergences
• Price reaction around the 85k–92k area
🧩 Key takeaway
A weekly RSI this depressed has often been a buying opportunity, not a sign of long-term weakness.

Check for support near the M-Signal indicator on the 1M chart
Hello, fellow traders!
Follow me to get the latest information quickly.
Have a great day.
-------------------------------------
(USDT 1D Chart)
(USDC 1D Chart)
USDT is the major currency that influences the coin market.
The USDT and USDC charts are moving in opposite directions.
This decline appears to be driven by funds flowing out of USDC.
Once the USDC gap decline stops, funds flowing in through USDT are expected to drive the coin market higher.
-
(USDT.D 1M Chart)
For the coin market to show an upward trend, USDT dominance must remain below 4.91 or show a downward trend.
We need to see if the price can face resistance around the Fibonacci level of 0.618 and turn downward.
If not, we should consider a response plan, as a rally toward 7.13 is expected.
-
(BTC.D 1M chart)
For an altcoin bull market to begin, it must either remain below 55.01 or show a downward trend.
Therefore, for the bull market we're waiting for to occur, both USDT dominance and BTC dominance must decline.
If USDT dominance declines while BTC dominance rises, a bull market will emerge, with only BTC rising.
--------------------------------------------------
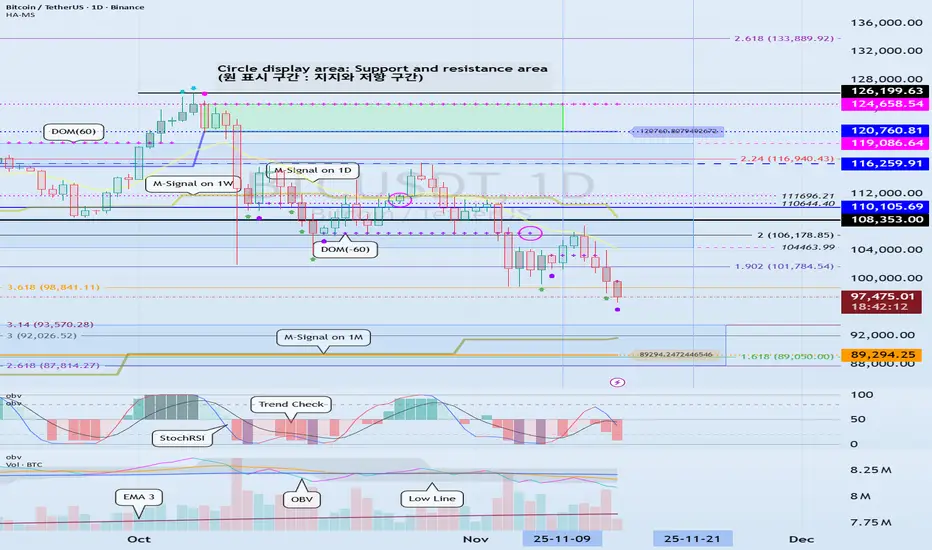
(BTCUSDT 1D Chart)
The key is whether the price can touch the M-Signal indicator on the 1M chart and turn bullish.
At this point, it's crucial to maintain the price above 89294.25.
If not, a step-down trend is likely.
To turn bullish, the price must remain above the M-Signal indicator on the 1W chart.
At this point, it's crucial to maintain the price above the newly created HA-High indicator point of 110105.69 on the 1M chart.
If not, the price may pretend to rise but then fall again, so you need to consider countermeasures.
This is a basic trading strategy within the box range: buy between DOM(-60) and HA-Low and sell between HA-High and DOM(60).
If the price rises in the HA-High ~ DOM(60) range or falls in the DOM(-60) ~ HA-Low range, you should switch to trend trading.
To do this, we should consider the movements of the StochRSI, TC (Trend Check), and OBV indicators.
To sustain the uptrend after breaking above a key point or range, the StochRSI, TC, and OBV indicators must show upward trends.
At this point,
1. The StochRSI indicator should not have entered an overbought zone.
2. The TC indicator should remain above zero.
3. The OBV indicator should remain above the High Line.
Therefore, check the movements of the StochRSI, TC, and OBV indicators at the support and resistance levels depicted on the 1M, 1W, and 1D charts and consider whether you can trade accordingly.
Based on the current price range, the key points or ranges are:
- 87814.27-93570.28
- 110105.69
- 120760.81-124658.54
I believe the three ranges above are important points or ranges.
Therefore, when the price is near these ranges, you should check the movements of the StochRSI, TC, and OBV indicators to determine a response plan.
-
Thank you for reading to the end.
I wish you successful trading.
--------------------------------------------------
- This is an explanation of the big picture.
(3-year bull market, 1-year bear market pattern)
I will explain in more detail when the bear market begins.
------------------------------------------------------
Checking for support near 3472.96
Hello, traders!
Follow us to get the latest information quickly.
Have a great day!
-------------------------------------
(ETHUSDT 1D chart)
This period of volatility is expected to last until November 14th.
After this period of volatility, the key question is whether the price can rise after gaining support near the HA-Low indicator (3472.96) on the 1D chart.
At this point, it's crucial to see if the price can rise above the M-Signal indicator on the 1W chart and maintain its upward momentum.
If the price fails to rise, it is expected to meet the M-Signal indicator on the 1M chart again.
Therefore, to continue the uptrend, the price must remain above the 3239.06-3472.96 level.
The formation of the HA-Low indicator on the 1D chart indicates a significant decline, forming a low.
Therefore, even if the downtrend continues, there's a possibility of an eventual uptrend, so we need to consider countermeasures.
However, if the price meets the HA-High indicator on the 1D chart or falls near the HA-High level, the price is likely to decline until it meets the HA-Low indicator again or the DOM (-60) indicator.
Therefore, we must remember the basic trading strategy of buying in the DOM(-60) ~ HA-Low range and selling in the HA-High ~ DOM(60) range.
If the HA-High ~ DOM(60) range rises, a stepwise upward trend is likely, while if the DOM(-60) ~ HA-Low range falls, a stepwise downward trend is likely.
Therefore, the basic trading strategy should be a segmented trading approach.
To determine trading within the box range and trend trading outside the box range, we refer to the additional auxiliary indicators, StochRSI, TC (Trend Check), and OBV.
To continue the uptrend by breaking above a key point or range, the StochRSI, TC, and OBV indicators must show upward trends.
1. The StochRSI indicator should not have entered the overbought zone.
2. The TC indicator should remain above 0. 3. The OBV indicator should remain above the High Line.
Therefore, it's important to observe the movement around important points or ranges, such as the DOM(-60) ~ HA-Low and HA-High ~ DOM(60).
The next period of volatility will be around November 20th.
-
Thank you for reading to the end.
I wish you successful trading.
--------------------------------------------------

btc finds 200 ema support, whats next?As I have been posting in these "Ideas" for the past few weeks about market direction and where the price for BTC will go. It now has come to pass where the 200 EMA has been tested and support has been found, It however has not generated any relief among buyer sentiment unable to push price above the previous days close leaving the digital asset to continue to bleed out and cause positions from all the 93k Bulls to liquidate.
Its a shame people cannot make the connection that the only way price can go higher is to go lower in a market. That Is why I am going to warn people about where we may go , I believe the 200 EMA will be tested again and if support is broken it will send is into the low 70k area where there are open orders and It is possible this may happen. The Bull market support band is the 200EMA however there may be institutional money that may drive us down to cause massive liquidations and fear and panic among those holding bags while greed causes big players to push more into the fringe of where we can maintain a recovery.
Watch for a retest of the 200EMA . which is a bit of a fuzzy zone , use the high and low to denote the area for support as well as keep an eye on the RSI and CCI , we are also watching on balance volume drop off which is not a great sign that there is market confidence however this will play out over the weekly and the weekly candle will start to materialize in the next few days.

The S&P 500 is flirting with a close below the 50-day moving aveThe S&P 500 is flirting with a close below the 50-day moving average for the first time since April.
This level has acted as reliable support twice already, and so far the index is reacting in a similar way.
However, the RSI is showing a clear bearish divergence, suggesting momentum is weakening even as price pushed to new highs in October–November.
🔎 Key levels to watch:
• 50-day MA — primary support
• RSI structure — persistent lower highs
• Recent swing lows — potential breakdown trigger if the 50-day MA fails
Price is at an inflection point: either the 50-day holds again, or we finally get a deeper pullback after months of strength.

Next volatility period: Around November 26
Hello, traders!
Follow me to get the latest information quickly.
Have a great day!
-------------------------------------
(XRPUSDT 1D chart)
Currently, the M-Signal on the 1W chart > Price > M-Signal on the 1D chart > M-Signal on the 1M chart.
Additionally, it is attempting to break above the StochRSI 80 indicator.
Therefore, if it finds support near the StochRSI 80 indicator and rises, it is highly likely to enter an uptrend.
The resistance zone is around 3.4037-3.4540, which is the HA-High ~ DOM (60) range.
The above is an interpretation based solely on the 1D chart.
-
The chart above displays support and resistance points drawn on the 1M, 1W, and 1D charts.
This indicates that support and resistance have formed in the 2.9092-3.0361 range.
Therefore, we have identified a zone where we can execute a two-stage sell-off.
This confirmation will be crucial for maintaining a stable psychological state amidst price volatility.
If the price falls to the 1.5-1.9669 range, which is the most important level for maintaining an uptrend, you should watch for an explosive increase in trading volume.
If it shows support, it indicates a buying opportunity.
-
Thank you for reading to the end.
I wish you successful trading.
--------------------------------------------------

Next volatility period: Around November 21st
Hello, traders!
Follow us to get the latest information quickly.
Have a great day!
-------------------------------------
(BTCUSDT 1D chart)
This volatility period is coming to an end.
Currently, the HA-High indicator on the 1M chart is showing signs of forming at 110105.69. If it fails to rise above 110105.69, further declines are likely.
Therefore, the key question is whether it can find support around 104463.99-108353.0 and continue its upward trend.
If it fails to rise, the M-Signal indicator on the 1M chart is expected to meet and re-establish the trend.
At this time, the key level is around 89296.25.
-
To break above this key level and continue the uptrend,
the StochRSI, TC (Trend Check), and OBV indicators must show upward trends.
If possible,
- The K indicator on the StochRSI indicator should not have entered the overbought zone.
- The TC (Trend Check) indicator should remain above 0. - The OBV indicator should remain above the High Line.
Therefore, we will determine whether the uptrend can continue by observing the upward movement when the price breaks above the 104463.99-108353.0 range.
-
Thank you for reading to the end.
We wish you successful trading.
--------------------------------------------------
- Here's an explanation of the big picture.
(3-year bull market, 1-year bear market pattern)
We will provide more detailed information when the bear market begins.
------------------------------------------------------

Important range: 161.79-163.73
Hello, traders!
Follow us to get the latest information quickly.
Have a great day!
-------------------------------------
(SOLUSDT 1D chart)
The HA-Low indicator, the DOM(-60) indicator, and the M-Signal indicator are forming around 161.79-163.73.
Therefore, the key is whether the price can break above the 161.79-163.73 level.
To continue the uptrend by breaking above this key point or level, the StochRSI, TC (Trend Check), and OBV indicators must show upward trends.
- The StochRSI indicator should not have entered the overbought zone.
- The TC (Trend Check) indicator should remain above zero.
- The OBV indicator should remain above the High Line.
Currently, the OBV indicator is near the Low Line, and is in a reversed state with OBV < EMA 2 and EMA 1.
Therefore, if the price breaks above the 161.79-163.73 level, we need to watch for a reversal where OBV > EMA2 and EMA1.
The StochRSI indicator appears to be rising from the oversold zone, and appears to have shifted to a K > D state.
The TC (Trend Check) indicator is trending upward, but since it's below the 0 level, we can see that selling pressure still dominates.
Therefore, if the TC indicator breaks above the 161.79-163.73 level, we should also check to see if it can rise above the 0 level.
If it fails to rise above the 161.79-163.73 level, we should check for support around 126.36.
Since the HA-Low indicator has been created, even if it shows a stepwise downward trend, it is expected to eventually turn upward.
Therefore, we should focus on finding the right time to buy.
-
Thank you for reading to the end.
I wish you successful trading.
--------------------------------------------------

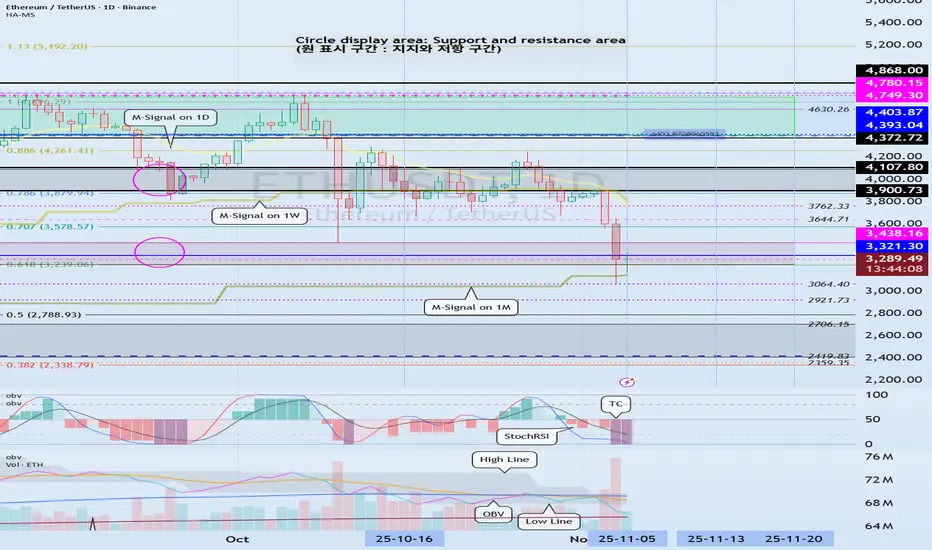
See if it finds support near 3321.30 and can rise
Hello, fellow traders!
Follow us for quick updates.
Have a great day.
-------------------------------------
(ETHUSDT 1D chart)
There's no change from what I mentioned in my previous idea.
The M-Signal indicator on the 1M chart has been touched, so the trend will be re-determined.
At this point, it's crucial to check for support near the Fibonacci 0.618 (3239.06) - 3438.16 range.
If support fails and the price falls below the M-Signal indicator on the 1M chart, support should be checked around the 2419.83-2706.15 range.
-
Since the TC (Trend Check) indicator has touched its lowest point, a rebound is highly likely.
Therefore, determining support near the critical Fibonacci 0.618 (3239.06) - 3438.16 range is more important than ever.
Currently, ETH is in a period of volatility.
Therefore, we need to monitor the movement until November 6th.
The next period of volatility is around November 13th.
-
Thank you for reading.
We wish you successful trading.
--------------------------------------------------
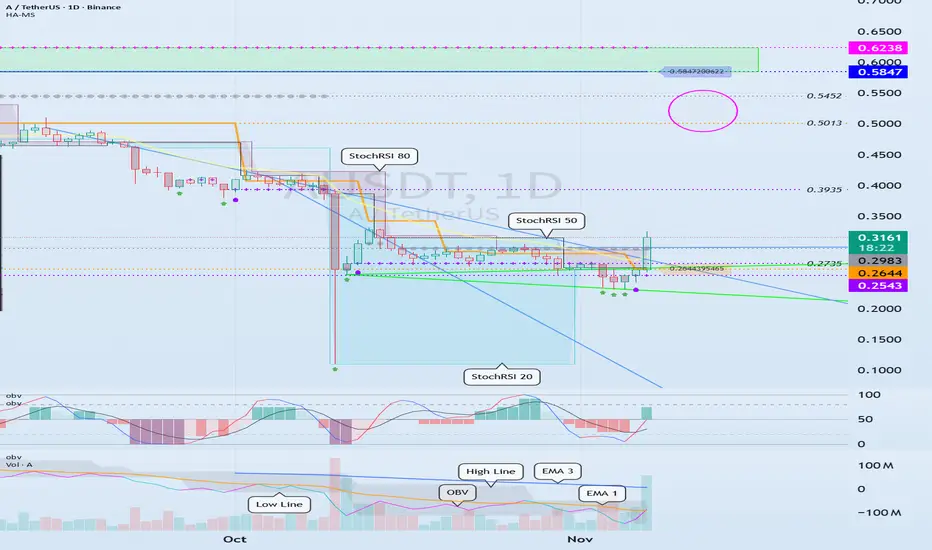
See if it finds support near 0.2983 and can rally
Hello, fellow traders!
Follow us to get the latest information quickly.
Have a great day!
-------------------------------------
(AUSDT 1D chart)
The StochRSI indicator was added shortly after the chart was created.
The key is whether it can find support around 0.2644-0.2983 and rise to around 0.5847.
-
To sustain the uptrend, the price must remain above the StochRSI 80 level.
Therefore, whether support is found around 0.2983 is crucial.
The basic trading strategy is to buy in the DOM(-60) ~ HA-Low range and sell in the HA-High ~ DOM(60) range.
However, if the price rises in the HA-High ~ DOM(60) range, a stepwise upward trend is likely, while a decline in the DOM(-60) ~ HA-Low range is likely to lead to a stepwise downward trend.
Therefore, a split trading strategy is recommended.
The end of a stepwise downward trend is an uptrend, and the end of a stepwise upward trend is a downtrend.
Therefore, when the price is near the HA-Low or HA-High indicators, it's time to focus on finding a trading opportunity.
-
To sustain an uptrend after breaking above a key point or range,
1. The StochRSI indicator must be trending upward. If possible, it should not be overbought.
2. The TC (Trend Check) indicator must be trending upward. If possible, it should remain above the zero level.
3. The On-By-Value (OBV) indicator must be trending upward. If possible, it should remain above the High Line.
If the above conditions are met, the uptrend is more likely to continue.
-
Thank you for reading to the end.
I wish you successful trading.
--------------------------------------------------
Need to see if it can rise above 104463.99
Hello, fellow traders!
Please "Follow" to always get the latest information quickly.
Have a great day.
-------------------------------------
(BTCUSDT 1D chart)
The price declined from the DOM(-60) indicator level of 106431.68, but the DOM(-60) indicator is still forming at 106431.68.
Therefore, the 106431.68 level can be considered a low point.
Therefore, we need to observe how the price moves during this volatile period, around November 4th-9th (maximum November 3rd-10th).
Since it fell below the critical 104463.99-108353.0 level, if it fails to rise above this level, we should check for support near the next critical level of 89294.25.
At this point, the M-Siganl indicator on the 1M chart is passing through a critical zone, so it's expected to re-establish the trend once it meets the M-Siganl indicator on the 1M chart.
If the OBV indicator falls below the Low Line and fails to rise again, it's likely to touch EMA 3.
For the price to break above a critical point or zone and continue the uptrend,
1. The StochRSI indicator must be rising. Ideally, it should not be in an overbought zone.
2. The TC (Trend Check) indicator must be rising. Ideally, it should remain above the zero level.
3. The OBV indicator must be rising. Ideally, it should remain above the High Line.
If the above conditions are met, the upward trend is likely to continue after breaking above a critical point or zone.
Currently, the price is moving against the above conditions, so there's a possibility of further decline. However, given the volatility, it's better to wait and see rather than assume a decline.
-------------------------------------
I'm curious about what will happen next, but there's no way to know for sure.
However, as I've repeatedly mentioned, if you're trading according to a basic trading strategy that suits your investment style, I believe you'll be able to trade according to your strategy, whether the current decline continues or rebounds and rises.
As I mentioned in a previous idea,
- If a daily decline exceeds -10%, a rebound is highly likely,
- If a daily increase exceeds +10%, a reversal is highly likely.
Therefore, if you're familiar with scalping or day trading, you can profit from trading.
However, you must sell at that profit to lock in your profits.
The basic trading strategy I mentioned is to buy in the DOM(-60) ~ HA-Low range and sell in the HA-High ~ DOM(60) range.
Furthermore, we can respond based on the support and resistance levels identified on the 1M, 1W, and 1D charts, which are important areas.
Therefore, the current available support levels are the 104463.99-108.353.0 and 87814.27-93570.28 levels.
The remaining support and resistance levels can be used as trading opportunities.
In other words, these are points for securing profits.
-
Due to this decline, the HA-High indicator on the 1M chart is showing signs of forming at the 110105.69 level.
Therefore, if there is a rebound, the 110105.69 level could potentially serve as resistance.
However, as the price rises, the HA-High indicator on the 1M chart could return to its previous HA-High level.
Therefore, we need to determine if support is found in the 104463.99-108353.0 range and consider a response plan accordingly.
-
If the price falls below the M-Signal indicator on the 1M chart and remains there, there's a possibility of a downtrend, so we should also consider a response plan.
The coin market operates in decimals, allowing for more flexible trading than the stock market.
This means that by trading at a buy price, you can profit even if you're losing money and increase your coin (token) holdings.
For example, if you bought $100 at $101,000, you could sell $100 (including transaction fees) when the price rises, increasing your profit.
By increasing your profit, you can quickly turn a loss into a profit.
If you bought $100 at 101,000 and only had 0.1 coins (tokens), you could sell those 0.1 coins and generate a cash profit if the price rises and you're making a profit.
However, this method is only applicable if you won't be trading that coin (token) again.
In other words, if you sell 100% of your holdings, you'll need to wait until the next price fluctuation, or you could end up making a worse trade.
Therefore, if possible, it's best to trade with the same amount you bought, increasing the number of coins (tokens) that represent your profit.
Don't think you should just leave the coin (token) you're losing and trade another coin (token) to make a profit.
This could actually lead to further losses.
-
Thank you for reading to the end.
I wish you successful trading.
--------------------------------------------------
- This explains the big picture.
(3-year bull market, 1-year bear market pattern)
I will explain in more detail when the bear market begins.
------------------------------------------------------

Example of a Trading Style
Hello?
Hello, fellow traders.
Follow me to get the latest information quickly.
Have a great day.
-------------------------------------
While it's ideal to always close a trade in profit, this isn't always the case.
Therefore, you should maintain your trade by locking in profits through fractional trading.
Based on the trading information provided by the exchange, once a trade has turned into a loss, it's likely to take a considerable amount of time to turn into a profit again.
Therefore, you should trade at different buy and sell prices.
However, this is a rather tedious process, so it's not usually done that way.
-
If you were to buy near the area shown on the chart, the estimated average purchase price would be significantly higher than the current price.
Therefore, you wouldn't be able to proceed with the trade.
Therefore, we must trade by purchase price.
The purchase prices for positions 1 and 2 are quite high, so we don't pay attention to them.
Since the current price is near the purchase price for position 3, if it turns into a profit, you can sell the amount you purchased near position 3 to lock in the profit.
By subtracting this profit from the purchase price for positions 1 and 2, you can minimize your losses.
This trading method is possible because the coin market allows trading in decimals.
The key here is to trade by purchase price.
You should not trade in units of the number of coins you purchased.
For example, if you purchased $100 at point 3 (106431.68), you should sell $100 when the price rises.
Trading this way will allow you to quickly recover from losses and even generate profits even during losses.
-
You can profit whenever volatility occurs, regardless of whether the asset (coin or token) you're trading is in a loss or a profit.
You should avoid increasing the number of assets (coins or tokens) you're trading without managing them.
------------------------------------------------
To do this,
1. Mark support and resistance points on the 1M, 1W, and 1D charts.
2. Develop a basic trading strategy using these support and resistance points.
3. Avoid greed and execute split trades according to your trading strategy.
-
Thank you for reading to the end. I wish you successful trading.
--------------------------------------------------

Volatility Period: Up to November 10th
Hello, traders!
Follow us to get the latest information quickly.
Have a great day!
-------------------------------------
(BTCUSDT 1D chart)
This volatility period is expected to last from November 3rd to 9th.
First, we need to check the movement between November 3rd and 5th.
While the key question is whether the price can rise after finding support at the important support and resistance level of 104463.99-108353.0, it's crucial to check for support around 106431.68 within that range.
This is because the 106431.68 point is the DOM(-60) level.
-
The DOM indicator is a comprehensive evaluation of the DMI, OBV, and MOMENTUM indicators.
DOM(-60) indicates that all three indicators have reached their lows.
Therefore, support is necessary to confirm the possibility of a bullish reversal.
If the price rises after the DOM(-60) indicator first appears and then touches the DOM(-60) indicator again, it is highly likely that the price will fall without finding support.
If the price rises after finding support at the DOM(-60) indicator, it should follow a period of sideways movement to confirm support.
-
Therefore, what we can do now is take the time to determine which direction the price deviates from the 106431.68-108353.0 range and where it encounters support and resistance.
You need your own basic trading strategy to execute your trades.
No one else can do this for you.
This is because you need to tailor your trading strategy to your investment style to avoid regrets.
My basic trading strategy is to buy in the DOM(-60) ~ HA-Low range and sell in the HA-High ~ DOM(60) range.
However, if the price rises in the HA-High ~ DOM(60) range, a step-up trend is likely, while if the price falls in the DOM(-60) ~ HA-Low range, a step-down trend is likely.
Therefore, a split trading strategy is required.
-
The formation of the DOM(-60) indicator indicates a buying opportunity. However, as previously mentioned, this is the second time the indicator has fallen below the DOM(-60) level since its formation, increasing the likelihood of further declines.
If the price falls below 104463.99 and continues to decline, it is expected to meet the M-Signal indicator on the 1M chart and re-establish the trend.
At this point, the key area to consider is support, particularly around the left Fibonacci level of 2.618 (87814.27) to the left Fibonacci level of 3.14 (93570.28).
If the price declines and a new HA-Low indicator is formed, support around that level is crucial.
-
You can profit by trading whether the price is in an uptrend or a downtrend.
However, the trading period may vary depending on the trend.
Therefore, you should check the flow of funds and determine whether trading is possible based on the support and resistance levels currently established.
To continue the uptrend by breaking above a key point or range,
1. The StochRSI indicator must be trending upward. If possible, it should not have entered an overbought zone.
2. The TC (Trend Check) indicator must be trending upward. If possible, it should remain above the zero level.
3. The On-By-Sign-Operative (OBV) indicator must be trending upward. If possible, it should remain above the High Line.
When all three indicators above are met, an uptrend is highly likely.
Currently, the On-By-Sign-Operative (OBV) indicator is located near the Low Line, following the EMA 3 > EMA 2 > EMA 1 > OBV.
Therefore, we can see that selling pressure is dominant.
However, since it's located near the HA-Low indicator, you should pay close attention to the situation.
If it finds support in the DOM(-60) ~ HA-Low range according to the basic trading strategy, it's a good time to buy.
-
Thank you for reading to the end.
I wish you successful trading.
--------------------------------------------------
- Here's an explanation of the big picture.
(3-year bull market, 1-year bear market pattern)
I'll explain more in detail when the bear market begins.
------------------------------------------------------

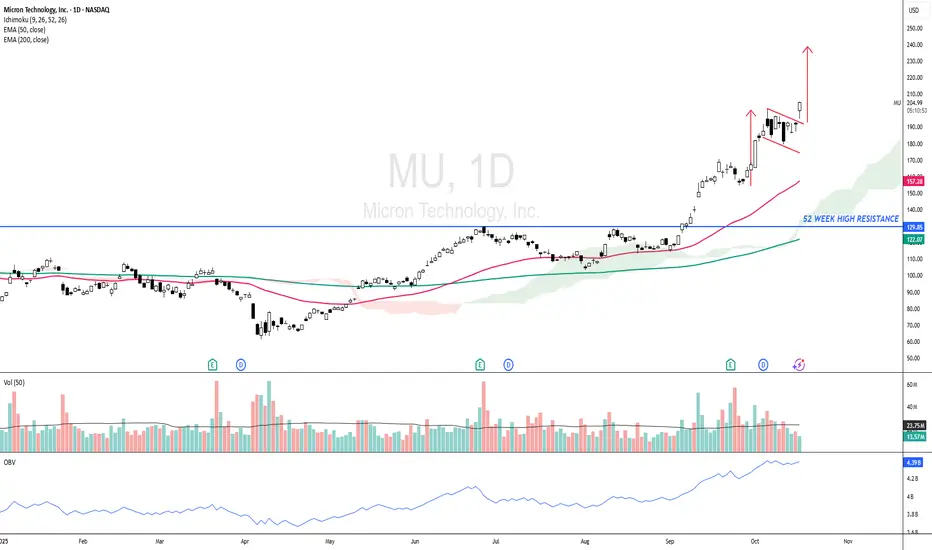
MU - Bullish Continuation Pattern ?MU - CURRENT PRICE : 204.00 - 205.00
The stock has surged nearly 70% since my previous buy call, demonstrating strong bullish momentum. I shared the link of my previous trading idea for reading purpose.
Currently, the price has broken out of a bullish flag pattern, indicating the potential for another leg higher. Estimate target of this bullish flag pattern is around 237.00. Support level is 179.00 (the low of 10 October 2025 candle).
Take note also this ascending in prices is also supported by rising in On Balance Volume (OBV) readings. (Look at the blue line at bottom of chart)
ENTRY PRICE : 203.00 - 205.00
TARGET : 237.00
SUPPORT : 179.00
Next Volatility Period: Around November 5th
Hello, fellow traders!
Follow us to get the latest updates quickly.
Have a great day!
-------------------------------------
(INTC 1M Chart)
The price has broken above the 28.93 level, indicating a long-term uptrend.
The basic trading strategy is to buy in the DOM(-60) ~ HA-Low range and sell in the HA-High ~ DOM(60) range.
Accordingly, the resistance zones are 47.33-49.82 and 55.20-56.48.
The 47.33-49.82 range corresponds to the HA-High ~ DOM(60) range formed on the 12M chart.
Therefore, we should consider the overall resistance zone to be 47.33-56.48 and develop a response strategy.
-
(1W chart)
We should examine whether the price can sustain above the downtrend line (1) and rise along the uptrend line (2).
Since the HA-High indicator on the 1W chart is formed at 45.36, the key question is whether the price can rise above 45.36 and maintain its position.
-
(1D chart)
If the upward trend fails along the uptrend line (2), we should check for support near 36.92.
If not, there's a chance the M-Signal indicator on the 1W chart will touch it.
If the price remains above the HA-High ~ DOM (60) range (35.50-36.92) on the 1D chart, a stepwise uptrend is likely.
However, the price must break above the HA-High ~ DOM (60) range on the 1W and 1M charts.
Therefore, the first hurdle is whether the price can rise above 45.36 and maintain its position.
The next period of volatility will be around November 5th.
After this period of volatility, we need to see if the price stays above the downtrend line (1) and rises along the uptrend line.
-
Thank you for reading.
We wish you successful trading.
--------------------------------------------------
