Check for support near 4302.41-4372.72
Hello, traders!
Follow us to get the latest updates quickly.
Have a great day!
-------------------------------------
(BTC.D 1M chart)
For an altcoin bull market to begin, the price must either fall below 55.01 and hold or continue its downward trend.
(USDT.D 1M chart)
I believe that USDT dominance must remain below 4.91 or continue its downward trend for the coin market to continue its upward trend.
The maximum decline in 2025 is expected to be around 2.84-3.42.
After that, the coin market is expected to enter a bear market with an upward trend.
------------------------------------
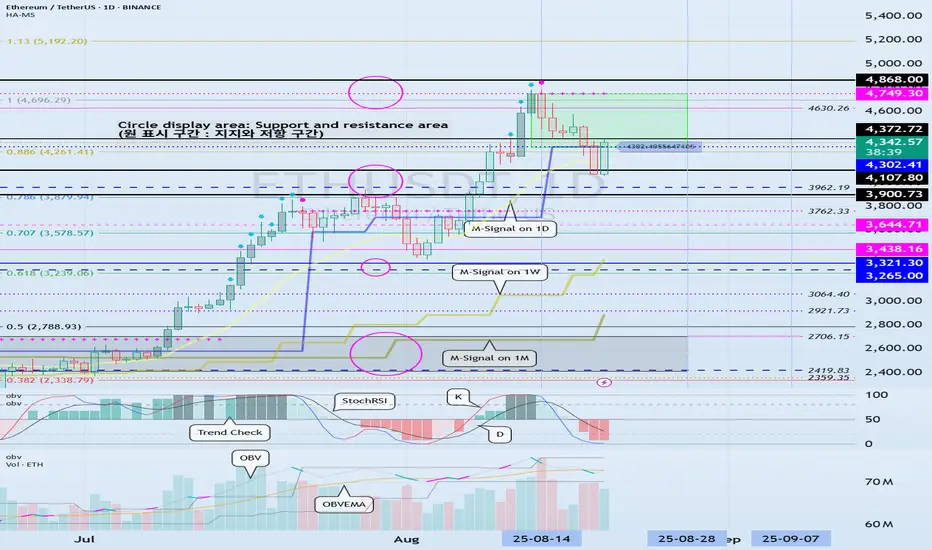
(ETHUSDT 1D chart)
It touched the previous all-time high (ATH) range of 3900.73-4107.80 and is showing an upward trend above 4302.41.
Therefore, we need to check whether it can find support around 4302.41-4372.72.
To continue the step-up trend, it's expected to rise above 4749.30.
-
When a new candlestick is formed, a low trend line is expected to form, consolidating the trend line as shown below.
Therefore, the key question is whether the price can rise along the rising channel after the volatility period around August 28 (August 27-29).
-
The 4302.41-4749.30 range represents a high-boundary zone, requiring a short and quick response when trading.
Therefore, if the price finds support near 4302.41 and rises, it would be wise to develop a trading strategy based on the assumption that the first sell-off will occur around 4749.30.
For the uptrend to continue, rising above 4749.30,
- the StochRSI indicator must remain upward with K > D,
- the OBV must rise above the High Line and remain upward,
- the TC (Trend Check) indicator must remain upward. (Preferably, it should show an upward trend above 0.)
If the above conditions are met, I believe the uptrend is likely to continue.
-
If the price falls below 4302.41,
1st: 3900.73-4107.80
2nd: M-Signal on the 1W chart
We need to check for support near the 1st and 2nd levels above.
-
The basic trading strategy is to buy in the HA-Low ~ DOM (-60) range and sell in the HA-High ~ DOM (60) range.
However, if the price rises from the HA-High to DOM(60) range, it is likely to exhibit a step-like upward trend, while if it falls from the HA-Low to DOM(-60) range, it is likely to exhibit a step-like downward trend.
Therefore, the basic trading strategy should be a segmented trading strategy.
If you purchase a new position because the price appears to be supporting the HA-High to DOM(60) range, you should execute the trade quickly and with short-term responses.
Otherwise, if the price falls below the HA-High indicator, it is likely to decline until it meets the HA-Low or DOM(-60) indicator.
-
Thank you for reading to the end.
I wish you successful trading.
--------------------------------------------------
- This is an explanation of the big picture.
(3-year bull market, 1-year bear market pattern)
I will explain in more detail when the bear market begins.
------------------------------------------------------
Breadth Indicators
A rise above 3.725 could start a new bullish wave
Hello, fellow traders!
Follow me to get the latest information quickly.
Have a great day.
-------------------------------------
The original TON coin (token) failed, and this is the TON coin that was acquired and rebuilt.
Therefore, there are currently two TON coins, so it's recommended to verify them before trading.
This TON coin was acquired and rebuilt by Coinbase Ventures.
-
(TONUSDT 1D chart)
If the price holds above 3.725, there's a possibility of an upward trend as it breaks above the 4.059-4.668 range.
Therefore, the key question is whether it can find support at 3.440-3.725 and continue upward.
If not,
1st: 3.161
2nd: 2.641-2.900
Check for support near the 1st and 2nd levels above.
If possible, it's best to confirm that the price holds above the M-Signal indicator on the 1W chart before entering a trade.
-
(1W chart)
If the price rises above 3.725, there's a possibility of a sharp rise as there are no support or resistance levels.
Currently, the volume profile is forming in the 5.770-6.391 range, so there's a possibility that it will rise to that level.
-
Thank you for reading.
I wish you successful trading.
--------------------------------------------------
- Here's an explanation of the big picture.
(3-year bull market, 1-year bear market pattern)
I'll explain more in detail when the bear market begins.
------------------------------------------------------

Important range: 10.626-12.130
Hello, traders!
Follow us to get the latest information quickly.
Have a great day!
-------------------------------------
Uniswap (UNI) is used on DEX exchanges.
This makes it connected to many ecosystems.
However, it's worth considering whether this coin (token) is worth holding in the medium to long term.
This is because if the DEX exchange fails to activate and fails, it could disappear completely.
Therefore, to trade this coin (token), I recommend holding it by gradually increasing the amount of coins (tokens) that represent profits.
-
(UNIUSDT 1M chart)
The key is whether it can break above the formed channel.
-
(1W chart)
The key is whether it can find support around 10.626 and rise above 14.233-17.073.
If it declines below 10.626, it should check for support around 5.448-6.940.
Therefore, if it falls below the M-Signal indicator on the 1M chart, trading should be halted and the situation should be assessed.
-
(1D Chart)
The key is whether the price can maintain support above 14.233, with support found around 10.626-12.130.
If the price fails to rise, we should check for support around 9.080.
If not, a decline to 6.940 is possible.
Since a short-term upward channel has formed, we should examine whether the price can rise along this channel.
--------------------------------------------------
Increasing the number of coins (tokens) for profit involves selling the original purchase price (+ transaction fees) to retain the coins (tokens) corresponding to the profit.
This increases the number of coins (tokens) with an average purchase price of 0, making it possible to hold them for the medium to long term.
This strategy is more effective in a downtrend than in an uptrend.
-
Thank you for reading to the end.
I wish you successful trading.
--------------------------------------------------
- Here's an explanation of the big picture.
(3-year bull market, 1-year bear market pattern)
I'll explain more in detail when the bear market begins.
------------------------------------------------------

Check if it finds support around 23.98-25.17 and rises
Hello, fellow traders!
Follow us to get the latest information quickly.
Have a great day.
-------------------------------------
Chainlink is one of the coins connected to many ecosystems.
Therefore, I believe it's worth holding for the medium to long term.
(LINKUSDT 1M chart)
The key is whether the price can find support around 23.98-25.17 and rise along the uptrend line.
If not, caution is advised as it may touch the lower uptrend line.
-
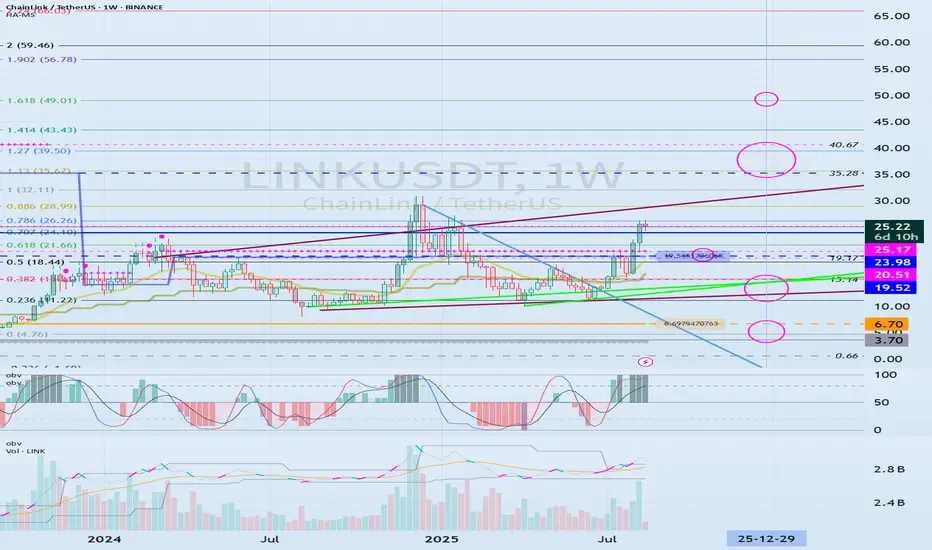
(1W chart)
If the price finds support around 23.98-25.17 and rises,
1st: 35.28-40.67
2nd: Fibonacci ratio 1.618 (49.01)
It is expected to rise to the 1st and 2nd levels above.
After that, a bearish turn appears likely.
Based on the current price, if it falls below the 19.52-20.51 range, it is recommended to stop trading and wait and see how the situation develops.
-
(1D chart)
Ultimately, the key is whether the price can break above the uptrend line (1).
If not, you should check for support within the circled area marked on the chart.
However, if the price falls below the M-Signal indicator on the 1M chart, you should stop trading and wait and see how things turn out.
-
Thank you for reading.
I wish you successful trading.
--------------------------------------------------
- This is an explanation of the big picture.
(3-year bull market, 1-year bear market pattern)
I will explain in more detail when the bear market begins.
------------------------------------------------------
See if it finds support near 0.21409 and can rise
Hello, fellow traders!
Follow me to get the latest information quickly.
Have a great day.
-------------------------------------
(DOGEUSDT 1M Chart)
I'm not sure if I should hold DOGE for the medium to long term.
However, if you plan to hold the coin for the medium to long term, I recommend increasing the number of coins (tokens) that represent profit.
The 0.21409-0.31600 range is an important high point boundary.
If this area supports the price and the price rises, a stepwise upward trend is likely.
To do so, we need to observe whether the price rises along the existing rising channel.
If the price falls below the downtrend line (1), we should stop trading and wait and see how things unfold.
-
(1W Chart)
A new channel has formed by breaking away from the downtrend line (2).
Therefore, the key question is whether the price can rise along this channel and rise above 0.37778.
If possible, I recommend finding support near 0.21409.
-
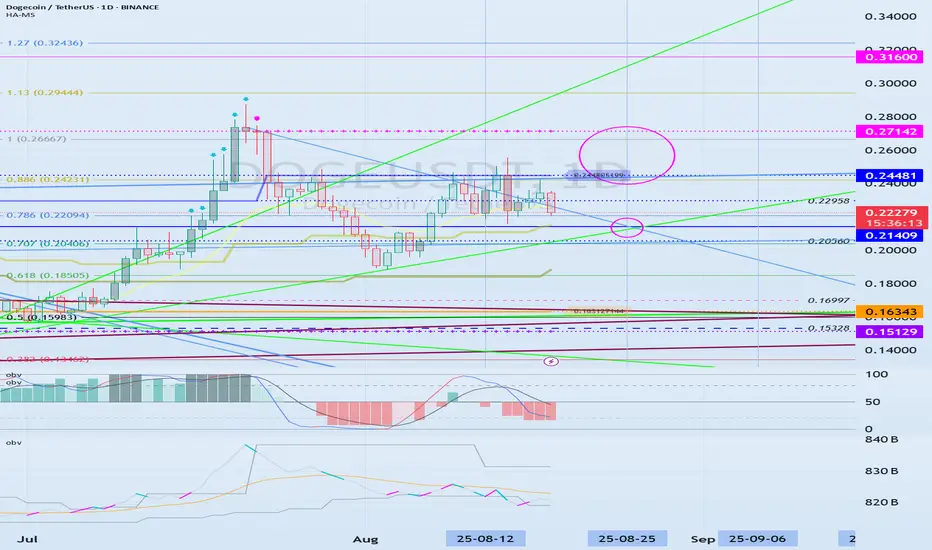
(1D Chart)
To form a channel, the key is to find support near 0.21409 and maintain the price above 0.24481.
To continue the stepwise uptrend, the price is expected to rise above 0.24481-0.27142.
If it falls below 0.21409, it is expected to meet the M-Signal indicator on the 1M chart and re-establish the trend.
The support level is 0.15129-0.16343.
-
Thank you for reading.
I wish you successful trading.
--------------------------------------------------
- This is an explanation of the big picture.
(3-year bull market, 1-year bear market pattern)
I will explain in more detail when the bear market begins.
------------------------------------------------------
See if the price can hold above 0.8289-0.8836
Hello, fellow traders!
Follow us to get the latest information quickly.
Have a great day.
-------------------------------------
(ADAUSDT 1D chart)
From a trend perspective, the key is whether the price can hold by breaking above the first and second trend lines.
If the upward movement fails, we should check for support around 0.8289-0.8836.
Therefore, we should check whether the price remains above 0.8289-0.8836 after August 31st, which is ADA's volatile period.
-
(1W chart)
To continue the cascading upward trend, the price must rise above 1.1936-1.3678 and remain there.
If it surges, it could rise to around 2.1150.
Since the volatile period on the 1W chart occurred around the week of November 10th, a downtrend is likely thereafter.
This is because a major bear market is expected to begin in 2026.
Therefore, if the HA-High indicator falls below 0.8836, you should stop trading and assess the situation.
-
Thank you for reading to the end.
I wish you successful trading.
--------------------------------------------------
- Here's an explanation of the big picture.
(3-year bull market, 1-year bear market pattern)
I will explain more in detail when the bear market begins.
------------------------------------------------------

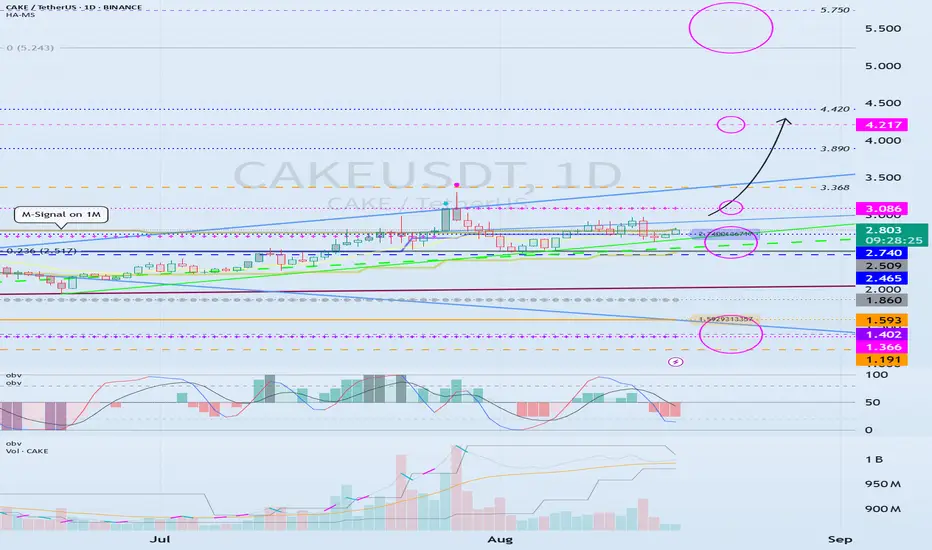
The key is whether it can rise above 3.086
Hello, fellow traders.
Follow us to get the latest information quickly.
Have a great day.
-------------------------------------
(CAKEUSDT 1W chart)
For the uptrend to begin, the price must rise above 5.750 and hold.
-
(1D Chart)
The key is whether the price can maintain support around 2.465-2.740 and rise above 3.086.
If the price holds above 3.086, a stepwise upward trend is highly likely.
At this point, the key point to watch is whether it can rise above 4.217.
If it finds support around 2.465-2.740 and rises, a medium- to long-term uptrend is likely, so you can develop a trading strategy based on this.
-
If it falls below 2.465, it could fall below 1.860, so you should stop trading and wait and see how things go.
The strong support area is 1.191-1.593, so if it finds support around this area, it would be a good time to buy.
-
Thank you for reading.
I wish you successful trading.
--------------------------------------------------
- Here's an explanation of the big picture.
(3-year bull market, 1-year bear market pattern)
I'll explain more in detail when the bear market begins.
------------------------------------------------------
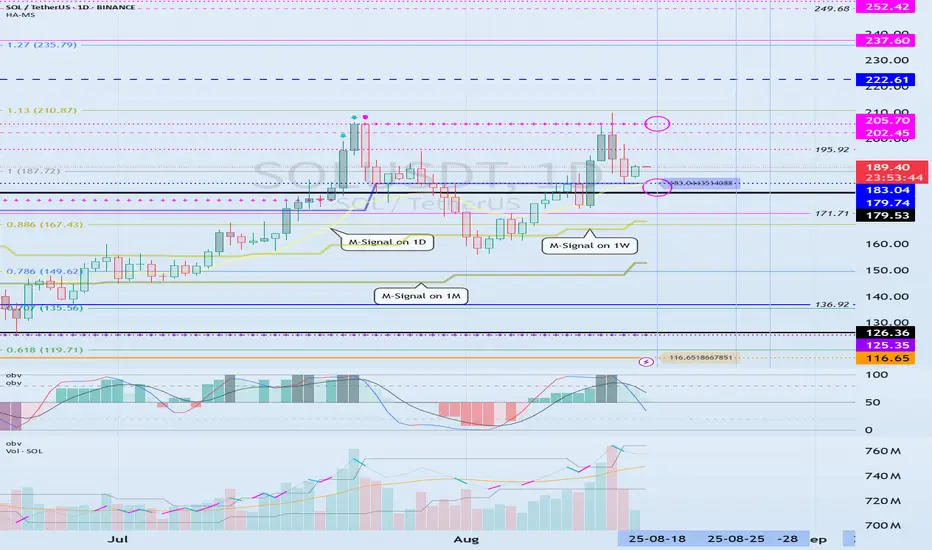
SOL Volatility Period: Around August 18
Hello, traders!
Follow us to get the latest information quickly.
Have a great day!
-------------------------------------
(SOLUSDT 1M Chart)
If the price stays above the M-Signal indicator on the 1M chart, the uptrend is expected to continue.
If it falls below 126.36, you should stop trading and observe the movement.
Since the HA-High indicator is forming at 179.74, the key question is whether it can find support near this level and rise.
The start of a stepwise uptrend is likely to begin with a rise above 237.60, the DOM (60) indicator level.
Therefore, the key point to watch is whether it can find support in the 179.74-237.60 range.
The DOM (60) indicator indicates the end of a high, while the HA-High indicator indicates a decline from a high.
Therefore, the 179.74-237.60 range can be considered a high boundary zone.
When the DOM (60) or HA-High indicator first forms, a decline is likely.
If the decline is followed by a rise near the HA-High or DOM (60) indicator, the likelihood of an upward breakout increases.
Therefore, if support is found around 179.74 this time, it is highly likely to lead to an attempt to rise above 237.60.
-
(1W chart)
The key area to watch on the 1W chart is whether the price can break above the 202.45-222.61 level.
If the price breaks above the 202.45-222.61 level and maintains its upward momentum, a stepwise uptrend is likely to begin.
-
(1D chart)
The key area to watch on the 1D chart is whether the price can find support around 179.53-183.04 and rise above 205.70.
The 183.04 point is the HA-High indicator level, and the 205.70 point is the DOM (60) level.
If it falls below 183.04, it is expected to meet the M-Signal indicator on the 1W chart and re-establish the trend.
Ultimately, the price must remain above the M-Signal indicator on the 1M chart to maintain a strong uptrend.
Therefore, looking at the bigger picture, we need to determine whether the 126.36-179.53 range provides support and allows for an upward movement.
SOL's current volatility period is around August 18th (August 17th-19th).
At this time, we should look for a direction in which it deviates from the 183.04-205.70 range.
-------------------------------------------------
Only the concept of price moving averages, which I learned while studying chart analysis, is applied to the M-Signal indicator on the 1M, 1W, and 1D charts.
The rest of the explanation cannot be interpreted using existing chart analysis techniques.
This is because the HA-Low and HA-High indicators were developed for trading on Heikin-Ashi charts, while the DOM(60) and DOM(-60) indicators are a comprehensive evaluation of the DMI, OBV, and MOMENTUM indicators.
Therefore, to interpret my charts, you must apply the concepts of support and resistance points.
It's not that my chart explanations lack logic; they simply seem illogical because they can't be interpreted using existing interpretation methods.
Chart analysis should be as simple and concise as possible.
If you spend too much time analyzing charts or trying to apply complex theories, you will lack time to develop a trading strategy, increasing the likelihood of your trades going in the wrong direction.
To interpret my chart, all you need is a basic understanding of price moving averages and support and resistance.
Support and resistance points are determined by the horizontal lines of the DOM(60), HA-High, HA-Low, and DOM(-60) indicators.
The DOM(60) and HA-High indicators mark highs, while the HA-Low and DOM(-60) indicators mark lows.
Therefore, a basic trading strategy can be used: buy when the price rises from the DOM(-60) to HA-Low range, and sell when it reaches the HA-High to DOM(60) range.
However, if the price rises above the HA-High to DOM(60) range, a stepwise uptrend is likely, while if the price falls below the DOM(-60) to HA-Low range, a stepwise downtrend is likely.
Therefore, a segmented trading strategy should be adopted.
-
The basic chart for chart analysis is the 1D chart.
Therefore, it's best to trade in line with the trend of the 1D chart.
Therefore, the position that matches the trend of the 1D chart becomes the main position.
So, since the current trend of SOL's 1D chart is up, the LONG position becomes the main position.
To trade based on the trend of the 1D chart when trading futures, you need to set low leverage.
Therefore, when trading based on the timeframe chart you're viewing, increase your investment proportion when trading in line with the trend of the 1D chart. Conversely, when trading in the opposite direction, reduce your investment proportion and execute short, quick trades.
-
Thank you for reading to the end.
I wish you successful trading.
--------------------------------------------------
- This is an explanation of the big picture.
(3-year bull market, 1-year bear market pattern)
I will explain in more detail when the bear market begins.
------------------------------------------------------
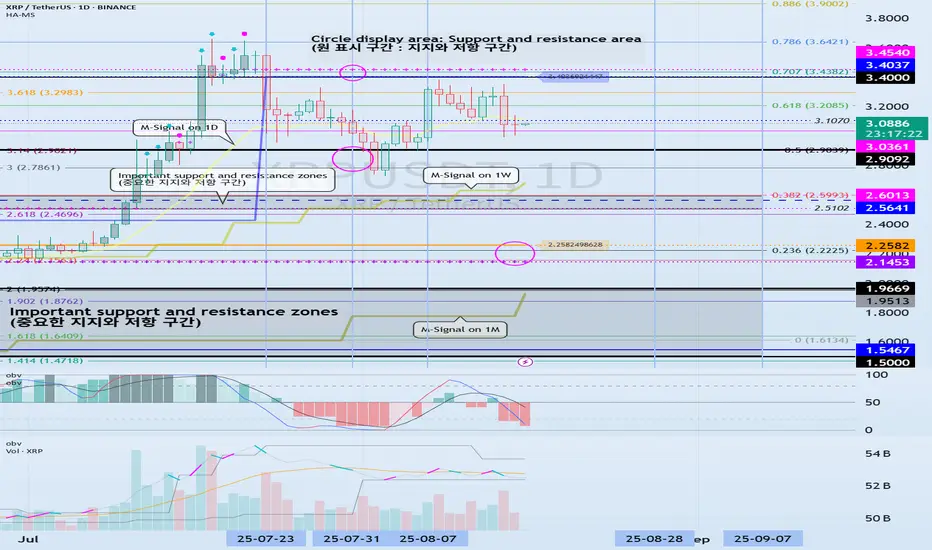
Check if the price can hold above 2.9092
Hello, traders.
If you "Follow" us, you'll always get the latest information quickly.
Have a great day.
-------------------------------------
(XRPUSDT 1D Chart)
If the price falls below the 1.5-1.9669 range, a major downtrend is likely to begin.
To maintain the uptrend, the price must hold above the 2.5102-2.6013 range.
If the price falls below the M-Signal on the 1D chart, it is highly likely to meet the M-Signal indicator on the 1W chart.
In that sense, we should check for support around the previous all-time high (ATH) area of 2.9092.
The next period of volatility is around August 28th.
However, since BTC's volatility period is around August 24th, you should closely monitor its movements from around that time.
-
(1M Chart)
While it's virtually impossible to predict the price as it's currently hitting a new all-time high (ATH), the area marked by a circle could potentially become a resistance zone.
The key is whether the price can maintain its upward momentum above the Fibonacci range of 0.618 (3.2085) on the right and 3.618 (3.2983) on the left.
The Fibonacci range on the left was drawn during the first wave.
-
Thank you for reading.
I wish you successful trading.
--------------------------------------------------
- This is an explanation of the big picture.
(3-year bull market, 1-year bear market pattern)
I will explain in more detail when the bear market begins.
------------------------------------------------------
Important Area: 0.30771-0.33084
Hello, fellow traders!
Follow us to get the latest information quickly.
Have a great day!
-------------------------------------
(TRXUSDT 1D Chart)
TRX is one of those coins (tokens) that has a lot of users, yet feels neglected.
For TRX to maintain its uptrend, the price must remain above the 0.30771-0.33084 range.
The circled areas represent important support and resistance zones.
When the M-Signal indicator on the 1W chart rises near the 0.30771-0.33084 range, a price decline below that level is highly likely to trigger a downtrend.
-
Thank you for reading to the end.
I wish you successful trading.
--------------------------------------------------
- This is an explanation of the big picture.
(3-year bull market, 1-year bear market pattern)
I will explain in more detail when the bear market begins.
------------------------------------------------------

Next Volatility Period: Around August 24th
Hello, traders!
Follow us to get the latest updates quickly.
Have a great day!
-------------------------------------
(BTCUSDT 1D Chart)
After this volatility period, the price has re-entered the 115854.56-119177.56 range.
Accordingly, the key question is whether the price can rise after finding support in the 115854.56-119177.56 range.
The next volatility period is around August 24th (August 23rd-25th).
----------------------------------------
To determine the volatility period, support and resistance points and trend lines must be drawn on each timeframe chart.
Support and resistance points are drawn using the DOM(60), HA-High, HA-Low, and DOM(-60) indicators included in the HA-MS indicator.
Trend lines are drawn by connecting the points where the K value of the StochRSI indicator forms peaks in overbought or oversold zones.
Therefore, the trend line is drawn by connecting the peaks formed in overbought zones with a high trend line and the peaks formed in oversold zones with a low trend line.
If these two trend lines form a channel, the trend is likely to continue. If the trend lines intersect, a new trend is likely to be created.
(1M Chart)
The trend lines on the 1M chart are not specifically distinguished between high and low trend lines, but are instead displayed in a single color.
This is because we determined that distinguishing between them is unnecessary, as they represent long-term trends.
When creating trend lines, you must use peaks created in overbought or oversold areas.
The 1M chart displays a dotted trend line, which connects points in overbought or oversold areas that do not have peaks.
These trend lines are not used to determine periods of volatility.
(1W Chart)
Draw support and resistance points and trend lines on the 1W chart, just like on the 1M chart.
When possible, draw trend lines only from recently created peaks and delete previously drawn trend lines.
(1D Chart)
Draw support and resistance points and trend lines on the 1D chart, just like on the 1M and 1W charts.
The points where these support and resistance points and trend lines intersect or intersect are used to identify periods of volatility.
When possible, areas where multiple support and resistance points and trend lines intersect or intersect are considered periods of high volatility.
Also, since trend lines on 1M > 1W > 1D charts differ in accuracy, it's best to select points where they intersect more frequently when utilizing trend lines drawn on 1D charts.
-
Indicators or other analysis techniques created by others require long-term observation to understand and utilize.
Therefore, rather than defining them as right or wrong, consider them as possible and consistently check real-time data to make them your own.
-
Thank you for reading to the end.
I wish you successful trading.
--------------------------------------------------
- This is an explanation of the big picture.
(3-year bull market, 1-year bear market pattern)
I will explain in more detail when the bear market begins.
------------------------------------------------------

ETH's next volatility period: around August 28th
Hello, traders!
Follow us to get the latest information quickly.
Have a great day!
-------------------------------------
(ETHUSDT 1D chart)
This volatility period for ETH is expected to last until August 15th.
Therefore, caution is advised when trading.
The key question is whether the price can rise above the previous all-time high (ATH) of 4868.0.
Currently, the key support and resistance levels are 3900.73-4107.80.
Therefore, even if there is a further decline, if the price remains within the 3900.73-4107.80 range or higher, the upward trend is expected to continue.
Currently, the HA-High indicator is formed at 3708.87, so it's important to check whether a new HA-High indicator is formed if a further decline occurs.
The formation of the HA-High indicator indicates a decline from the high, so determining whether support is found near that level is crucial.
While ETH's volatility period is around August 28th, BTC's volatility period is around August 24th. Therefore, it's important to monitor how the price moves during this period.
-
Thank you for reading.
We wish you successful trading.
--------------------------------------------------
- Here's an explanation of the big picture.
(3-year bull market, 1-year bear market pattern)
I'll explain more in detail when the bear market begins.
------------------------------------------------------

XAGUSDReasons for entering the trade:
1- MACD and RSI divergence (4H)
2- Break of the latest low/high (1H)
3- Price action (weak upward movement and strong downward movement) (1H)
4- Bermuda Kumo (15M)
Entry: 38.32200
TP: 37.76300
SL: 38.60241

The key is whether it can rise above 5.886.
Hello, fellow traders!
If you "Follow" me, you'll always get the latest information quickly.
Have a great day.
-------------------------------------
I don't necessarily recommend coins (tokens) that exhibit this behavior.
However, if you have spare funds or have or can generate significant profits from other coins (tokens), I think it's worth looking into these coins (tokens) when they're ready to trade.
The key is to maintain the price above the M-Signal indicator on the 1M chart.
-------------------------------------
(CVXUSDT 1M Chart)
CVX is showing signs of rising above the M-Signal indicator on the 1M chart.
If the price remains above the M-Signal indicator on the 1M chart, the upward trend is likely to continue.
-
(1W Chart)
After a prolonged period of sideways movement, the HA-Low and HA-High indicators on the 1W chart have converged, and the price has risen above the M-Signal indicator on the 1M chart.
Therefore, the 2.862-3.412 range is considered a support area.
If it falls below the 2.862-3.412 range, you should stop trading and wait and see how things go.
The DOM (60) indicator is forming at 5.886, so a break above this level is highly likely to initiate a stepwise uptrend.
Therefore, the key question is whether it can find support near 4.116 and rise above 5.886.
-
(1D chart)
The key question is whether it can find support in the 4.418-4.902 range and rise.
You should observe the transition from the M-Signal on the 1D chart > the M-Signal on the 1W chart > the M-Signal on the 1M chart.
If the M-Signal indicators are aligned correctly, a full-scale uptrend is likely to begin.
-
Thank you for reading to the end.
I wish you successful trading.
--------------------------------------------------
- Here's an explanation of the big picture.
(3-year bull market, 1-year bear market pattern)
I'll explain more in detail when the bear market begins.
------------------------------------------------------

ETH ETF Inflows Surge to $1B; BitMine Eyes $20B ETH AccumulationInvestor confidence in Ethereum is reaching new heights. Spot Ethereum ETFs have recorded a record-breaking inflow of over $1 billion in a single day, marking a significant milestone in institutional adoption of ETH. Among them, one major ETF stood out with an extraordinary $640 million in new capital, signaling renewed conviction in Ethereum’s growth trajectory.
This ETF momentum comes amid broader market sensitivity to macroeconomic developments. Recent U.S. inflation data suggests cooling price pressures, increasing expectations of a September Federal Reserve rate cut — a bullish signal for risk assets like cryptocurrencies.
Behind the headlines, BitMine Immersion Technologies, led by Tom Lee, is ramping up its ETH accumulation strategy. A recent corporate filing shows the company intends to raise up to $20 billion via new stock offerings, aiming to purchase additional ETH and secure a sizable institutional treasury position. Their existing holdings already approach a staggering $5 billion in ETH.
These developments underscore a broader shift: ETH is fast becoming a strategic reserve asset for companies and funds, not merely a speculative holding. The convergence of ETF inflows, on-chain demand, and bullish macro signals points to a sustained rally.
Market impact: While Bitcoin has shown slight retracement amid uncertainty over monetary policy, Ethereum’s strength may indicate a deeper divergence — potentially shifting investor preference toward smart contract platforms with strong real-world use cases.
For investors seeking next-level yield and sustainability, Ethereum continues to emerge as a compelling play. The alignment of institutional flows, strategic corporate treasury decisions, and favorable monetary policy suggests this rally could be more than a technical breakout — it may mark a structural re-evaluation of Ethereum’s role in modern finance.

Support and Resistance Areas: 114454.57-115854.56
Hello, traders!
Follow us to get the latest information quickly.
Have a great day!
-------------------------------------
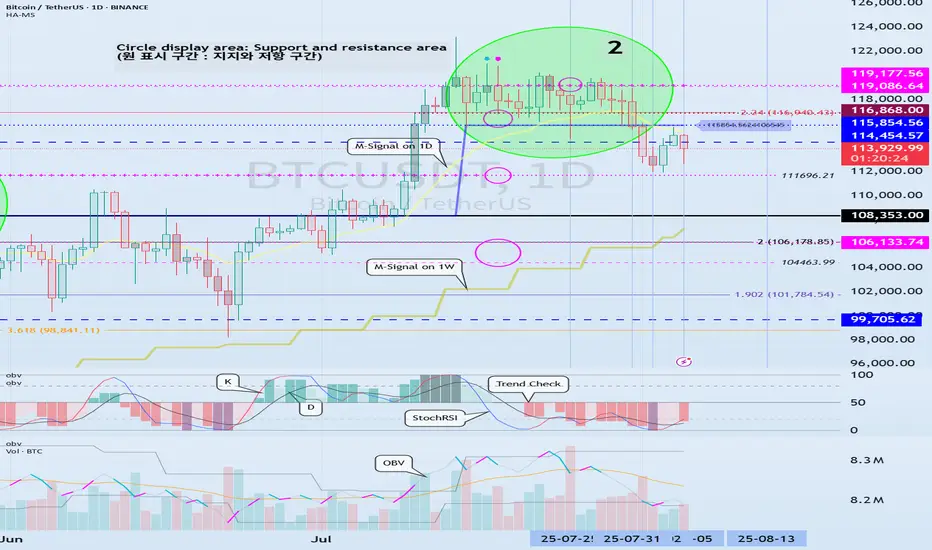
(BTCUSDT 1D Chart)
The K indicator on the StochRSI indicator appears to have entered the overbought zone, leading to a change in slope.
Therefore, the upward trend appears likely to be constrained.
-
We need to confirm whether the price falls within the range indicated by the index finger.
The key question is whether there is support around 114454.57-115854.56.
If it declines, it is likely to continue until it meets the M-Signal indicator on the 1W chart.
At this point, we need to check for support around 108353.0.
This period of volatility is expected to occur around August 13th (August 12th-14th).
The start of a stepwise uptrend is likely to occur only after it rises above 119177.56.
-
Thank you for reading to the end.
We wish you successful trading.
--------------------------------------------------
- This is an explanation of the big picture.
(3-year bull market, 1-year bear market pattern)
I will explain in more detail when the bear market begins.
------------------------------------------------------

Next Volatility Period: Around August 21
Hello, traders.
Please "Follow" to get the latest information quickly.
Have a nice day today.
-------------------------------------
#TSLA
We need to see if it is rising along the rising channel.
The key is whether it can rise with support near 311.48 to break out of the downtrend line.
The key is whether it can rise along the short-term uptrend line and break through the short-term downtrend line after passing through this volatility period around July 25.
Therefore, we need to see whether it can rise above the 347.21-382.40 range with support near 311.48.
The next volatility period is expected to be around August 21.
-
The important thing is to maintain the price above the M-Signal indicator on the 1M chart.
If not, there is a possibility of a long-term downtrend.
Therefore, if it shows support in the 268.07-311.48 range, it is a time to buy.
-
Thank you for reading to the end.
I hope you have a successful trade.
--------------------------------------------------

The key is whether the price can hold above 3900.73-4107.80
Hello, fellow traders!
Follow us to get the latest information quickly.
Have a great day.
-------------------------------------
(ETHUSDT 1D chart)
This period of volatility is expected to last from around August 6th to 14th (maximum from August 5th to 15th).
The key question is whether the price can find support and rise above the 3900.73-4107.80 range after this period of volatility.
The next period of volatility is expected to occur around August 28th, so we need to see if the price can hold until then.
If the price declines, we need to check for support around the HA-High ~ DOM (60) range of 3708.87-3762.33.
If not, there's a chance it could fall below 3265.0-3321.30.
-
(1M Chart)
The TC (Trend Check) indicator has risen above 0, suggesting a high possibility of further upside.
Therefore, the key point to watch is whether it can rise above the 4630.26-4868.0 range.
For an uptrend to continue,
- The StochRSI indicator must remain upward with K > D.
(If possible, it's best to avoid K entering the overbought zone.)
- The On-Board Volume (OBV) indicator of the Low Line ~ High Line channel must remain upward.
(If possible, it's best to maintain OBV > OBVEMA.)
- The TC (Trend Check) indicator must remain upward.
(If possible, it should remain above 0.)
If the above conditions are met, the uptrend is likely to continue.
To sustain an uptrend by breaking above key support and resistance levels,
- The StochRSI indicator must remain below the overbought zone and remain above D.
- The On-Board Volume (OBV) indicator of the Low Line ~ High Line channel must rise above the High Line and remain upward.
- The TC (Trend Check) indicator must remain upward. (If possible, it should remain above the 0 point.)
When the above conditions are met, there is a high probability that the price will rise after breaking above important support and resistance levels.
-
Thank you for reading to the end.
I wish you successful trading.
--------------------------------------------------
- Here's an explanation of the big picture.
(3-year bull market, 1-year bear market pattern)
I will explain more in detail when the bear market begins.
------------------------------------------------------

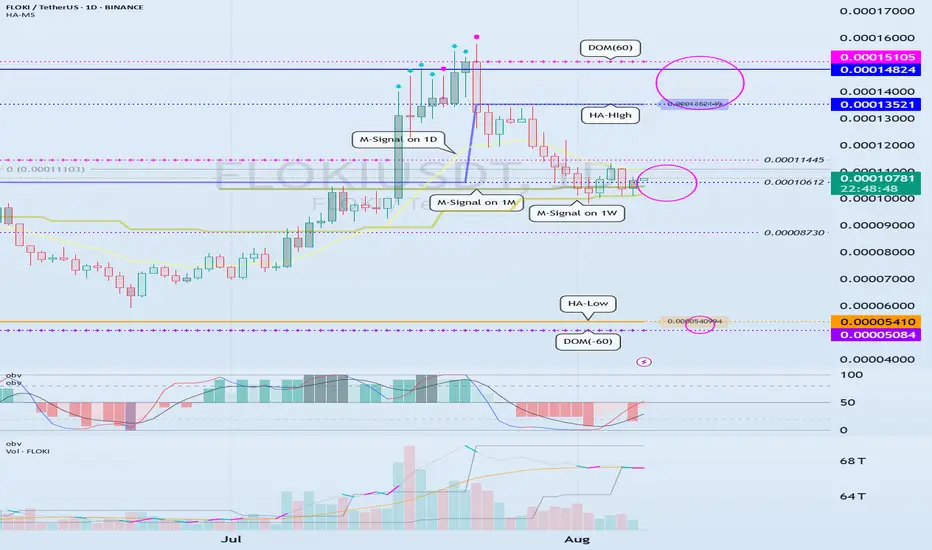
Examples of Conditions for Starting a Trade
Hello, fellow traders!
Follow us to get the latest information quickly.
Have a great day!
-------------------------------------
This time, I'm going to talk about when to start and when to close a trade.
Trading has no beginning or end.
In other words, you can start a trade at any time and close it at any time.
The only question is whether you can profit from the time you start the trade and when you close it.
Therefore, it's best to be clear about why you need to start trading.
In other words, you need to be able to explain why you need to start trading now.
If you can't, it's best not to start trading.
You should also be able to explain why you're closing the trade now or selling in installments.
If you can't, it's likely that you don't have a well-established trading strategy.
A trading strategy should be developed from a broad perspective.
After that, you should develop a detailed response strategy that stabilizes your psychological state according to price volatility and guides your trading accordingly.
Therefore, a basic trading strategy is essential.
This basic trading strategy may vary depending on your investment style, so it's important to establish a basic trading strategy that suits you.
My basic trading strategy is to buy in the DOM(-60) ~ HA-Low range and sell in the HA-High ~ DOM(60) range.
------------------------------------------------------------------------------
To initiate a trade, you can determine whether support is available at important support and resistance levels or areas.
The optimal range for this is when support is found and the price rises in the DOM (-60) ~ HA-Low range.
This corresponds to the conditions for trading on the Heikin-Ashi chart.
-
Next, the M-Signal indicators on the 1M, 1W, and 1D charts converge and break upward, sustaining the price.
In other words, the price rises when support is found around the current price range of 0.000010612-0.00011445.
This represents an important turning point from a trend perspective.
-
If you bought in the above range, the sell range would be 0.00013521-0.00014824.
This sell zone corresponds to the high point, HA-High ~ DOM(60).
This means that a stepwise uptrend, or a full-blown uptrend, is likely to begin only when the price rises above the HA-High ~ DOM(60) range.
-
If you start trading at other support and resistance points or zones, it can be difficult to respond to price volatility.
Therefore, it's best to check for support and initiate trading within the DOM(-60) ~ HA-Low and HA-High ~ DOM(60) zones, if possible.
From a trend perspective, if the M-Signal indicators on the 1M, 1W, and 1D charts converge, and the price breaks upward and sustains, as is currently the case, trading is possible if support is found at the support and resistance levels near those points.
While this trading method cannot guarantee profit, it is worth developing a trading strategy and attempting it.
-
Thank you for reading to the end. I wish you successful trading.
--------------------------------------------------
August is a key turning point
Hello, fellow traders!
Follow us to get the latest information quickly.
Have a great day!
-------------------------------------
(ABNB 1M chart)
ABNB is at a key turning point.
The key question is whether it can find support near 126.34 and rise.
-
(1D chart)
The key is whether the price can rise after finding support in the 126.34-133.72 range.
If it falls below 133.72,
1st: 112.91-118.67
2nd: 97.35-106.30
We need to check for support near the 1st and 2nd levels above.
We'll have to wait and see whether this decline is temporary.
This is because the Low Line ~ High Line channel's On-By-Volume (OBV) indicator shows convergence between the Low Line and High Line.
The next period of volatility is expected to begin around August 20th.
-
Thank you for reading.
I wish you successful trading.
--------------------------------------------------

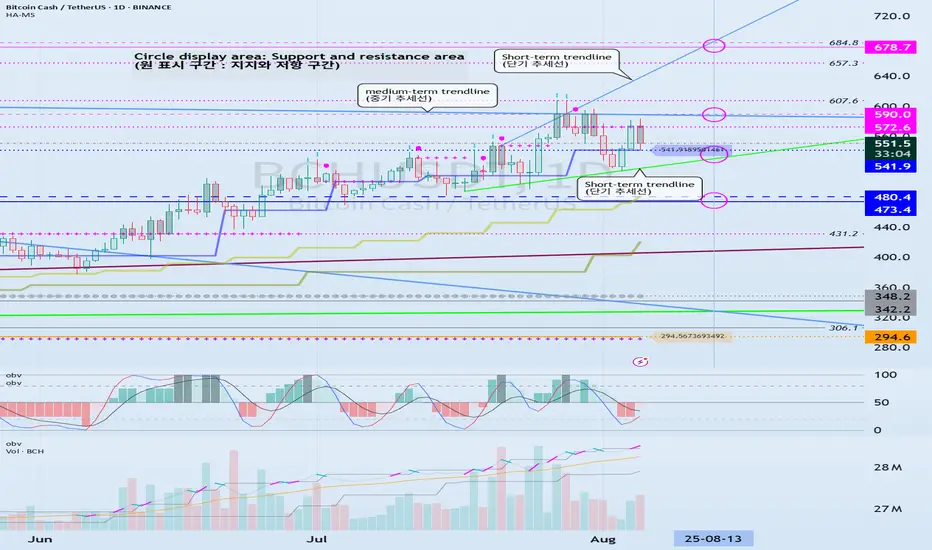
The key is whether it can rise above 590.0
Hello, fellow traders.
Follow us to get the latest information quickly.
Have a great day.
-------------------------------------
(BCHUSDT 1M Chart)
If the price holds above 473.4, it is expected to attempt to rise above 678.7.
-
(1D chart)
The key is whether the price can find support in the 541.9-572.6 range and rise above 590.0.
If it falls below 541.9, we need to check for support near 473.4.
The upward trend is expected to continue only if it breaks above the intermediate-term trend line.
-
Thank you for reading.
I wish you successful trading.
--------------------------------------------------
- This is an explanation of the big picture.
(3-year bull market, 1-year bear market pattern)
I will explain in more detail when the bear market begins.
------------------------------------------------------
Next Volatility Period: Around August 13th (August 12th-14th)
Hello, fellow traders!
Follow us to get the latest information quickly.
Have a great day!
-------------------------------------
(USDT 12M Chart)
A lot of money has been flowing into the coin market through USDT.
A decline in USDT indicates capital outflow from the coin market.
(USDT.D 12M chart)
As USDT continues to rise, its dominance naturally rises.
However, if USDT is used to purchase coins (tokens) in the coin market, its dominance will decline.
USDT dominance peaked in 2022 and is showing a downward trend.
This indicates that a significant amount of capital flowing into the coin market was used to purchase coins (tokens).
USDT dominance is expected to fall to around 2.84 this year before beginning an upward trend, marking the end of its three-year bull market.
I believe this trend will inject new vitality into the coin market.
For the coin market to maintain an upward trend, USDT dominance must remain below 4.91 or show a downward trend.
If this fails and the price rises above 4.91, the coin market is likely already in a downward trend.
A decline occurred on May 8, 2025, creating a reverse trend.
To maintain this reverse trend, we need to see if it can fall below 4.24.
If USDT dominance declines, the coin market is likely to show an upward trend.
------------------------------------------------------
(BTCUSDT 1D chart)
As the new week begins, the HA-High indicator on the 1W chart is showing signs of forming a new level at 114454.57.
Accordingly, the key question is whether the price can rise after finding support in the 114454.57-115854.56 range.
The formation of the HA-High indicator means that the price has fallen from its high.
This also means that further declines are highly likely.
Therefore, if possible, the price should rise above the 114454.57-115854.56 range and maintain its upward momentum.
This period of volatility is expected to last until August 6th.
Therefore, the key question is whether the price can rise above the 114454.57-115854.56 range after the volatility period.
If not, we assume the price will decline until it meets the HA-Low indicator and consider countermeasures accordingly.
This is because the HA-Low and HA-High indicators are paired.
As the price declines, indicators such as the HA-Low or DOM(-60) may appear.
Therefore, if the price declines, you should monitor for the emergence of indicators such as the HA-Low or DOM(-60).
The basic trading strategy is to buy between the DOM(-60) and HA-Low ranges and sell between the HA-High and DOM(60) ranges.
-
If the price falls below the M-Signal indicator on the 1D chart, it is highly likely that the trend will be re-established upon meeting the M-Signal indicator on the 1W chart.
Therefore, if the price fails to rise to the 114454.57-115854.56 range, it is highly likely that the price will eventually meet the M-Signal indicator on the 1W chart.
At this time, a key support and resistance level is expected to be around 108353.0.
When new support and resistance levels are formed, they must remain horizontal for at least three candlesticks to function as support and resistance.
In other words, the HA-High indicator on the 1W chart is showing signs of forming, but it hasn't yet.
Therefore, if the current price holds this week, it will form next week.
Therefore, for the HA-High indicator to function properly as support and resistance, it must remain horizontal for three candlesticks, or three weeks.
This rule must be acquired through significant time and observation.
-
If you sold partially in the 115854.56-119177.56 range according to your basic trading strategy, you will find it easier to observe the current movement. If not, you will likely become anxious.
The key to trading is maintaining a stable psychological state.
If you begin to feel anxious, you should consider how to stabilize your psychological state.
Otherwise, you'll end up making the wrong trades.
-
Thank you for reading to the end.
I wish you successful trading.
--------------------------------------------------
- Here's an explanation of the big picture.
(3-year bull market, 1-year bear market pattern)
I'll explain more in detail when the bear market begins.
------------------------------------------------------
Check if it can rise to around 0.5452
Hello, traders. Nice to meet you.
If you "Follow" us, you'll always get the latest information quickly.
Have a great day.
-------------------------------------
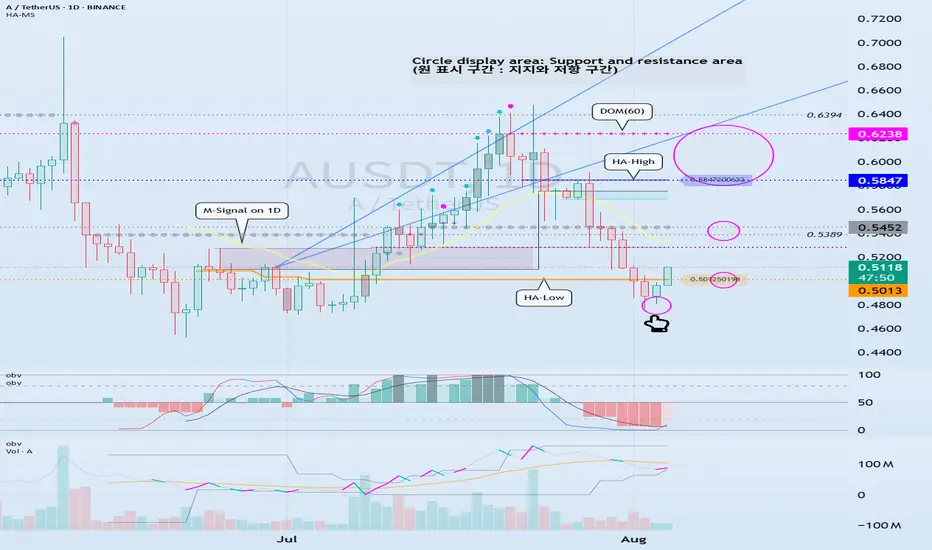
(AUSDT 1D chart)
It hasn't been long since EOS changed to A.
Nevertheless, the formation of the HA-Low and HA-High indicators suggests that a wave has begun to form.
However, since the DOM (-60) indicator hasn't yet formed, if it fails to find support from the HA-Low indicator, further declines could occur, so we need to consider countermeasures.
With the HA-Low and HA-High indicators in place, we can now trade in line with our basic trading strategy.
In other words, this refers to a trade where you buy in the DOM(-60) ~ HA-Low range and sell in the HA-High ~ DOM(60) range.
This ultimately refers to a trading strategy within a box range.
Trend trading strategies proceed by either rising in the HA-High ~ DOM(60) range or falling in the DOM(-60) ~ HA-Low range.
In other words, a rise in the HA-High ~ DOM(60) range is likely to lead to a stepwise uptrend, while a decline in the DOM(-60) ~ HA-Low range is likely to lead to a stepwise downtrend.
In this sense, key support and resistance levels are the 0.5013 point and the 0.5847-0.6238 range.
Currently, the price is rising above 0.5013, so if support is found around 0.5013, it would be a good time to buy.
The first sell zone is around 0.5452, where a volume profile zone has formed.
If the price rises above this level and maintains, it is expected to continue upward, likely reaching the 0.5847-0.6238 range.
-
The low trendline has not yet been formed.
The low of the candlestick indicated by the finger is the first selection point for drawing the low trendline.
Since a high trendline has been formed, we should also examine whether the price can rise along the high trendline.
-
Thank you for reading to the end.
I wish you successful trading.
--------------------------------------------------
- This is an explanation of the big picture.
(3-year bull market, 1-year bear market pattern)
I will explain in more detail when the bear market begins.
------------------------------------------------------