EUR/NZD – Weekly breakdown trigger from rising wedgeEUR/NZD is getting squeezed.
Price has been walking up inside a rising wedge for a while, but it’s starting to look tired right around that 2.02–2.05 area. I’m not interested in guessing the top. I only want it if it actually breaks.
Game Plan
No trade unless we get a weekly close under 2.020
Ideally it breaks, then comes back to 2.02 and fails.
Targets
1.990 first trouble area
1.980 next support
Invalidation
If it reclaims and holds above 2.050, I’m out / not taking it. That’s basically the wedge saying “false alarm”.
Simple one: wait for the weekly confirmation. If it doesn’t give it, I’m happy to sit on my hands.
Breakdown

Jan 14 Volatility UpdateThis video highlights what I believe will happen after the Jan 14 volatility event.
I believe the markets are moving through a Flag Apex phase that will result in Apex Volatility over the next 10+ days.
This volatility could present a present a very real potential that price could continue to move downward before finding support.
I believe this move could present a very decent opportunity for traders as price rotates for about 10+ days. Then, price should move into a fairly solid downtrend after Jan 25-28.
Get some

EURUSD SELL NOW Script Name - EURUSD
Position - SELL SIDE
Time frame :
Monthly - Coming to support
Day - Descending Channel Forming and market in Top
1Hr - Breakout the Structure
Entry - 1.16136
Target - 1.14823
Stoploss - 1.16560
This view only for Eduactional Purpose
Happy Trading ...

Xau/Usd - Gold Testing Key Resistance, Breakout or Rejection?Gold is currently trading around $4,016, testing a key resistance zone after several rejections in the past sessions. Price action shows a clear ascending trendline support, forming higher lows, indicating a short-term bullish structure.
Key Technicals
Resistance Zone: $4,015 – $4,025
Trendline Support: Connecting recent higher lows (Nov 5–8)
Structure: Ascending channel / uptrend continuation setup
Possible Scenarios
Bullish Breakout:
A confirmed breakout above the resistance zone with strong volume could signal continuation toward the next target levels around $4,060 – $4,100.
Bearish Rejection:
If price fails to break above resistance and closes below the trendline support, expect a correction toward $3,960 – $3,940 as the next support zone.
Trading Plan
Buy Breakout: Above $4,025 with confirmation
Sell Rejection: Below $4,000 and trendline break
Risk Management: Use stop-loss below last swing low or above last swing high depending on entry
Note
Wait for clear confirmation before entering either direction — this area has been a strong liquidity zone recently.

ETHUSD Ascending channel breakdown selling strong🚨 ETHUSD Technical Update 🚨
📉 Breakdown Alert!
ETHUSD has officially broken down from its ascending channel and key support area around $3,950 — signaling potential bearish momentum ahead.
💥 Selling Zone: $3,950
🎯 Technical Target: $3,700 (next major support zone)
📊 Indicators:
✅ EMA 50 breakdown confirmed — bearish bias strengthening.
⚠️ EMA 20 is crossing down toward the EMA 50, which could confirm further downside pressure.
🧭 Bias: Bearish below $3,950
💡 Watch for potential retests of the breakdown zone before continuation lower.
#ETH #Ethereum #CryptoAnalysis #TechnicalAnalysis #TradingSetup #BearishSignal 🐻📉

EURUSD Ascending Channel Breakdown selling from supply Zone📉 EUR/USD Technical Breakdown Alert!
The pair has broken down from an ascending channel and is currently selling off from the supply zone around 1.1680 💥
🕒 30-Minute Time Frame Analysis
🎯 Downside Targets:
1️⃣ 1.1640 — First Support Zone
2️⃣ 1.1620 — Key Support Area
3️⃣ 1.1560 — Major Support Zone
💬 Momentum favors the bears as long as price stays below 1.1680.
Keep an eye on reaction at each support level for potential scalps or continuation setups. ⚠️
#EURUSD #Forex #PriceAction #TechnicalAnalysis #FXTrading #BearishSetup

GBPUSD Ascending channel breakdown selling from supply zone💥 #GBPUSD Technical Setup 💥
The pair has broken down from an ascending channel and is now selling off from the resistance area near 1.34400 🔻
Momentum favors the bears on the 30M timeframe 🕒
🎯 Technical Targets:
1️⃣ 1.33900 – First support
2️⃣ 1.33400 – Next support
3️⃣ 1.32600 – Major support zone
As long as price stays below 1.34400, the bearish bias remains strong ⚠️
#GBP #Forex #Trading #FX #TechnicalAnalysis #Breakdown

BTCUSD EMA50 Breaked and bullish trend breakdown (Readmore)..🚨#BTCUSD Technical Update 🚨
📉 Bitcoin shows bearish momentum after a confirmed uptrend breakdown and EMA 50 breach on the 1H timeframe.
🔍 Price action suggests sellers are taking control, with momentum shifting to the downside.
🎯 Selling Targets:
1️⃣ First Target: $106,400
2️⃣ Second Target: $104,500
⚠️ Invalidation: A sustained move back above the EMA 50 could signal a potential recovery — stay cautious and manage risk carefully!
#Bitcoin #BTC #CryptoAnalysis #TechnicalAnalysis #BTCUSD 💰📊

XAUUSD Bearish analysis EMA50 Breakdown 📉 XAUUSD (Gold) Technical Update 💰
Gold faced strong rejection from the major supply zone around 4375 🔻
After breaking below the 50 EMA, bearish momentum is clearly building on the 30M timeframe ⚙️
Current Price: 4330 🟡
🎯 Technical Targets:
1️⃣ 4313 – First support level
2️⃣ 4287 – Second target zone
📍 Key Demand Zone: Around 4207, where buyers may look to step in again 🏦
💡 Bias: Bearish below 4375 / Watch for reactions near 4313 and 4287 for potential short-term scalps or pullbacks.
#XAUUSD #Gold #PriceAction #ForexAnalysis #TechnicalAnalysis #TradingSetup #BearishTrend 📊

AUDUSD breakdown:Hidden oppportunity while Gold grabs headlines?While everyone's watching gold hit fresh records after Trump's China tariff threats, there's an overlooked opportunity in AUDUSD that could be setting up for a major breakdown.
The Australian dollar just broke key support at 0.6520 against the USD, creating a fundamental and technical alignment for further downside. With Australia sending 63% of its exports to China, any trade war escalation directly impacts the Aussie dollar.
Key Drivers:
Trade War Impact : Australia's heavy dependence on China makes AUD vulnerable to US-China trade war escalation
Technical Breakdown : Break below 0.6520 support with Fibonacci targets at 0.6443, 0.6311, and 0.6254
Dollar Strength : Government shutdown paradoxically supports USD strength by removing spending and debt payments from the equation
RSI Momentum : RSI shows room for further decline with potential head and shoulders pattern forming, targeting the neckline first
This macro/technical alignment presents a strong trading setup. When others chase gold headlines, smart traders can position for the AUD breakdown. Trade smart, respect the levels, and don't miss this overlooked opportunity.
This content is not directed to residents of the EU or UK. Any opinions, news, research, analyses, prices or other information contained on this website is provided as general market commentary and does not constitute investment advice. ThinkMarkets will not accept liability for any loss or damage including, without limitation, to any loss of profit which may arise directly or indirectly from use of or reliance on such information.

Not Cancelling NFLX... but it is looking a little weak still. Will we flush the recent lows today? Or is this a bottoming space. This could be the buy zone for investors.
+ Earnings 10/21
+ Wide range after a strong move up (at bottoms)
**I'll be Netflixing & chilling this weekend. There is a broad selection of content to entertain a variety of interests. I will watch what informs and/or entertains me. I hope you find time to do the same.

Keurig Dr Pepper (KDP) – Triangle Breakdown with Heavy VolumeOn the Weekly timeframe, KDP has broken down from a Triangle pattern , with price also pushing below the first major support zone while volume increased.
Typically, Triangle patterns project a move equal to the triangle’s widest range. Based on this, the chart suggests a possible continuation towards the $18–20 zone.
There is also a notable gap area around $15, which could act as a magnet for price if selling pressure continues.
RSI is already oversold territory, and MACD is deep in negative momentum. This may result in a short-term bounce or correction upward before continuing the downside move.
However, it’s important to remember that patterns do not always play out fully — sometimes reversals occur before reaching the projected target.
Key Takeaway:
This analysis is not a call to short the stock. It is a cautionary outlook for those considering BUY positions. Given the strong breakdown and technical signals, it may be wiser to remain patient until stronger signs of reversal appear.
(For educational purposes only, not financial advice.)

Aster vs Hyperliquid – Value BreakdownWas just taking a closer look at GETTEX:HYPE vs $ASTER. Both projects are moving fast, but the fundamentals tell two very different stories.
Hyperliquid ( GETTEX:HYPE ):
Fully Diluted Valuation (FDV): $46.7B
Annualized Fees: $1.1B
30D Perp Volume: $300B
Volume = ~2% of the entire stablecoin market
Valuation multiple: 42.5x fees
Aster ($ASTER):
Fully Diluted Valuation (FDV): $16.5B
Annualized Fees: $110M
30D Perp Volume: $27.7B
Valuation multiple: 150x fees
Takeaway:
While $ASTER has seen explosive early performance, the fee-to-FDV ratio is stretched. Meanwhile, GETTEX:HYPE is already generating serious fee revenue and market share, making it fundamentally a stronger value proposition even at current levels.

"BTC at Critical Reversal Zone – Watch This Key Liquidity Trap
"BTC at Critical Reversal Zone – Watch This Key Liquidity Trap 🎯"
Market Structure Overview
BOS (Break of Structure): Multiple BOS points indicate shifts in trend phases, first to the downside (end of July to early August) and then back to the upside.
BOL (Break of Low): This marked a key liquidity grab before the reversal rally began.
Liquidity Zones: The chart highlights both sell-side liquidity (below lows) and buy-side liquidity (above highs), showing where institutional traders hunt stops.
2. Key Supply & Demand Zones
Support Zone (112,500 – 114,500): This level acted as a demand base after the liquidity sweep in early August. Price reacted strongly here, triggering the bullish leg.
Previous Resistance (121,500 – 122,500): This zone has capped price multiple times, making it a critical area for sellers to defend.
3. Current Trade Setup
Entry Zone: Around 120,000 – 120,400, where a short setup is triggered upon rejection.
Stop Loss: Above 122,120, just beyond the resistance to avoid premature stop-outs.
Target: 116,500 – aligning with prior liquidity pools and structural support.
4. Educational Takeaways
Liquidity Hunts: Notice how price often spikes into liquidity pools before reversing—this is common in BTC’s volatile environment.
Confluence Trading: The short setup aligns with resistance retest + liquidity grab + BOS, increasing probability.
Risk Management: Using defined zones for stop loss and target helps maintain a favorable risk/reward ratio.
Summary:
BTC is currently respecting the higher-timeframe resistance zone, with a clear short-term bearish setup in play. A rejection from the entry zone could trigger a drop toward the 116,500 target. Traders should monitor price action closely and avoid chasing entries—patience and precision are key.

BTC Dominance Breakdown – Altseason 2025 Loading? The BTC Dominance chart is flashing a familiar pattern we last saw before the explosive 2021 Altseason — and history might be about to rhyme. Let’s break it down:
BTC Dominance has once again tapped the same multi-year resistance trendline (red line).
Price has been riding a rising wedge since early 2022 — a pattern that typically resolves to the downside.
Last week, dominance rejected from the resistance zone and broke below wedge support.
Key Technicals:
Resistance Trendline: Serving as a multi-year ceiling since 2019.
Support Trendline: Rising wedge support now broken, opening the door for a deeper decline.
Current Level: 60.81% — sitting right below the breakdown zone.
What This Means for the Market:
If dominance continues to fall, altcoins could see significant capital inflows.
A sustained drop could trigger an Altseason 2.0, with high-beta alts outperforming BTC.
Watch for BTC to consolidate or move sideways — this typically accelerates altcoin gains.
Confirmation & Invalidations:
✅ Bullish for alts if:
Dominance closes weekly candles below 60%.
Momentum builds to retest lower dominance support levels (50%-55%).
❌ Invalidation:
A reclaim of wedge support + breakout above 67% would kill the altseason narrative in the short term.
📌 Conclusion:
BTC Dominance is at a critical turning point. History suggests we could be on the verge of a powerful altcoin cycle if the breakdown sustains.
Patience and positioning are key — the biggest alt rallies start when most traders are still skeptical.
💬 What do you think — are we about to witness Altseason 2025? Drop your thoughts below.

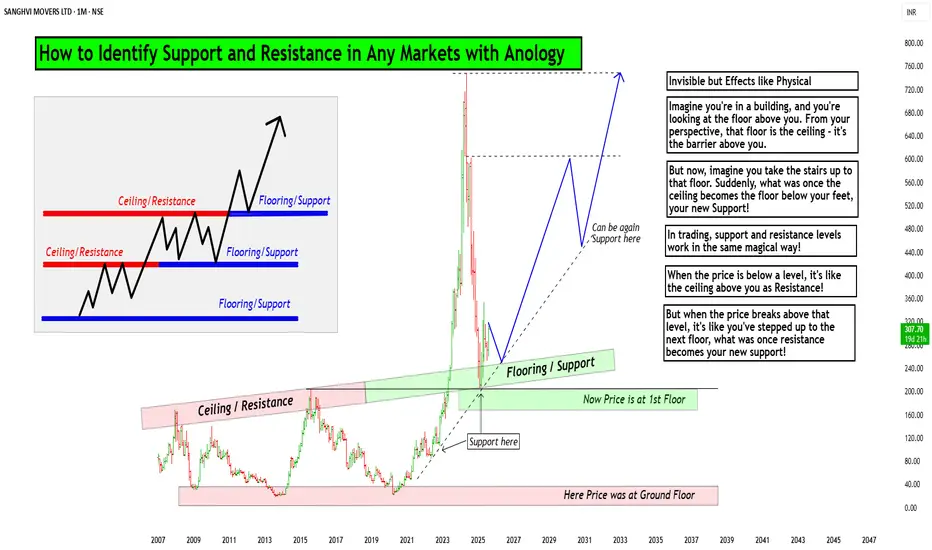
How to Identify Support and Resistance in Markets with AnologyHello Friends,
Welcome to RK_Chaarts,
Today we are going to learn & understand real work of Supports and Resistances in markets,
and Market structure with very good examples (Educational Post)
The Market's Architecture: Support and Resistance
This is an excellent analogy for understanding two of the most worthful concepts in technical analysis: support and resistance. By thinking of the market as a multi-story building, we can visualize how price moves and what happens when it hits certain levels.
- The Core Analogy: The Building and the Elevator
- Imagine the market as a large building with many floors. The price of an asset (like a stock or a cryptocurrency) is like an elevator moving up and down within this structure. The floors and ceilings of the building are not physical barriers but represent specific price points that the market has collectively agreed upon as important.
- The Floor (Support)
The floor of a building provides a solid base and prevents the elevator from falling further. In the market, this is called a support level. A support level is a price point where buying pressure is strong enough to stop the price from declining. When the "elevator" (price) reaches the floor, it finds enough buyers to give it a lift, preventing a deeper fall. A strong support level is like a thick concrete floor—it has been tested multiple times and holds firm, showing that there is significant demand for the asset at that price.
- The Ceiling (Resistance)
- The ceiling of a building sets the upper limit for the elevator's movement on a given floor. This is the market's resistance level. A resistance level is a price point where selling pressure is strong enough to prevent the price from rising further. When the "elevator" hits the ceiling, it encounters a large number of sellers who are ready to take profits, pushing the price back down. A strong resistance level is like a low ceiling—the price hits it and retreats, indicating that many investors believe the asset is overvalued at that point.
Breaking Through: New Levels
The most dynamic part of the analogy is what happens when the elevator breaks through a floor or ceiling.
Breakout (Breaking the Ceiling):
When the price has enough momentum to push through the resistance level (the ceiling), it has essentially moved to a new, higher floor. This is a significant event. The old ceiling, which was previously a barrier, now becomes the new floor. This is a key trading principle: old resistance often becomes new support. The market has established a new, higher trading range, and if the price falls back to that level, it will likely find buyers there, who now see it as a good value.
Breakdown (Breaking the Floor):
Once if price falls from that floor (Support level) which is called as Breakdown in technical language, then lower floor can be the next stop for elevator (Next Support for price), The old floor, which once provided support, now becomes a new ceiling. This is the reverse principle: old support often becomes new resistance. If the price tries to rally back up, it will likely get stuck at this old support level, as it's now seen as a good place to sell.
Structural Integrity (Volume)
Think of market Volume like a construction team. When a lot of people are involved (high volume), the structure is stronger.
Imagine a ceiling in the market. If lots of buyers (high volume) break through it, that's like a robust construction team building a new floor. It's unlikely to collapse.
On the other hand, if sellers break through a floor with high volume, that's a strong sign they're serious about the downward move.
But if the volume is low, it's like a weak construction team. Even if they break through, the move might not last. It's like a flimsy wall that could easily be reversed.
So, volume gives us a sense of whether the market's moves are strong and reliable, or weak and likely to change.
I am not Sebi registered analyst.
My studies are for educational purpose only.
Please Consult your financial advisor before trading or investing.
I am not responsible for any kinds of your profits and your losses.
Most investors treat trading as a hobby because they have a full-time job doing something else.
However, If you treat trading like a business, it will pay you like a business.
If you treat like a hobby, hobbies don't pay, they cost you...!
Hope this post is helpful to community
Thanks
RK💕
Disclaimer and Risk Warning.
The analysis and discussion provided on in.tradingview.com is intended for educational purposes only and should not be relied upon for trading decisions. RK_Chaarts is not an investment adviser and the information provided here should not be taken as professional investment advice. Before buying or selling any investments, securities, or precious metals, it is recommended that you conduct your own due diligence. RK_Chaarts does not share in your profits and will not take responsibility for any losses you may incur. So Please Consult your financial advisor before trading or investing.
EURUSD Breakdown Bearish Trend Continues or Demand Zone Reversal🔍 Chart Breakdown: EUR/USD (30-min TF)
Trend Overview:
Previous Trend: Bullish channel structure (highlighted in blue).
Current Momentum: Strong bearish breakdown following a clear range phase.
The chart shifted from consolidation → breakdown → aggressive bearish continuation.
🧱 Key Technical Highlights:
1. Bearish Breakout:
Price broke below the ascending trendline and exited the ranging box, confirming a bearish shift.
Multiple Breakdown Retests (highlighted with red arrows) confirming structure failures and validating resistance zones.
2. Range Zone (Distribution Phase):
Price moved sideways within the green rectangle (“RANGE”), indicating accumulation/distribution before the selloff.
The breakdown from this range confirmed bearish momentum.
3. Demand Zone Test (Now in Play):
Price is approaching/hovering around a demand zone (green box) marked as a critical support.
Buyers may react here, offering two key scenarios:
Bounce back to retest resistance around 1.1600 (highlighted).
Breakdown below demand, leading to further decline toward next major support zones (1.15354 and 1.15040).
4. Price Reaction Zones:
🔴 Resistance zones are clearly marked where breakdown retests occurred.
🟢 Demand zone with bounce-or-break logic provides directional bias.
🧭 Potential Scenarios (Marked on Chart):
✅ Bullish Case:
If demand zone holds, expect:
A corrective rally toward 1.1600–1.1620.
Watch for rejection signals here (could be ideal for re-entering shorts).
❌ Bearish Case:
If breakdown below green demand zone occurs, targets:
1.1535 (local structure support)
1.1504 (next confluence level; possible long-term bounce area)
📈 Indicators:
Ichimoku Cloud: Price is well below the cloud, confirming bearish control.
Structure: Lower highs & lower lows = confirmed bearish trend.

EURUSD LONG AND EDUCATIONAL BREAKDOWN ECB INTRESTRATE RELEASE The European Central Bank is expected to hold key rates for the first time in over a year on Thursday.
The Eurozone inflation rate has hit the ECB’s 2% target as the US-EU trade deal uncertainty lingers.
The EUR/USD pair could experience intense volatility following the ECB policy announcements.
The European Central Bank (ECB) is on track to leave its key interest rates unchanged after its July policy meeting, after having reduced rates at each of its last seven meetings. The decision will be announced on Thursday at 12:15 GMT.
The interest rate decision will be followed by ECB President Christine Lagarde’s press conference at 12:45 GMT.

RCI, Bear Flag On The Daily As Well As The 4hr Analyzing both the daily and 4-hour charts reveals a very prominent bear flag, which has formed following a steep decline. This pattern is often indicative of further downward movement, and it's hard to ignore the implications.
Word on the street is that they're currently in dire straits. Since the Shaw acquisition, they've hemorrhaged 11 billion in valuation. The situation is exacerbated by declining revenues and missed growth targets. In short, it's not looking promising.
If the trend continues downward, we might see the price testing the $19 USD mark sooner rather than later.
For those who are currently long on this or have any vested interest, it might be prudent to reconsider your position and cut your losses before it's too late.

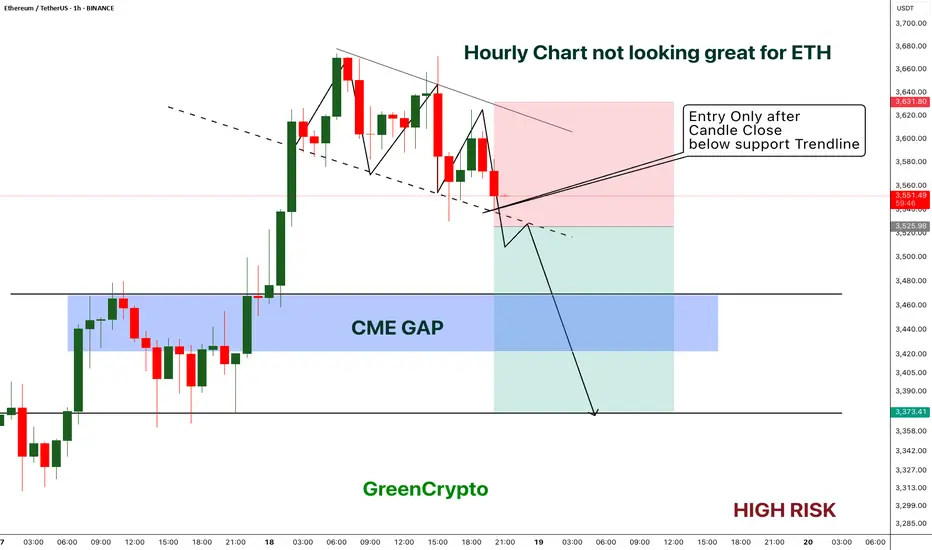
ETH - Short Trade with HIGH RISK- ETH got reject from resistance multiple times on 1H timeframe and now the price is playing near the support.
- I'm expecting overall market to cooldown this weekend, this could push the ETH to break the support
- ETH has CME gap around 3422 - 3467 range, im expecting this CME gap to be filled soon.
Entry Price: Below 3525
Stop Loss: 3631
TP1: 3471.15
TP2: 3381.76
Move SL to breakeven on TP1 hit.
Don't forget to keep stoploss.
Cheers
GreenCrypto
BTC Massive SetupConsolidation for months between 91k and 106k
- Classic Wyckoff setup as an accumulation/distribution
- Price targets of: 121.878 (122k is the popular target) to the upside with 75,827 on the down
- Saylor today put out news to be raising another $2 billion to buy BTC. Either he is going to be able to hold the floor or get washed out
- Trade can be taken with confirmation of breakout on either side pretty easily as momentum will be so strong that being on the wrong side will most likely be an immediate stop out

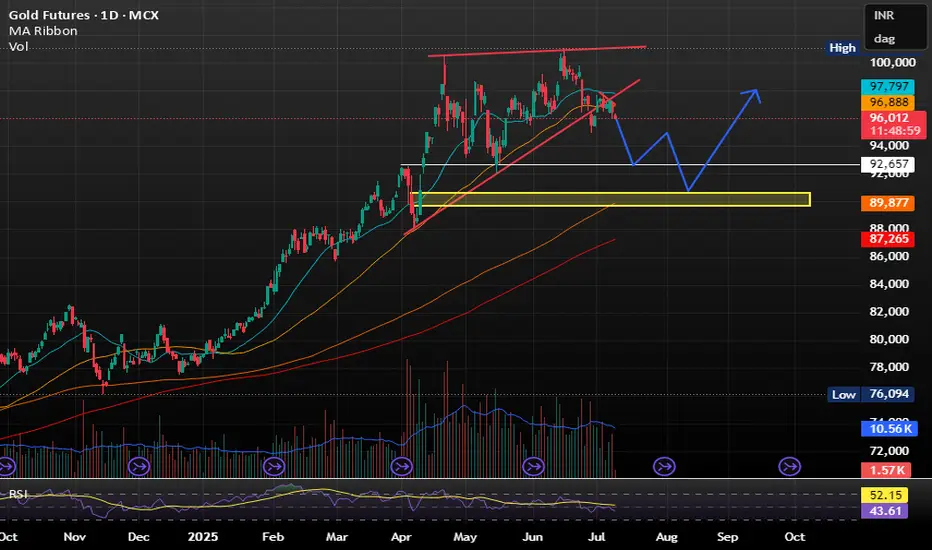
GOLD IS MELTING LIKE A ICEGOLD IS MELTING LIKE A ICE -
Trading below 20SMA and 50SMA making it less attractive at current price level.
ALSO RELATIVE STRENGH IS WEAKNING .
As per my view Sell on rise will be profitable for short term .
DOWNSIDE TARGET SHOULD BE WITHIN 92000 TO 90000 .
XLM ,1DAs BTC is Falling And BTC is given Breakout of Pattern in 4Hr , then Remaining coins will also fall drastically .
in 1D pattern of XLMUSDT , it is Breaking Down as BTC is also given Break Down of Pattern
Follow for More Ideas like This
