ASST - Asset Entities - $15.65ASSET had a decent breakout to $19.79 this morning in Today's Pre-Market Session after announcing a merger with Strive to create a Bitcoin Treasury Play. With the Stock's Short Interest in visibility by the market, it's currently up 70% after the Market Open.
We're targeting a $9.77 entry along that lower level support trend that we're tracking to retest the $15.65 again.
Breakout!

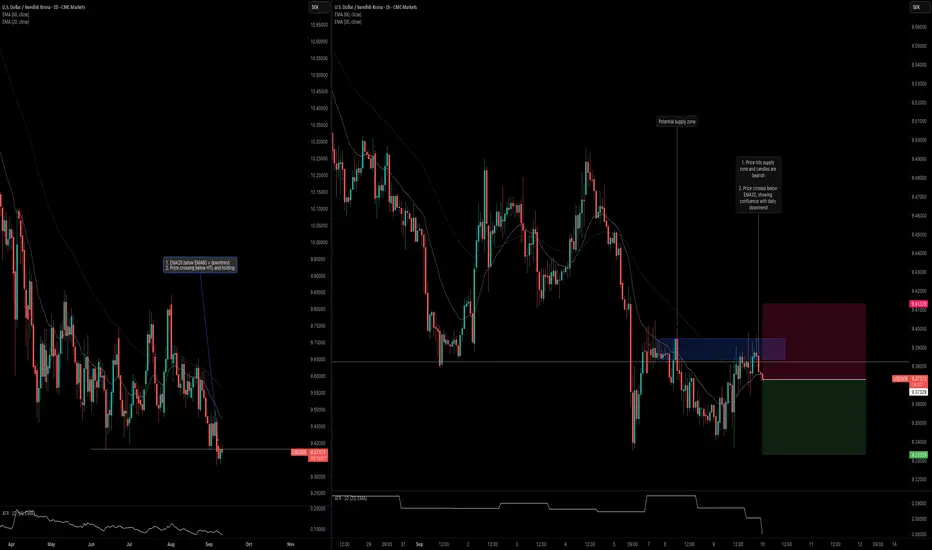
USDSEK: Trend ContinuationUSDSEK is one of the latest pairs to break below a key daily level. Here's my analysis on both the daily and intraday timeframes.
Daily Timeframe:
EMA20 is below EMA60, which indicates that this is a downtrend.
Price crossed below the horizontal trend line (HTL) and then a bullish bar formed that remain below the HTL.
H1 Timeframe:
Price entered a supply zone, and seemed to hold below it.
Price also crossed back below the EMA20, signaling confluence with the overall daily downtrend.
EUR-AUD Will Keep Falling! Sell!
Hello,Traders!
EUR-AUD made a bearish
Breakout of the key horizontal
Level around 1.7820 area
And the breakout is confirmed
So we are bearish biased and
We will be expecting a
Further bearish move down
Sell!
Comment and subscribe to help us grow!
Check out other forecasts below too!
Disclosure: I am part of Trade Nation's Influencer program and receive a monthly fee for using their TradingView charts in my analysis.

TIA ANALYSIS🚀#TIA Analysis : What Next ??💲💲
✅As we can see that there was a formation of Descending Triangle Pattern in #TIA and given a breakout. We are expecting around more than 30% bullish move in coming weeks 📈📈
🔰Current Price: $1.815
🎯 Target Price: $2.081
⚡️What to do ?
👀Keep an eye on #TIA price action. We can trade according to the chart and make some profits. Stay tuned for further analysis and stay updated with market sentiments and news.⚡️⚡️
#TIA #Cryptocurrency #TechnicalAnalysis #DYOR

DOGE Breakout Trade IdeaDOGE is building momentum after a long awaited "alt season". Could be an interesting trade setup if we can breakout from this year's resistance. I'm eyeing a 2x-3x move.

BIDU 1D: triangle breakoutBIDU 1D: triangle breakout + real-world AI deployment boosts bulls
Baidu (BIDU) breaks out of a triangle within a falling channel on the daily chart, with solid volume, reclaim of the 50MA, and approach to the 200MA. $90.09 flips into support. Targets stretch to $105.47 / $113.68 / $124.06 (Fibo levels).
Fundamentally, Car Inc just launched a robo-car rental service powered by Baidu’s Apollo unit. Fully autonomous, bookable for 4 hours to 7 days — this is not future tech, it’s live now. With a $32.6B market cap and low P/E (~12), BIDU looks positioned for revaluation if sentiment shifts.
Tactical setup: entry by market or retest of $90, stop below $82.
When the robot drives customers - you just drive the trade.

GBPUSD uptrend remains intactAfter sliding down from the channel top, GBPUSD touched the lower boundary and bounced back sharply, leaving a long wick behind. This is not just a technical signal, but also clear evidence that buyers are still firmly defending the uptrend.
If the recovery holds, the next target will be around 1.3592, with the potential to even break above the channel top and extend the bullish momentum further.
On the other hand, a decisive close below the lower boundary would flip the script, putting GBPUSD into a short-term bearish move.

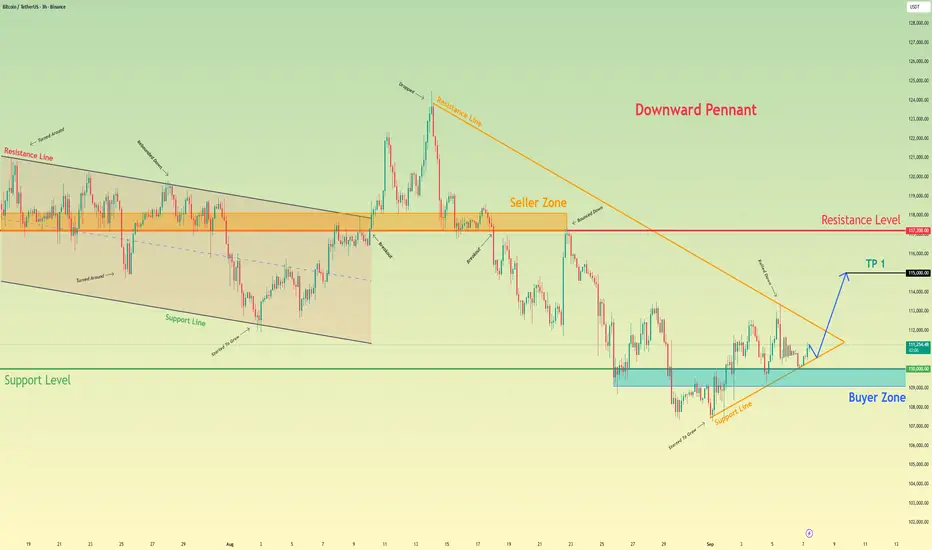
Bitcoin will exit from pennant and continue to growHello traders, I want share with you my opinion about Bitcoin. The market for Bitcoin has been undergoing a lengthy corrective phase, with the price action methodically descending since its last major peak. This bearish price action has been contained within a large downward pennant, a classic reversal pattern that suggests the preceding downtrend is losing momentum as volatility contracts. The price for BTC has been squeezed between the descending resistance line and an ascending support line. Currently, the asset is at a critical inflection point, as it is directly testing this ascending support line after a recent rejection from the upper boundary of the pattern. The primary working hypothesis is a long scenario, predicated on a bullish resolution from this dynamic support. The expectation is that buyers will defend this ascending support line, initiating a powerful rebound that is strong enough to cause a breakout above the pennant's main resistance line. This would signal a reversal of the recent downtrend. Therefore, the TP is logically placed at 115000 points, a prudent intermediate target aiming for a key area of prior price consolidation. Please share this idea with your friends and click Boost 🚀
DOGE ready to bark againTechnically , DOGEUSDT on the daily chart is breaking out of an ascending triangle. After a period of compression, the breakout on volume suggests a potential bullish continuation. The immediate target is $0.3300, and if momentum persists, the move could extend to $0.3777. Key support remains near $0.19–0.20, reinforced by the 200-day moving average.
On the fundamental side, DOGE gains attention from speculation about integration into the X (Twitter) ecosystem, with Elon Musk keeping the narrative alive. The broader recovery in the crypto market and renewed interest in altcoins also serve as supportive factors.
Tactically, a sustained close above $0.25 would confirm the bullish setup. As long as volumes remain strong, the path toward $0.33 and beyond looks realistic.
DOGE is still the classic hype-driven asset - and it seems ready to bark again.

XAUUSD: Buy to Win?Hello everyone, what’s your view on OANDA:XAUUSD ?
Looking at the H1 chart, the price action continues to tell a compelling bullish story. Each interaction with key levels has sparked notable moves in line with the trend.
Most recently, the reaction at a strong support zone showed a clear rejection. This could be an important clue, suggesting that buyers are still present and defending the uptrend.
This is just my personal observation, not financial advice. Always double-check your setups and manage risk responsibly.

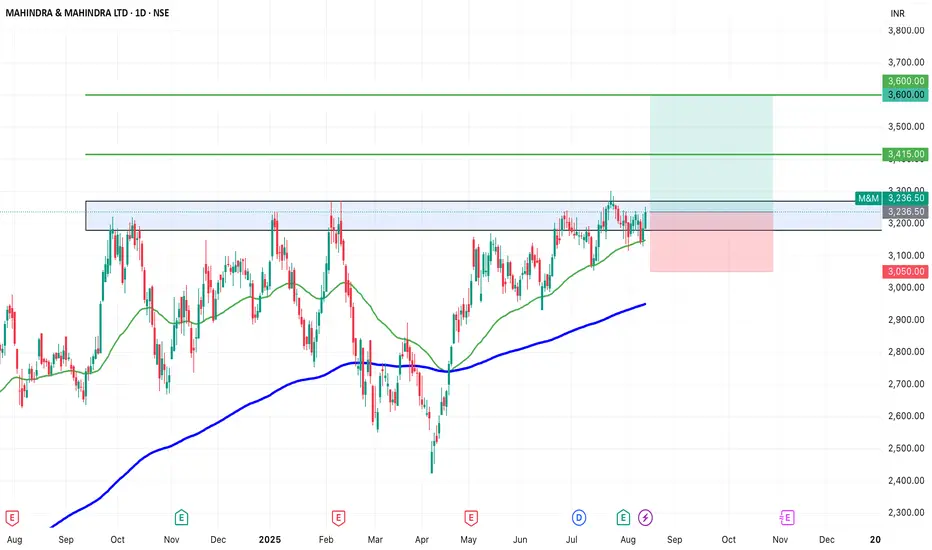
SWING IDEA - M&MM&M , a leading Indian automotive and farm equipment manufacturer, is showing signs of a potential breakout, making it a strong swing trading candidate.
Reasons are listed below :
3,200 resistance tested multiple times — now weakened and primed for a breakout
VCP (Volatility Contraction Pattern) forming, indicating accumulation
Trading above 50 & 200 EMA, confirming long-term trend strength
Inverse Head & Shoulders pattern forming, a bullish reversal setup
Target : 3415 // 3600
Stoploss : daily close below 3050
DISCLAIMER -
Decisions to buy, sell, hold or trade in securities, commodities and other investments involve risk and are best made based on the advice of qualified financial professionals. Any trading in securities or other investments involves a risk of substantial losses. The practice of "Day Trading" involves particularly high risks and can cause you to lose substantial sums of money. Before undertaking any trading program, you should consult a qualified financial professional. Please consider carefully whether such trading is suitable for you in light of your financial condition and ability to bear financial risks. Under no circumstances shall we be liable for any loss or damage you or anyone else incurs as a result of any trading or investment activity that you or anyone else engages in based on any information or material you receive through TradingView or our services.
@visionary.growth.insights
Bearish Setup Forming on AUDNZDHello everyone, what do you think about AUDNZD?
Recently, the market has shown an impressive rally, pushing straight into a key resistance zone. This is exactly the type of resistance I pay close attention to, and one that has appeared multiple times in my past analyses.
The reaction here is quite clear: price has slowed down, showing strong signs of hesitation. What interests me is not only the candlestick structure but also the volume behavior – a factor that often strengthens the conviction of whether we’re looking at a reversal or continuation.
With the current setup, my target is around 1.0990.
What’s your view on this scenario? Share your thoughts in the comments – exchanging ideas with the community is always a great way to grow as a trader.

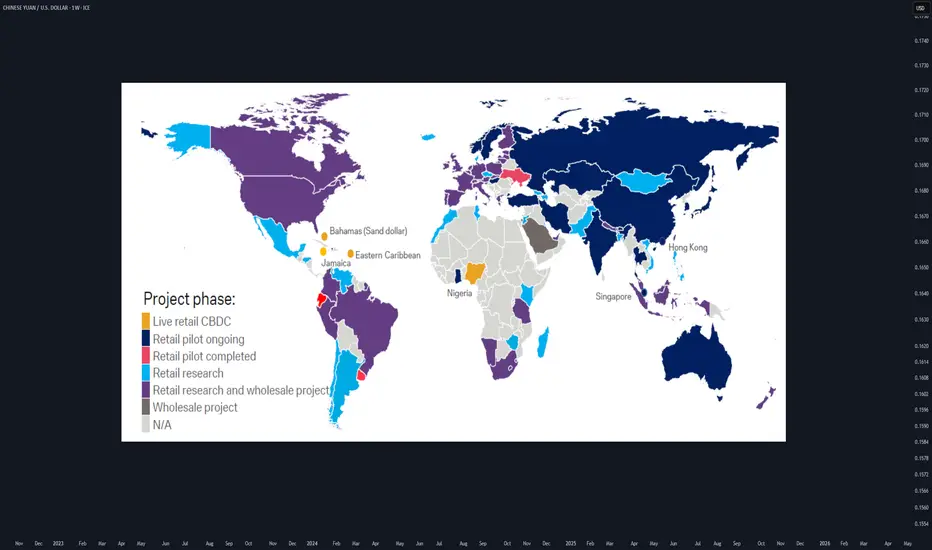
CBDCs for FXTraders :Your 2025 Guide to Digital Currency MarketsWhat if the U.S. dollar or Chinese yuan you’re trading today becomes digital tomorrow?
As of 2025, 132 countries are piloting Central Bank Digital Currencies (CBDCs) , with China’s digital yuan already in 260 million wallets. This isn’t sci-fi—it’s happening now, and it’s about to shake up forex markets.
hey I’m Skeptic :) At Skeptic Lab , we don’t chase hype—we dissect it. CBDCs are the next frontier, and I’m here to show you how to trade this shift without getting burned. In this guide, you’ll learn what CBDCs are, how they’ll mess with pairs like CNY/USD , and a beginner-friendly strategy to profit from the chaos. Let’s get ahead of the curve.
What Are CBDCs? A No-BS Breakdown
Central Bank Digital Currencies are digital versions of fiat money, backed by central banks. Think digital yuan or digital USD—same value, but on a blockchain or centralized ledger.
132 countries , including China (260M digital yuan wallets), India (digital rupee pilots), and the EU (digital euro trials), are testing CBDCs in 2025. Why? Control, speed, and lower transaction costs.
Unlike crypto, CBDCs are tied to fiat, so they’ll directly impact pairs like CNY/USD, INR/USD, or EUR/USD. Expect new volatility patterns and liquidity shifts.
I’m not sold on CBDCs being a trader’s paradise yet—central banks love control, and that could mean less freedom ( I hate XRP too, but I trade it when it gives my fuking trigger... ). But the opportunity is real if you know how to play it.
How CBDCs Will Shake Up Forex Markets
CBDCs could make cross-border transactions faster, boosting liquidity for pairs like CNY/USD. China’s digital yuan is already used in global trade pilots.
As countries roll out CBDCs, expect short-term price swings. For example, CNY/USD could spike if digital yuan adoption outpaces expectations.
Central banks might tighten forex controls with CBDCs, impacting leverage or spreads. Stay sharp—regulations are coming. Focus on CNY/USD (China’s digital yuan is live), INR/USD (India’s pilot is scaling), and EUR/USD (digital euro trials are accelerating). The hype says CBDCs will streamline forex, but I’m skeptical—centralized digital money could mean more manipulation. Still, volatility is a trader’s friend if you’re prepared.
Trading Strategy—Range Trading CNY/USD
Why CNY/USD? “China’s digital yuan is the most advanced CBDC, with 260M wallets and growing global use. CNY/USD is volatile but often range-bound, perfect for beginners.
Step-by-Step Strategy:
Identify the Range: “On TradingView, use daily charts to spot CNY/USD’s Range boxes ( Consolidation phases ). Look for consolidation after CBDC news. ”
Enter the Trade: “Buy after resistance breakout (breakout above consolidation box); sell after support breakout (breakout below our consolidation box). Set a stop-loss bellow the breakout candle or previous low in lower time frames(4h. ) or below previous support (4h) or above resistance and high (if you go for short).”
Take Profits: “clone the consolidation box and put it above or below the previous box. take partial profit (35% at rrr of 2 then 40% at rrr of 5 then 20% at rrr of 10 and close the rest when we formed lower highs and lower lows (based on dav theory)”
Risk Management: “ Risk only 1-2% of your account per trade. CBDC news can be fakout so have your other confirmations (such as RSI and PIVOT POINTS etc.)
Range trading isn’t sexy, but it’s steady. CNY/USD’s CBDC-driven swings make it a solid pick for 2025—just don’t get greedy.
Risks and What to Watch in 2025
CBDCs could tighten central bank control, reducing forex flexibility. Sudden policy shifts (e.g., China banning crypto trades again) could tank CNY/USD . Plus, tech glitches in CBDC rollouts might cause market freezes. Track CBDC adoption news on X—look for updates on China’s digital yuan, India’s rupee, or EU trials. Follow central bank announcements and IMF reports for clues.
I’m all in on spotting trends early, but CBDCs aren’t a free lunch. Stay skeptical , trade small, and always have an exit plan.
What’s your take on CBDCs in forex? Drop your thoughts bellow , and let’s debate!
Boost for more Skeptic takes :) 📈
Disclaimer: This article was written for educational purposes only and should not be taken as investment advice.
LDI - LoanDepot - $5.51 PTLDI had a strong volume breakout trade in toda's Open after breaking that $3.38 PRice Level of Resistance and currently meeting resistance at the $4.03 which could cause some consolidations, but ultimately another entry around the $3.70 to look for continuatig above $4.03 into the $5.51 currently projected price target based on trend. If she consolidates harder, we'll re-evaluate.
This comes after Citron Research Issues Report On loanDepot; Posts On X " NYSE:LDI Simple premise, real profits. NYSE:LDI is armed for the housing war — with servicing book support to $5.50 and an unpriced refi boom that could send this name marching higher."

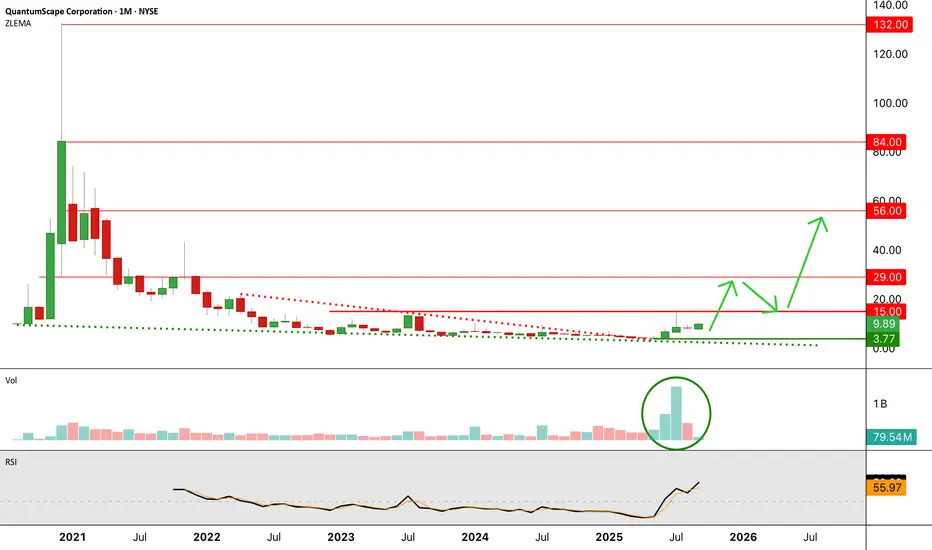
QuantumScape showing lots of potentialNYSE:QS QuantumScape just announced a demo of their battery on a Ducati motorbike. Their solid state battery is getting closer to commercialization with Volkswagen as a backer. Could reduce fire risks and improve drastically charging time. Has a 10x potential, huge base and huge recent volume makes this chart interesting on the upside. Resistances/targets in the $15, $29 even $56 areas first. Then $84 and $132. Key support at $3.77.
USDSEK: Trend ContinuationUSDSEK looks to resume its downtrend. This is observable based on the daily and 1-hour timeframe confluence.
Daily Timeframe:
Starting on the daily timeframe, EMA20 rests below EMA60, with price hovering below EMA20. This indicates that the overall trend is down.
In addition, price recently made a clean break below the horizontal trendline (HTL). It then tried to trade above it with no success.
1-Hour Timeframe:
Over on the lower timeframe, we see confluence as well. Price crosses below the ascending trendline, which indicates the overall trend is resuming. There's alignment on the daily and 1-hour timeframes.
My entry is based on the consolidating range that formed after the price pullback. Price is now breaking out of this range, which signals that momentum is picking up.

EURUSD: Correction Before the Impulse UpHello everyone, here is my breakdown of the current Euro setup.
Market Analysis
From a broader perspective, after exiting a prior Upward Channel, the price action has entered a lengthy period of consolidation. This price action has been forming a large ascending triangle, which is typically a bullish continuation pattern. The boundaries are defined by the horizontal Resistance at the 1.1740 level and an ascending support line.
Currently, the price is trading in the upper portion of this triangle, having recently bounced from the ascending Triangle Support Line. We are now approaching the critical flat resistance at the 1.1740 level for another significant test. This Resistance Zone has successfully capped all rallies for several weeks.
My Scenario & Strategy
My scenario is built on the idea of one final corrective dip before the potential bullish resolution of this triangle. I'm looking for the price to pull back from the current levels and make a move down to test the Triangle Support Line.
Therefore, the strategy is to watch for this bounce, which should then lead to a breakout above the 1.1740 Resistance. A confirmed break would validate the long scenario, with the primary target for the subsequent upward expansion set at 1.1840 points.
That's the setup I'm tracking. Thank you for your attention, and always manage your risk.

EURUSD: Higher Lows Signal a Potential Breakout?Hello everyone, Ken here!
EURUSD is looking quite interesting at the moment. Price has been consistently forming higher lows and seems to be heading toward multi-week highs, reflecting strong bullish momentum.
My expectation is for price to break above resistance somewhere near 1.1800, but first I’ll wait for a strong, confirmed candle to validate the breakout. Waiting for confirmation gives buyers a safer entry. My target would be in the 1.2XXX area, which looks completely achievable given the current market context.
That said, risks remain if the price closes strongly below the lower boundary of the channel. In that case, the bullish structure would be broken and a short-term downtrend could begin.
What’s your view?

UNH - Coming out the GuologNYSE:UNH - Coming out the Guolog
Willy broke out of it's Bearish WCB and swung from green to red.
Breaking out of downtrends while we are on the volume shelf launch pad.
MASSIVE gap up to $400 then $490 which are also both price GAP fills. 🎯

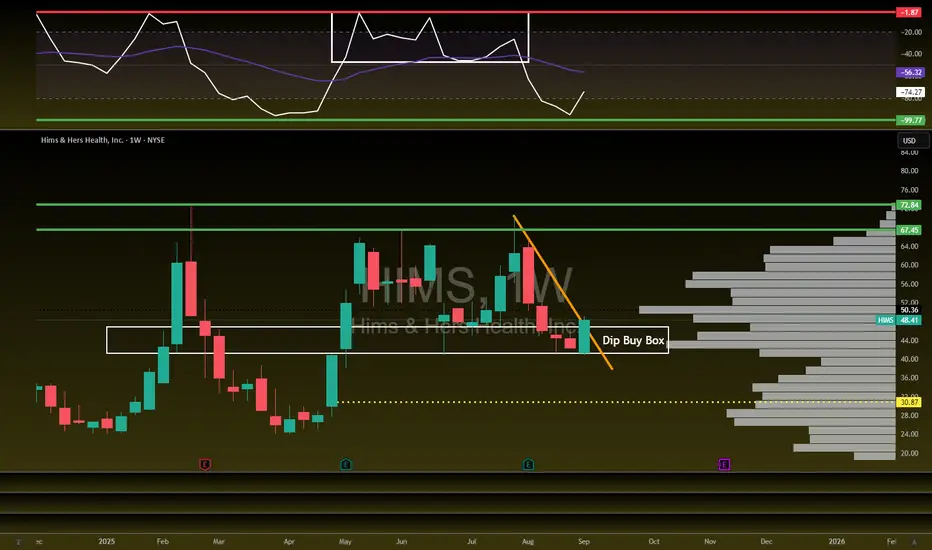
HIMS Setting up AGAIN...NYSE:HIMS - Dip Buy Box Wins Again!
Second time bouncing off our $40-45 support.
Breaking out of downtrend with a strong bullish candle.
Target $67 then $73 🎯
BTC ANALYSIS📊 #BTC Analysis
✅There is a formation of Descending Channel Pattern in daily time frame in #BTC .
Also there is a perfect breakout and retest. There is an instant major resistance and major support zone and if #BTC breaks the resistance zone then we would see a bullish move
👀Current Price: $1,10,800
🎯 Target Price : $1,21,700
⚡️What to do ?
👀Keep an eye on #BTC price action and volume. We can trade according to the chart and make some profits⚡️⚡️
#BTC #Cryptocurrency #Breakout #TechnicalAnalysis #DYOR

Gold Technical Analysis – The Pullback DeepensHi everyone, let’s take a closer look at XAUUSD today!
Gold is still trading inside a broad upward channel, but momentum has slowed and the market is now in a corrective phase. After a strong rally, the pullback looks natural — with eyes on the 3,500 zone, where multiple supports converge: horizontal, trendline, and the 0.618 Fibonacci level.
This area is the real battleground. Hold the line, and buyers may step back in with force. Lose it, and the bullish structure breaks, paving the way for a deeper decline.
Stay sharp, validate your setups, and keep risk under control.
Good luck out there!

BTC: 112,681 in sight, 115.3k if breakout holds__________________________________________________________________________________
Market Overview
__________________________________________________________________________________
BTC bounced back above the weekly pivot 111,965 after a dip below 110k and is hovering near 112.2k, still trapped inside the 104k–116k corridor. Short-term momentum is positive but capped by a 4H/6H “Pivot High.”
Momentum: Bullish 📈 in the short term within a broader range; buyers defend 111,965 but meet supply at 112,681.
Key levels:
- Resistances (4H/6H → 1D): 112,681 (240 PH), 115,300 (720 PH), 124,277 (D PH, distant extension).
- Supports (4H → 1D): 111,965 (W PH turned support), 109,905 (240 PL), 107,300 (cluster PL).
Volumes: Normal on HTF; notable 1H spike during the recent push.
Multi-timeframe signals: ST (15m–1H) bullish; mid TF (2H–6H) still corrective; HTF (12H–1D) constructive → bias improves if 112,681 flips to support.
Risk On / Risk Off Indicator: VENTE (moderate risk-off) — it contradicts the intraday bounce and can cap extensions without a catalyst.
__________________________________________________________________________________
Trading Playbook
__________________________________________________________________________________
The market is a “range with a bullish lean”: trade conditional entries, confirm breakouts, and keep stops tight.
Global bias: Neutral Buy with key invalidation below 109,900 (loss of the 240 PL base).
Opportunities:
- Continuation long: break & retest of 112,681 to target 114.0k then 115.3k.
- Defensive long: clean pullback holding 111,965 (1H higher low) to re-test 112,681.
- Tactical short: clear rejection at 112.68–113.0k (bearish 4H candle) to 112.0k then 111.0k/109.9k.
Risk zones / invalidations:
- 4H–12H close below 111,965 reopens 110k then 109.9k.
- A reclaim above 115,300 invalidates the mid‑TF bearish structure and unlocks 120–124k.
Macro catalysts (Twitter, Perplexity, news):
- FOMC: September remains “live”; a cut is increasingly priced — supportive for risk if confirmed.
- NFP/Unemployment: a soft print would fuel risk-on and breakout follow‑throughs.
- Crypto liquidity: fresh $2B USDT mint + cross‑chain reallocations — deeper books if 112,681 breaks.
Action plan:
- Long (break & retest 112,681): Entry 112.70–112.85k / Stop <111.90k / TP1 114.0k, TP2 115.3k, TP3 120.0k / R:R ~1.8R to 3R.
- Short (rejection 112.68–113.0k): Entry 112.7–112.9k / Stop >113.1k / TP1 112.0k, TP2 111.0k, TP3 109.9k / R:R ~1.2R to 2.5R.
__________________________________________________________________________________
Multi-Timeframe Insights
__________________________________________________________________________________
This is a “range‑recovery” alignment: ST drives, mid TFs resist, HTFs remain supportive.
1D/12H: Constructive above 111,965; a clean move through 112,681 sets up a test of 115,300 (major range ceiling).
6H/4H/2H: Still printing a “lower high” under 115.3k; 112,681 is the rotation hinge — rejections = 112.0k/111,965 retests.
1H/30m/15m: Bullish momentum with elevated 1H volumes; needs solid close/retest above 112,681 to avoid a fakeout.
Key divergences/confluences: ST strength + HTF support vs Risk On / Risk Off Indicator in VENTE and mid‑TF corrective tone → prioritize confirmed flips at 112,681.
__________________________________________________________________________________
Macro & On-Chain Drivers
__________________________________________________________________________________
Macro is leaning toward monetary easing while stablecoin liquidity expands — a supportive backdrop if technical levels confirm.
Macro events: Fed keeps September “live” with a cut increasingly priced; a soft NFP would add risk-on fuel; oil softens and gold appetite stays firm — near‑term inflation pressure eases.
Bitcoin analysis: Price ~111.5–112k with short‑squeeze risk if momentum continues; BTC spot ETF flows remain flat vs improving ETH — implying measured BTC spot demand but reactive to technical breaks.
On-chain data: +$2B USDT minted and cross‑chain shifts → deeper market depth; URPD/accumulation in 108–116k matches the range; neutral funding = fragile momentum.
Expected impact: A dovish follow‑through (cut pricing + soft jobs) supports the “Neutral Buy” toward 115.3k; risk‑off shocks would pressure 111,965/109,9k.
__________________________________________________________________________________
Key Takeaways
__________________________________________________________________________________
Range market with a recovery bias as long as 111,965 holds and 112,681 turns into support.
- Overall trend: short‑term bullish/neutral inside the 104k–116k range.
- Most relevant setup: confirmed breakout above 112,681 targeting 115.3k.
- One key macro factor: growing odds of a September Fed cut boost risk appetite.
Stay disciplined: trade confirmation, not anticipation, and respect stops. ⚠️
